Market awareness and profitability: case study of Mango production in Karnataka, India - Munich ...
←
→
Page content transcription
If your browser does not render page correctly, please read the page content below
Munich Personal RePEc Archive

Market awareness and profitability: case
study of Mango production in
Karnataka, India

Saripalle, Madhuri

IFMR Graduate School of Business, Krea University

January 2019

Online at https://mpra.ub.uni-muenchen.de/95334/
MPRA Paper No. 95334, posted 29 Jul 2019 19:06 UTC
Market awareness and profitability: case study of Mango production in Karnataka, India

Published in Economic and Political Weekly, Vol. LIV, No.4, January 2019

https://www.epw.in/journal/2019/4/special-articles/market-awareness-and-profitability.html

Abstract: This article presents a case study of mango farmers in the Kolar district of Karnataka to

understand the determinants of profitability and constraints faced by the horticulture industry in India in

general. The mango value chain is analysed in-depth to understand the market choices of farmers and the

role of market intermediaries and is based on data collected from a primary survey of 131 farmers. The

study uses an instrumental variable approach to model the profitability of farmers as a function of market

awareness, distance from markets, farming practices, and control variables. It finds that in addition to

age and education, distance to markets and farming practices are significant factors influencing the

profitability of mango cultivators.

Author Madhuri Saripalle (madhuri.saripalle@ifmr.ac.in) teaches at the Institute for Financial

Management and Research B-School, Sricity, Andhra Pradesh.

Article Note: The study was carried out with the financial support of the South Asia Network of

Economic Research Institutes (SANEI) during the year 2014.

Keywords: Horticulture, Mango, Market linkages, Profitability, Irrigation, Farming, Value chain

                                                    1
Agriculture is the predominant source of livelihood in South Asian countries, with the sectoral share of
agriculture in the gross domestic product (GDP) ranging from 19% (India) to 39% (Nepal). These
countries face numerous challenges in the form of small land size holdings, decreasing investment in
agriculture, environmental degradation, and the increasing globalisation of agriculture, resulting in cheap
imports which threaten the livelihoods of several farmers. As a result, there is an increasing trend towards
crop diversification in South Asia in favour of high value-added horticultural commodities, livestock, and
fish products. Horticulture not only has a high employment potential but can also contribute to the export
revenues.1
In India, the annual rate of growth of net value added of agro-industries at constant prices increased from
5.15% during the pre-reform period (1985–1990) to 8.3% during the post-reform period (1991–96)
(Gandhi et al 2001). With the launch of the National Horticulture Mission by the central government in
2005–06, there was a spurt in area and production of fruits and vegetables from 11.8 million hectares in
2004-05 to 16 million hectares in 2015-16 (Horticulture Statistics, Government of India, 2017) .
However, despite these developments, the horticulture sector has not performed well in export markets
and the share of fruits and vegetables in total exports has fallen steadily from 28 percent in 2009-10 to 14
percent in 2015-16 (APEDA, 2017).The reasons cited included lack of infrastructure and the presence of
intermediaries among others. At the same time, the initial thrust on horticulture and the various subsidies
to promote the industry, resulted in the excessive use of chemical fertilisers and pesticides and
exploitation of water resources through indiscriminate digging of borewells, jeopardising the
sustainability of the eco-system and farmer livelihoods in many regions.
There is lack of systematic evidence about the impact of government policies on different types of
farmers engaged in horticulture. Case-based and anecdotal evidence is inconclusive with respect to the
success or failure of these policies in regard to increasing the growth rate of exports or improving farmer
livelihoods. This article presents a case study of mango farmers in the Kolar district of Karnataka to
understand the determinants of profitability at the farm level and constraints faced by the horticulture
2industry in India in general. The Kolar district has the highest share of mango production in Karnataka
and has also faced a water crisis in recent years.
Section I gives a background of the study, followed by section II which describes the marketing channels
available for mango. Section III presents the literature review on the determinants of profitability. Section
IV discusses the data and methodology, followed by results and policy implications in section V. The
findings are important from a policy perspective
I. The Background
It is a well-known fact that India is the largest producer of mango in the world (40%), followed by China
and Thailand. In 2012–13, the area under mango cultivation accounted for 36% of the total area under
fruit production, and the quantity produced was about 22.1% of the total fruit production of India.
Although India is the top producer of mangoes in the world, its productivity is very low because of post-
harvest losses, poor infrastructure, and size of orchards among other reasons (Banerjee 2011). Further, its
share in the export of mangoes or processed mango products is comparatively low and it ranks fifth
globally in the export of mangoes. The export of mango pulp on the other hand is almost three times that
of export of fresh fruits from India. While the mango production has increased in absolute terms, the
sector is facing constraints with respect to not only domestic production but exports as well since 2009–
10. Table 1 indicates the falling area under mango cultivation as well as its falling share in the total fruit
production (Table 1).
Table 1: Mango Production in India
Year Area % of Production % of total Productivity
(1,000 total fruit (1,000 MT) fruit (Production/Ha)
Ha) area production
2002–03 1,623.4 42.9 12,733 28.2 7.8
2003–04 1,906.7 39.8 11,490 25.2 6.0
2004–05 1,970 39.7 11,830 24.0 6.0
2005–06 2,080.7 39.1 12,663 22.9 6.1
32006–07 2,153.7 39.1 13,734 23.1 6.4
2007–08 2,201.0 37.6 13,997 21.3 6.4
2008–09 2,309.0 37.8 12,750 18.6 5.5
2009–10 2,312.3 36.5 15,027 21.0 6.5
2010–11 2,297.0 36.0 15,188 20.3 6.6
2011–12 2,378.1 35.3 16,196 21.2 6.8
2012–13 2,500 35.8 18,002 22.1 7.2
2013–14 2,516 34.3 18,431 20.7 7.3
2014–15 2,163 34.7 18,527 20.7 8.5
2015-16 2209 35.1 18643 20.7 8.4
2016-17 2263 34.9 19687 21.2 8.7
Source: Indian Horticulture Database 2009, Handbook on Horticulture Statistics 2014, Horticulture
Statistics at a Glance 2017, Government of India.
The lack of profitable marketing opportunities is one among the several constraints faced by farmers.
Specifically, the marketing channels for small and medium farmers are circumscribed by credit relations,
high transaction costs, and lack of transparency in price fixation. To support the cultivation of traditional
crops and cash crops like soybean, technology has been introduced and information dissemination
systems like e-choupals have been established. This has made the farmers more aware, resulting in
competitive prices and profitable business opportunities (Goyal 2010). Despite these developments, the
majority of small and medium farmers continue to be heavily dependent on wholesale agents and traders
for market information and credit facilities, which binds them in an informal contractual relationship with
the latter (Saripalle 2016).
The traditional agricultural wholesale markets in developing countries are dominated by wholesale
agents/contractors who not only minimise marketing risks by aggregating the agro-products but also are
the sole financiers for small farmers, helping them meet input and irrigation costs. Section 2 discusses in
detail the marketing channels available for the mango farmers in Kolar district.
An important reason for the declining productivity (production per hectare) of the mango crop, (at least
until 2011–12) has been the high cost of irrigation and declining water tables in many agricultural
regions. As mango is grown during summer, farmers have to rely on good irrigation methods for
4improving fruit yield despite the fact that it is not a water-intensive crop. This has increased the pressure
on water resources, resulting in declining water tables. Hence, the role of declining water tables needs to
be addressed with a sense of urgency by introducing water saving techniques. A randomised experiment
(Spreer et al 2009) on the impact of water-saving techniques on mango yields in Thailand found that
during the dry season the trees that were irrigated using water-saving techniques showed greater yield as
compared to other trees.
India has also not been able to export mangoes successfully because of the lack of infrastructure for
complying with food safety standards. Among the top export destinations, the United Arab Emirates
(UAE) imports almost 69% to 70% of India’s total fresh mango exports. However, exports have been
falling since 2011–12 because of both political uncertainties in the UAE as well as compliance issues
(Table 2).
Table 2: Export of Fresh Mangoes from India
Quantity Value (₹
(MT) Lakhs)
2010–11 58,863 16,484
2011–12 63,441 20,974
2012–13 55,585 26,472
2013–14 41,280 28,543
2014–15 42,998 30,254
2015–16 36,329 31,710
2016–17 53,177 44,555
Source: GOI 2014; GOI 2017
A major reason for the decline of mango exports since 2011–12 is the pesticide residue and presence of
fruit fly infestation, which has resulted in the ban of Indian mangoes in the United States, European, and
Japanese markets (Jha 2016; Goyal et al 2017). Japan had placed an embargo on the import of mangoes
from India in 1986, and the ban was only lifted in 2003 once the Vapor Heat Treatment (VHT) facilities
to sterilise the fruit were in place (Business Standard 2013). The related infrastructure pertaining to
5washing, drying, pallet, pre-cooling and cold storage facilities are currently available only in Mumbai and
have been sponsored by the Maharashtra State Agricultural Marketing Board.
Another reason behind the low demand for Alphonso mangoes is the colour and appearance which do not
compare well with mangoes from Israel and Latin America (Hegde 2006). In India, the mango production
is the highest in the state of Uttar Pradesh followed by Andhra Pradesh and Karnataka. This paper
analyses the case of Karnataka’s mango growers, specifically their profitability, the costs they incur, and
their market choices. It tries to understand the role of market intermediaries and the credit relationship
between the farmers and wholesale agents in the state.
The Kolar district of Karnataka has the highest share of mango production in the state (Table 3). Within
the Kolar district, Srinivasapura taluk has the highest share of mango production (50%), and is known for
its mangoes in the entire state. In terms of exports to countries such as the US and Europe, Uttar Pradesh,
Maharashtra and Andhra Pradesh have a higher share in exports of mangoes as compared to Karnataka,
where mangoes are mostly supplied to the fruit processing industry.
Kolar is a relatively dry area, categorised under the Agro climatic zone 10.2 The increasing dependence
on rainwater for irrigation and the government incentives for the horticulture sector encouraged farmers to
switch to mango cultivation post 2004–05 (Mittal 2007; Kumar 2012). The subsidies for investment in
irrigation also resulted in the construction of a number of borewells in the region. The district now has the
highest concentration of deep borewells, resulting in over exploitation of water, with zero water available
for groundwater irrigation (Nagaraj et al 2011). In addition, the water table has also declined because of
eucalyptus plantations.3 Hence, with a rapid decrease in the water table, the production per hectare of
mango in the Kolar district has fallen drastically since 2011–12 (Table 3).
Table 3: Area and Production of Mango in Karnataka4
Kolar district Karnataka State
Area Production Production Area Production Production
Year (hectares) (tonnes) per (hectares) (tonnes) per hectare
6hectare
2005–
06 45,587 1,68,034 3.7 1,181,58 4,50,688 3.8
2006–
07 41,868 1,68,519 4.0 1,16,780 6,09,383 5.2
2007–
08 32,280 58,556 1.8 1,08,774 3,58,560 3.3
2008-09 32,831 1,09,360 3.3 1,14,972 4,85,384 4.2
2009–
10 33,131 1,36,135 4.1 1,20,018 5,10,407 4.3
2010–
11 40,769 1,81,218 4.4 1,37,197 6,65,012 4.8
2011–
12 41,570 2,19,032 5.3 1,42,546 7,98,290 5.6
2012–
13 42,170 1,71,927 4.1 1,44,753 7,61,893 5.3
2013–
14 45,000 2,00,000 4.4 1,60,000 8,00,000 5.0
Source: Directorate of Economics and Statistics, Karnataka 2013
The harvesting of mangoes starts in the first week of May and lasts until the end of June or the first week
of July. During the first week of May, Alphonso is harvested and mostly sold to juice and pulp
manufacturing companies. From 25 May onwards, more popular varieties like Banganapalli come into the
market and are exported to all states in the country. Mangoes are also sold to agents from other states in
India or to agents from markets located in West Asia. In the first week of June, Totapuri and Neelam are
harvested and together comprise around 70% of all mangoes produced in Karnataka. The green varieties
are sold to pulp manufacturing units, while the more ripe varieties are sold across India. There are many
local varieties which are sold in the domestic market within the state. The largest proportion of farmers
was found to be growing Totapuri, followed by Neelam and Badami/Alphonso. In terms of price, Badami
fetches the highest rate followed by Banganapalli and Mallika (Table 4). The next section describes the
various marketing channels available to the farmers.
7Table 4: Mango Varieties and Prices
Price/quintal
Name of Mango Number of farmers
Variety growing these varieties (INR Rupees)
Malika 27 2,500
Badami/Alphonso 76 3,000
Banisha 67 2,000
Totapuri 117 1,300
Nelam 92 1,300
Rasapuri 6 2,000
Rajgira 47 900
Khurdoos 5 900
Banganapalli 3 2,500
Mulgova 6 1,200
Sindoora 1 800
Kalapad 2 500
Laddu 1 500
Amleta 1 500
Source: Generated by the author using data collected from the field survey.
II. Marketing Channels
In Srinivasapura, within a radius of 200 kilometres, there are 18 retail marketing centers, bordering the
states of Andhra Pradesh and Tamil Nadu. The farmers in the region sell their produce through three
predominant marketing channels: they sell at the farmgate to the pre-harvest contractor; they sell at the
village Agricultural Produce Marketing Commission (APMC) yard; or they sell directly in city retail
markets or government authorised wholesale centers such as the Horticultural Producers’ Co-operative
Marketing and Processing Society (HOPCOMS)5 and Safal. The value chain is illustrated in Figure 1,
where the yellow arrows depict the credit relations circumscribing the value chain.
8A majority of farmers (60%) sell their produce at the farm gate to the pre-harvest contractors, who in
most cases are also the wholesale agents at the APMC yard, under a mutually agreed contract. The
contract is verbal in a majority of cases. The contractors visit the farm during the post-flowering period
and evaluate the farm. Based on their evaluation, an amount is decided and payment is made in full. The
cost of transportation is borne by the farmers. From the primary data collected, it can be seen that the pre-
harvest contractor is the most common market agent of the region (Table 5). The table also shows the
average revenues and profits of farmers for each marketing channel.
Table 5: Distribution of Farmers by Marketing Channels
Average Average
Revenue profit
Market Percent per acre per acre
Farm gate/Pre-harvest contractor 52 31,452 14,838
APMC 32 25,476 -790
Village market 12 30,585 9370
City Market 4 23,051 -17260
Total 100
Source: Generated by the author using data collected from the field survey.
The second marketing channel is the nearest APMC yard, which is situated at Srinivasapura. Generally,
mangoes are supposed to be sold on an auction basis here. But this kind of auction system rarely exists.
The prices are fixed by wholesale agents operating in the yard, with farmers lacking any power to
negotiate them. For small farmers, the volume produced usually is below the minimum quantity required
by corporate buyers. Hence, they are forced to sell at the APMC yard at a fixed rate. The farmers from
nearby villages travel to the market yard to sell their produce. In many cases, the farmer sells it to the
wholesale agent or the pre-harvest contractor, who pays the farmer in advance after deducting a 10%
commission. All the costs related to activities like grading, transportation, packing and storage are borne
by the contractors. The wholesale commission agents have tie-ups with agro-processing units like Mother
9India farms, Pepsi and Dabur, which are located in Andhra Pradesh. These agro-processing units are not
located in Karnataka because of the wet and humid climate in April, which is not conducive for pulp
production.
According to the Agricultural Produce Marketing Committee Act, 1960 (APMC Act), the entire state is
divided into smaller geographical areas or markets that are managed by marketing committees constituted
by the state government. Under the Act, farmers are prohibited from selling their produce directly to
consumers and have to sell to authorised middlemen so that they can get a fair and consistent price for
their produce. As per the APMC Act, agricultural produce has to be brought to the marketing yards set up
by the government, and licensed wholesale marketing agents should auction the produce to the traders or
retail agents from nearby regions or other states.
However, this system has been misused by the wholesale marketing agents who collude with the traders
and fix prices overnight (Deccan Herald 2010). During the field survey interviews, many of the farmers
reported that the pricing of mangoes was not transparent and there was collusion among the traders and
wholesale agents and preharvest contractors. Most often, farmers were indebted to the village wholesale
traders and pre-harvest contractors, who gave them money to buy seeds and fertilisers and then buy back
their produce after deducting the market commission.
Further, s during the interviews it was reported by some farmers that that some big farmers also lent to the
wholesale agents and indirectly got access to the APMC yard without having proper license, implying
that there could also be informal credit linkages between the wholesale agents and a few big farmers. In
Figure 1, the two-way arrow depicts the credit relationship that exists among the farmers and the APMC
wholesale agents.
The third marketing channel used by farmers is the city market. In the city market, farmers can sell to
retail agents or to government authorised wholesale markets—HOPCOMS and Safal. Mangoes are sold to
processing units like Safal,6 a government initiative to set up a terminal wholesale market, which works
10on the principle of clock auction with backward and forward linkages in the supply chain. It buys fruits
from the farm gate and brings it to its collection centre from where these are transported to the company.
Since SAFAL procures only produce which complies with certain grade standards, the farmers are forced
to partly depend on commission agents or village merchants to lift their remaining produce. Some farmers
go to the city market directly and sell their mangoes to government approved markets known as
HOPCOMS.
Figure 1: Mango Value Chain
Source: Generated by the author using data collected from the field survey.
The farmers who want to directly sell to exporters have to obtain a GlobalG.A.P certification. 7 The
produced mangoes are graded, and only about 50% of Grade A is exported. The survey conducted in this
study did not have any such farmers in the sample. In the survey, mangoes were mostly exported to other
11cities and states such as Delhi and Rajasthan.. Having analysed the Mango value chain, the paper next
discusses some of the important factors that influence farm profitability including socio-economic factors,
the choice of market channels and dependence on pre-harvest contractor in the value chain.
III. Determinants of Profitability
Socio-economic characteristics such as education, land size, age, and membership in organisations are
important determinants of farm profitability. A recent study in Meerut found that floriculture adoption
(commercial tuberose cultivation) is highly correlated with education, mass media exposure, land holding,
and social participation (Singh et al 2010). However, it has been found that in rural areas participation in
social networks through non-governmental organisations (NGOs), farmers organisations or industry
associations in the food sector is limited (Mahendra and Rao 2005). Infrastructural constraints, lack of
storage and post-harvest facilities, and weak labour legislation laws are major impediments to improve
crop yields and profitability. A study on grape farmers in Chile (Collins 1995) found that small farms in
the Sao Francisco Valley could produce grapes at a much lesser cost than large farms because of the use
of family labour. However, their market access was limited because of the lack of post-harvest facilities
and marketing costs.
Access to high value markets (non-local and export markets) is an important determinant of higher
returns. A study (Roy et al 2008) on Mahagrapes, a co-operative partnership firm, finds that farmers who
exported their produce had higher returns compared to those did not. A combination of collective action
and public private partnerships resulted in the cooperative (Mahagrapes) to export successfully. The study
also finds that some of the important factors influencing the decision to become a member of the
cooperative were farmers’ education, age, distance from a city, and transaction costs of inputs not
provided by the cooperative.
12Rural peasants in developing economies are dependent on the wholesale agent for marketing and never go
beyond the nearest market. Therefore, a prerequisite to market access is market awareness which is an
important factor that can influence the participation in export markets. In the context of floriculture, it was
found that the commercial success of floriculture depended on the entrepreneurial ability of the small
farmers, that is the ability to identify and access distant but high value markets (Prakash and Bahadur
2005). This in turn depends on education, participation in cooperatives and other organisations, and
availability of labour and irrigation facilities (Echeverría et al 2009). Education enhances agricultural
production mainly by influencing farmers’ decision-making ability and, less importantly, enhancing their
technical capability in both traditional and modernised agriculture environments (Pudasini 1983).
In the present study, given the lack of a direct connection between farmers and markets, it was not
possible to infer whether their produce was being exported or not. Farmers, as producers, are only
interested in the cultivation of the crop and not interested in the final destination of their produce. A
majority of mango farmers still rely on intermediary wholesale agents/contractors for marketing their
produce. Market awareness was captured by asking the farmers if they were aware of the final destination
and whether the mangoes they produce were sent to other states in India as well as exported to other
countries. The mangoes are sent to other states in India, where these are further processed and then
exported to countries in the Middle East.
IV. Data and Empirical Modeling
This section describes the data and empirical modeling strategy in detail. The study uses primary data
from a survey of 131 farmers in Srinivasapura, Kolar district in Karnataka, conducted during 2014. The
farmers were chosen from a random sample of 11 villages. A majority of farmers in the area were small
and medium farmers who sold their produce locally or to the processing companies through agents. To
obtain a list of farmers who sent their mangoes to other states in India or to other countries, information
was collected from one of the biggest wholesale agent who could identify some of the big farmers who
were following good farming practices. Table 6 shows that the average size of landholding was 12 acres
13and production increased with the size of the landholding. However, sales do not show such a linear
relationship with landholding.
It was found that 36% of the farmers were either illiterate or had just gone to primary school, 45% were
educated up to the secondary level, and the remaining 19% had a college degree. The average family size
was seven members, with most of the male members being involved in mango cultivation. Their years of
experience in mango cultivation ranged from five to seventy, the latter indicating the involvement of
previous generations of family members. The revenue from the crop depended on the type of mango
varieties grown (ranging from three to nine varieties), dependence on other vegetables, and the choice of
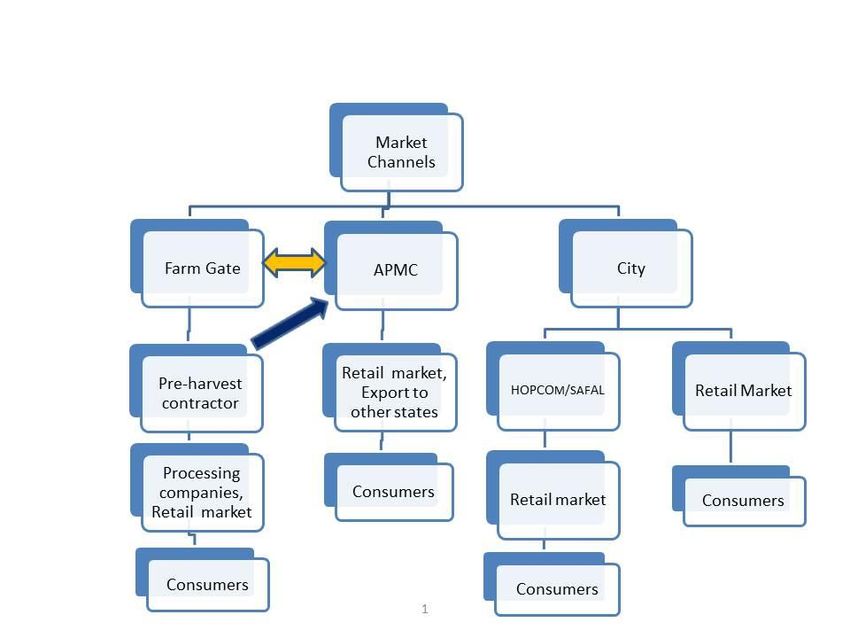
market and ranged from ₹2,00,000 to ₹40,00,000 per season (Table 7). Figure 2 shows the distribution of
land holdings in the sample, where majority of farmers are small with less than five acres of land.
Table 6: Acreage and Production Details
Average income Average
Average
Village from sale of production in
area (Acres)
mangoes (₹) quintals
Gathahalli 5 63,750 127
Hodali 6 1,59,333 139
Kallur 6 1,38,263 127
Chiruvarahalli 8 42,000 127
Dalasanuru 8 1,34,455 156
Chillapanahalli 9 1,24,900 107
Kiruvara 11 2,24,000 206
Hoovahalli 15 2,15,500 153
Palya 18 1,24,000 164
Settihalli 22 3,51,364 287
Arahalli 26 1,87,556 225
Source: Generated by the author using data collected from the field survey.
14Table 7: Sample Characteristics
Standard
Variable Obs Mean Deviation Min Max
Age 131 50 14 24 86
Family members 131 7 5 2 42
Persons in farming 130 3 3 1 30
Years of Experience 130 22 13 5 70
Revenue from Mango (₹) 131 2,61,276 4,25,812 2,600 40,50,000
Illiterate (count) 131 20
Primary education (count) 131 28
SSLC (count) 131 59
Grad (count) 131 24
Total Area 131 11 16 1 110
Varieties 131 3 1 1 9
Production in quintals 131 163 202 1 1,400
Quantity sold 131 159 202 1 1,400
Source: Generated by the author using data collected from the field survey.
Figure 2: Size Distribution of Farmers Surveyed
Source: Generated by the author using data collected from the field survey.
The farmers were classified on the basis of their market awareness, defined as the knowledge of markets
outside the state, including export markets. Interestingly, of the 130 odd farmers only 29 knew about the
destination of their produce, while the rest of them were only interested in selling their produce to the
contractor. The level of education, average size of land holding, costs and profits were all higher among
15the more aware farmers (Table 8). The farmers with better awareness also followed better irrigation
practices compared to the less aware farmers. However, the amount of money lent under contract by the
agent was marginally higher for farmers who were less aware of other markets.
Table 8: Differences in Age, Education, Costs and Farming Practices Among Two Groups
Aware of non-local Not aware of other
and export markets markets
Age (average) 46 51
Experience in years (average) 24 21
Illiterate % 3% 19%
Primary % 7% 25%
SSLC% 59% 41%
Grad% 31% 15%
Area (average acres) 18 10
Fixed cost per acre (₹) 3,526 5,127
Variable cost per acre (₹) 23,929 19,940
Profits per acre (₹) 10,443 7,220
Transport cost (₹) 1,800 891
Money Borrowed (₹) 80,138 82,748
Sell to Pre-harvest contractor 12 71
Sell to APMC 12 30
Sell directly in City market 2 3
Irrigation_per month 6 4
Manure 2 3
Pesticides 1 2
Varieties (average) 4 3
Source: Generated by the author using data collected from the field survey.
The study analyses the determinants of profitability per acre as a function of market awareness and farmer
specific control variables. The differences between the two groups of farmers could either be because the
farmers self-select themselves (assuming they are picked from a random sample with similar attributes) or
because of some unobservable characteristics that are influencing their awareness about export markets.
Market awareness is thus an endogenous variable, which is in turn is dependent upon factors such as
distance from markets, education, and years of experience.
16The standard OLS (ordinary least squares) estimation will not be able to capture the endogeneity of the
export variable and this technique will result in omitted variable bias. To address the endogeneity of the
explanatory variable, one can use selection models or instrumental variable model. Heckman type
corrections are typically used when you have a truncated variable. Instrumental Variable Least Square
regression (IVLS) is used in case of endogeneity, but only when you have observations for all variables
and outcomes. Studies (Angrist and Krueger 1991; Kelejian 1971) have shown that one can use a dummy
endogenous variable in an instrumental variable regression, and the linear regression for the first-stage
estimates generates consistent second-stage estimates even with a dummy endogenous variable. It is
assumed that instruments of the endogenous variable are not correlated with the stochastic error term of
the profit equation.
The profitability of mango production is modelled as a function of market awareness, farming practices,
and other socio-economic variables such as size of land ownership, age, fixed costs incurred, money
borrowed from the wholesale contractor, and subsidy availed. Farming practices are considered as
entrepreneurial qualities of farmer that influence profitability directly.
Πi = α + δdi + βXi +ɛi; where,
Πi is calculated as profit per acre incurred during the season and defined as the total revenue per acre
variable cost and per acre fixed costs, where fixed costs are apportioned over the age of the crop assuming
a discount rate of 10%. Since it takes up to six months for a mango plant to yield fruits, the variable costs
components were collected for the gestation period (up to six months) and after the gestation period
separately. The fixed costs included seedling costs, field preparation, support material used, irrigation
costs (investment in borewell), and any other costs. The fixed costs were apportioned over the age of the
farm, using a discount rate of 10% to reflect the opportunity cost of capital. Table A1 shows the cost
components across all age groups of the farms.
17di is the dummy variable that takes the value 1 if farmer is aware that his mangoes are being exported and
the value is 0 otherwise. The endogeneity of the market awareness is taken care by modelling it as a
function of variables that are not directly correlated to the control variables from the profit regression.
di = α + θZi + ui; where, Zi includes distance from market and education availed (a dummy variable, with
the base variable being illiterate).
Xi is the set of control variables that include age and land size. Other dummy variables included: pre-
harvest contractor, that is, whether the farmer borrowed money from a pre-harvest contractor; the number
of times in a month the crop was irrigated during the gestation period; and the number of times in a month
pesticides were applied during the gestation period.
Empirically the equation to be estimated is as follows:
Log Profitability = α + β1 log Size + β2 log Age + β3 log Age_farm + δ1 market_awareness + δ2 Contractor
+ δ3 irrigation_frequency + δ4 pesticide_frequency + δ5 manure_frequency + δ6 DAP_frequency +e, where
profitability is defined as profit per acre. In some cases, calculated profits were negative, which were
transformed to take care of extreme values;8 size is the acreage of the farm; age is the farmer’s age; age
of farm is the farm’s age, market awareness is whether the farmer is aware of the final destination of his
produce; contractor is a dummy variable that refers to whether the farmer has borrowed money from the
contractor; irrigation, pesticide, manure and Diammonium phosphate (DAP) frequency refer to the
number of times per month they are applied on the field and “e” is the stochastic error term.
V Results
Table 9 shows the mean values of all the variables used in the model. As can be seen, there is a lot of
variation in profitability, irrigation frequency, and distance to the market.
18Table 9: Descriptive Statistics
Standard
Variable Obs Mean Deviation Minimum Maximum
log profit per acre 131 1.9 10.2 -11.5 11.7
log size 131 1.9 0.9 -0.3 4.7
log age 131 3.9 0.3 3.2 4.5
log age_farm 131 2.8 0.5 1.8 4.1
Contractor_dummy 131 0.6 0.5 0.0 1.0
Irrigation_frequency 131 2.2 4.8 0.0 40.0
Manure_frequency 131 3.0 2.5 0.0 20.0
Pesticide_frequency 131 1.9 2.6 0.0 15.0
DAP_Frequency 131 0.4 0.9 0.0 5.0
Graduate 131 0.2 0.4 0.0 1.0
SSLC 131 0.5 0.5 0.0 1.0
Primary 131 0.2 0.4 0.0 1.0
Distance 128 5.6 11.5 0.0 70.0
Source: Generated by the author using data collected from the field survey.
Table 10 shows the results from the estimation. Column 1 shows the instrumental variable regression
while column 2 shows the OLS estimation. Market awareness does not have a significant impact on
profitability. The coefficient signs are the same in both cases, but the magnitude of the market awareness
is much higher when the endogeneity is taken care of under instrumental variable regression. Both the age
of the farmer and the farm have a positive and significant impact on profitability because they indicate the
experience of the farmer.
The contractor dummy variable also has a positive and significant impact on the profitability of the
farmer. Farmers who had borrowed money from the contractor had higher profitability compared to those
who did not. Among the two farming practices, the frequency of irrigation was found to have a negative
though not a significant impact on profitability, while the frequency of pesticide application was found to
have a negative impact. In terms of cost, irrigation is highly expensive because of the investment in
borewells. As described earlier, groundwater capacity is severely depleted in Kolar and investment in
irrigation is not cost-effective with the high fertilisers and pesticide use.
19In the OLS regression, size, age of farmer, age of farm, and higher education (a college degree) are
positive and significant. The number of times pesticide applied is negative and significant, implying that
higher pesticide use may be detrimental to the quality of the crop and the yield. Table 10 shows the results
from the probit equation that models the determinants of export awareness and finds education up to
graduation and distance to the market have a positive and significant impact on the awareness about
exports.
Table 10: Results from Instrumental Variable and OLS Estimation
Dep Variable =log Coefficients IV Coefficients OLS
profits (Column 1) (Column 2)
Export Awareness 7.01 (7.7) 3.02 (1.9)
Distance (km) -0.09 (0.06)
Primary 1.8 (2.8)
SSLC 0.57 (2.6)
Graduation 6.3 ** (2.8)
Log size -0.58 (1.18) -1.08 (1.06)
Log age 7.8*** (2.8) 7.7 *** (2.5)
Log age farm 4.5 ***(1.8) 4.6 ***(1.5)
Dummy
_contractor 3.4 * (1.9) 1.6 (1.7)
Irrigation_no -0.1 (0.12) -0.1 (0.12)
Pesticide_no. -0.71*(0.38) -0.74 **(0.36)
Manure_no. 0.36 (0.41) 0.34 (0.36)
DAP 0.04 (0.75) 0.16 (0.7)
Cons -42 (11.3) -41*** (10.8)
R square 0.16 0.24
N 128 128
Figures in parenthesis represent standard errors. ***, **, * represent significance at 1%, 5% and 10%
levels, respectively.
Source: Generated by the author using Stata
20Table 11: Probit Regression
Y=Market Awareness Coefficients
Distance 0.02* (0.01)
SSLC 0.9* (0.52)
Primary 0.11 (0.6)
Graduate 1.26** (0.55)
_constant -1.6 ***(0.48)
Rsquare 0.12
N 128
Figures in parenthesis represent standard errors. ***, **, * represent significance at 1%, 5% and 10%
levels.
Source: Generated by the author using Stata
Conclusions
While the paper reinforces the findings from earlier studies that suggest that the profitability of
agriculture depends on a number of socio-economic factors such as the farmer’s education and age, it also
contributes to the existing literature in two distinct ways. The first important contribution of this paper is
that it takes into account not only the marketing channels available to the farmers but also their awareness
of high value markets. Further, the role of farming practices has been captured in the analysis of
profitability, especially irrigation, manure and pesticide application. The findings are important from a
policy perspective and reinforce the role of cost- effective methods of irrigation that will improve
productivity of crops in the long run.
The analysis of the mango value chain in the Kolar region also suggests that farmers seem to be locked in
a credit-cycle with the agents, who aggregate market risks and supply mangoes to the market. What is
essentially lacking for the farmers is the lack of credit and access to markets, a gap which commission
agents try to fill and exploit. For this reason, the removal of intermediaries from the value chain does not
seem to be the solution. The farmer-agent relationship is mostly credit based, and the agents do not
provide technical advice. However, the presence of an intermediate marketing agent is essential for access
to high value markets to aggregate and minimise market risk.
21It has been recognised that traders can play an important role in linking farmers with markets (Zamil and
Cadilhon 2009). A United Nations Development Programme (UNDP) project in Bangladesh successfully
linked small farmers to local traders in a mutually beneficial relationship, which involved training and
providing technical support to the farmers to meet customer requirements. Prices should be linked to the
local demand conditions and should not be allowed to vary beyond a fixed band. Policy interventions
such as these should be done with an understanding of the regional markets involving the stakeholders so
that a win-win situation emerges for the eco-system as a whole. The implementation of schemes that
boost productivity through sustainable agriculture practices, rather than indiscriminate exploitation of
natural resources, will go a long way in restoring the health and productivity of this region.
Appendix A1: Cost distribution by Age group
=30
years 12 years years 30 years years
Variable costs per acre
(including material and
labour costs) (₹) 7,406 12,044 12,186 9,099 8,244
Tillage 2,607 2,247 1,956 2,457 2,150
Manure 2,495 3,346 2,274 2,209 1,599
Fertiliser 13 46 641 133 183
Transplantation 581 751 4489 1201 947
Irrigation 676 2204 542 533 615
Weeding 429 1,127 925 1,118 795
Pesticides 419 409 831 703 1,164
Topping 26 361 76 165 168
Harvesting 145 474 330 464 298
Grading 0 7 121 118 325
Storing 15 1071 0 0 0
Fixed costs per acre (₹) 2,279 3,453 4,741 2,486 11,124
Planting (including
seedling cost) 1,465 1,653 1,210 1,538 6,857
Field preparation 562 759 882 464 620
Support 183 661 696 413 158
Irrigation 0 318 179 68 3125
Source: Generated by the author using data collected from the field survey.
22REFERENCES
Angrist, J D, and A B Krueger (2001): “Instrumental Variables and the Search for Identification: From
supply and demand to natural experiments,” Journal of Economic Perspectives, Vol 15, No 4, pp 69–85.
Agricultural and Processed Food Products Export Development Authority (APEDA),
http://agriexchange.apeda.gov.in/indexp/reportlist.aspx
Business Standard (2013): “Japan Lifts 20 Year Ban on Mango Imports,” 19 January,
https://www.business-standard.com/article/economy-policy/japan-lifts-20-year-ban-on-indian-mango-
imports-106062300042_1.html.
Banerjee, G D (2011): “Economics of Mango cultivation,” NABARD Occasional Paper No 58,
Department of economic analysis, National Bank for Agriculture and Rural Development, Mumbai.
Central Research Institute for Dryland Agriculture (2012): Agriculture Contingency Plan for District:
KOLAR,” http://www.crida.in/CP-
2012/statewiseplans/Karnataka%20(Pdf)/GKVK,%20Bangalore/KAR15-KOLAR%2031.03.2011.pdf,
accessed in December 2016
Collins, Jane L (1995): “Farm Size and Non-traditional Exports: Determinants of Participation in World
Markets,” World Development, Vol 23, No 7.
Cox, Nicholas J (2005): “Transformations,” Durham University, from
http://fmwww.bc.edu/repec/bocode/t/transint.html, accessed in January 2017.
Deccan Herald (2010): “Mango growers bitter over violations at APMC, I July,
http://www.deccanherald.com/content/78502/mango-growers-bitter-over-violations.html accessed in
January 2016.
23Echeverría, Rodrigo, Gopinath Munisamy, Moreira Victor, and Cortes Pedro (2009): “The Export-
Production Decision of Chilean Farmers: The Case of Blueberry Producers,” Journal of International
Agricultural Trade and Development, Vol 5, No 2, pp 273–89.
GOI (2010): Indian Horticulture Database-2009, National Horticulture Board, Ministry of Agriculture &
Farmers welfare.
—(2013): “Indian Horticulture database 2012,” National Horticulture Board, Ministry of Agriculture &
Farmers Welfare.
—(2014): Handbook on Horticulture Statistics 2014, Department of Agriculture, Cooperation and
Farmers Welfare; Ministry of Agriculture & Farmers welfare.
—(2017): Horticulture Statistics at a Glance 2017, Horticulture Statistics Division, Department of
Agriculture, Cooperation and Farmers Welfare; Ministry of Agriculture & Farmers welfare.
Government of Karnataka (2013): “District and Taluk-wise Statistics of Major Horticultural Crops in
Karnataka State 2011-12,” Directorate of Economics & Statistics,
http://www.horticulture.kar.nic.in/Design_final/A&P%20%20Final%202015-16.pdf
Goyal, Aparajita (2010): “Information, Direct Access to farmers and Rural Market Performance in
Central India,” Applied Economics, Vol 2, No 3, pp 22–45.
Gandhi, Vasant, Gauri Kumar and Robin Marsh (2001): “Agroindustry for Rural and Small Farmer
Development: Issues and Lessons from India,” International Food and Agribusiness Management
Review, Vol 2, Nos 3/4, pp 331–44.
Government of Karnataka (2013): “District and Taluk-wise Statistics of Major Horticultural Crops in
Karnataka State 2011-12,” Directorate of Economics & Statistics, Bangalore,
http://www.horticulture.kar.nic.in/Design_final/A&P%20%20Final%202015-16.pdfGoyal, Goyal,
24Aparajita (2010): “Information, Direct Access to farmers and Rural Market Performance in Central
India,” Applied Economics, Vol 2, No 3, pp 22–45.
Goyal, M Tanu, Arpita Mukherjee and Avantika Kapoor (2017): “India’s Export of Food Products: Food
Safety and Related Issues,” ICRIER Working Paper No 345, Indian Council for Research on International
Economic Relations, New Delhi.
Hegde, R N (2006): “Prospects for Export of Indian Fresh Alphonso Mangoes,” CAB Calling, January–
March.
Jha, Dilip Kumar (2016): “UAE issues warning to India’s mango, vegetable exporters,” Business
Standard, 24 May, https://www.business-standard.com/article/markets/uae-issues-warning-to-india-s-
mango-vegetable-exporters-116052300160_1.html, accessed in June 2016.
Kelejian, H (1971): “Two Stage Least Squares and Econometric Models Linear in the Parameters but
Nonlinear in the Endogenous Variables,” Journal of the American Statistical Association, Vol 66, No
334, pp 373–74.
Kumar, Pramod (2012): “Impact Study of the National Horticulture Mission Scheme in Karnataka,”
Research Report ADRTC/141, Agricultural Development and Rural Transformation Center, Institute for
Social and Economic Change, Bangalore, http://www.isec.ac.in/NHMS-Karnataka.pdf, accessed in
December 2017.
Mahendra Dev S and N Chandrasekhara Rao (2005): “Food Processing and Contract Farming in Andhra
Pradesh: A Small Farmer Perspective,” Economic & Political Weekly, Vol 40, No 26, pp 2705–13.
Mattoo, Aaditya, Deepak Mishra and Ashish Narain (2007): “From Competing at Home to Competing
Abroad: A Case Study of India’s Horticulture,” Oxford University Press and World Bank,
http://web.worldbank.org/archive/website01291/WEB/0__C-251.HTM, accessed on 30 October 2018.
25Mittal, Surabhi (2007): “Can Horticulture be a Success Story for India?,” ICRIER Working Paper No
197, Indian Council for Research on International Economic Relations.
Nagaraj N, Umesh Pradhani, P G Chengappa, G Basavaraj and Ramesh Kanwar (2011): “Cost
Effectiveness of Rainwater Harvesting for Groundwater Recharge in Micro-Watersheds of Kolar District
of India: The Case Study of Thotli Micro-Watershed,” Agricultural Economics Research Review, Vol 24,
pp 217–23.
Poore, M E D and C Fries (1985): “Ecological effects of eucalyptus,” FAO Forestry Paper No 59, Food
and Agricultural Organization, United Nations.
Prakash, Ajay and Animesh Bahadur (2005): “From revolutionary peasants to leaders of export
revolution: A saga of 1990s,” Vision: The Journal of Business Perspective, Vol 9, No 2.
Pudasini, P Som (1983): “The Effects of Education in Agriculture: Evidence from Nepal,” American
Journal of Agricultural Economics, Vol 65, No 3, pp 509–15.
Roy, Devesh and Amit Thorat (2008): “Success in High Value Horticultural Export Markets for the Small
Farmers: The Case of Mahagrapes in India,” World Development, Vol 36, No 10, pp 1874–90.
Saripalle, Madhuri (2016): “Jasmine Cultivation in Tamil Nadu: Market Structure and Pricing,” World
Development Perspectives, Vol 1, pp 12–14.
Shiva, Vandana, H C Sharatchandra, and J Bandyopdyay (1981): “Social, economic and ecological
impact of social forestry in Kolar,” Indian Institute of Management, Bangalore.
Singh, B K, E S Rakesh, V P S Yadav and D K Singh (2010): “Adoption of Commercial Cut Flower
Production Technology in Meerut,” Indian Research Journal of Extension Education, Vol 10, No 1.
Spreer, Wolfram, Somchai Ongprasert, Martin Hegele, Jens N. Wünsche, and Joachim Müller (2009):
“Yield and fruit development in mango (Mangifera indica L. cv. Chok Anan) under different irrigation
regimes,” Agriculture Water Management, Vol 96, No 4, pp 574–84.
26Zamil, Md Farhad and Jean-Joseph Cadilhon (2009): “Developing Small Production and Marketing
Enterprises: Mushroom Contract Farming in Bangladesh,” Development in Practice, Vol 19, No 7, pp
923–32.
NOTES
1
The potential for horticulture exports is indicated by the fact that India is the second largest
producer of fruits and vegetables globally. According the National Horticulture Board, as per the
horticulture statistics in 2017 India produces 11% of the world’s vegetables and 13% of fruits
(excluding melons). However, India’s share of world exports in fruits and vegetables is
insignificant. It accounts for only 1.7% of global trade in vegetables and 0.5% in fruits, the main
reasons being high logistics cost, trade barriers, and lastly gaps in quality, health and safety
stanadards (Aaditya Mattoo et al 2007).
2
According to the erstwhile Planning Commission, Kolar falls under agro-climactic zone 10
which covers the Southern Plateau and Hills region. As per the finer classification of the
National Agricultural Research Project (NARP), Kolar falls under Eastern Dry Zone KA-5. See
http://www.crida.in/CP-012/statewiseplans/Karnataka%20(Pdf)/GKVK,%20Bangalore/KAR15-
KOLAR%2031.03.2011.pdf
3
Promotion of Eucalyptus plantation in Kolar district was a subject of great debate in the 1980s
and was criticised as a main reason for the decline in water tables in the district (Shiva et al
1981; Poore and Fries 1985).
274
The statistics on area and production of mango at the state level differ considerably from those
available with the National Horticulture Board because of differences in the methodology
employed. The estimates with the Directorate of Economics and Statistics are relatively
conservative and based on sampling survey.
5
The Horticultural Producers’ Co-operative Marketing and Processing Society or HOPCOMS
was established with the principal objective of establishing a proper system for the marketing of
fruits and vegetables.
6
The market is supported by 250 Horticultural Farmers’ Associations organised throughout India
with more than 20,000 members. The farmers’ associations are linked to 40 collection centres
that are equipped to meet the specific or special requirements of buyers, in terms of quality,
packing and weight.
7
Global G.A.P is a scheme for Good Agricultural Practices at the farm level, developed by
EUREP, an association of European fresh produce retailers and importers. It was originally
started by retailers belonging to the Euro-Retailer Produce Working Group and renamed as
GlobalG.A.P in 2007.
8
The data was transformed as x=sign(x) *log(abs(x)+1), see
http://fmwww.bc.edu/repec/bocode/t/transint.html Cox (2005)
28You can also read