2019 RESULTS AND BALANCE SHEET STRENGTHENING - February 19, 2020 - Vallourec
←
→
Page content transcription
If your browser does not render page correctly, please read the page content below

2019 RESULTS AND BALANCE
SHEET STRENGTHENING
February 19, 2020

                    Confidential   1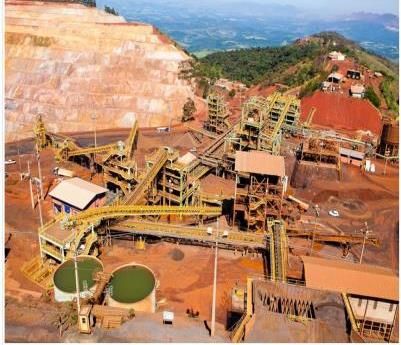
LEGAL DISCLAIMER
Forward-Looking Statements
This presentation may include forward-looking statements. These forward-looking statements can be identified by the use of forward-looking terminology, including the terms as “believe”, “expect”, “anticipate”, “may”,
“assume”, “plan”, “intend”, “will”, “should”, “estimate”, “risk” and or, in each case, their negative, or other variations or comparable terminology. These forward-looking statements include all matters that are not historical facts
and include statements regarding the Company’s intentions, beliefs or current expectations concerning, among other things, Vallourec’s results of operations, financial condition, liquidity, prospects, growth, strategies and the
industries in which they operate. By their nature, forward-looking statements involve risks and uncertainties because they relate to events and depend on circumstances that may or may not occur in the future. These risks
include those developed or identified in the public documents filed by Vallourec with the French Financial Markets Authority (Autorité des marches financiers, or “AMF”), including those listed in the “Risk Factors” section of the
Registration Document filed with the AMF on March 29, 2019 under number D.19-0231. Readers are cautioned that forward-looking statements are not guarantees of future performance and that Vallourec’s or any of its
affiliates’ actual results of operations, financial condition and liquidity, and the development of the industries in which they operate may differ materially from those made in or suggested by the forward-looking statements
contained in this presentation. In addition, even if Vallourec’s or any of its affiliates’ results of operations, financial condition and liquidity, and the development of the industries in which they operate are consistent with the
forward-looking statements contained in this presentation, those results or developments may not be indicative of results or developments in subsequent periods.

Cautionary Statement
This presentation does not, and shall not, in any circumstances constitute a public offering or an invitation to the public in connection with any offer.

No communication and no information in respect of this transaction may be distributed to the public in any jurisdiction where a registration or approval is required. No steps have been or will be taken in any jurisdiction (other
than France) where such steps would be required. The issue, the subscription for or the purchase of Vallourec’s shares may be subject to specific legal or regulatory restrictions in certain jurisdictions. Vallourec assumes no
responsibility for any violation of any such restrictions by any person.

This announcement is not a prospectus within the meaning of Regulation (EU) 2017/1129 of the European Parliament and the Council of June 14, 2017 (as amended or superseded, the “Prospectus Regulation”).
No securities offering will be opened to the public in France before the delivery of the visa on a prospectus prepared in compliance with the Prospectus Regulation, as approved by the AMF.

In France, an offer of securities to the public may only be made pursuant to a prospectus approved by the AMF. With respect to the member States of the European Economic Area (each, a “relevant member State”), other
than France, no action has been undertaken or will be undertaken to make an offer to the public of the shares requiring a publication of a prospectus in any relevant member State. Consequently, the securities cannot be
offered and will not be offered in any member State (other than France), except in accordance with the exemptions set out in Article 1(4) of the Prospectus Regulation, or in the other case which does not require the
publication by Vallourec of a prospectus pursuant to the Prospectus Regulation and/or applicable regulation in the member States.

This presentation does not constitute an offer of the securities to the public in the United Kingdom. The distribution of this presentation is not made, and has not been approved, by an authorized person (“authorized person”)
within the meaning of Article 21(1) of the Financial Services and Markets Act 2000. As a consequence, this presentation is directed only at (x) persons who (i) are outside the United Kingdom, (ii) have professional experience
in matters relating to investments falling within Article 19(5) of the Financial Services and Markets Act 2000 (Financial Promotion) Order 2005, as amended (the “Order”), or (iii) are high net worth entities falling within Article
49(2) of the Order and (y) any other persons to whom it may otherwise lawfully be communicated (all such persons together being referred to as “Relevant Persons”).
The securities are directed only at Relevant Persons and no invitation, offer or agreements to subscribe, purchase or acquire the securities may be proposed or made other than with Relevant Persons. Any person other than
a Relevant Person may not act or rely on this document or any provision thereof. This presentation is not a prospectus which has been approved by the Financial Conduct Authority or any other United Kingdom regulatory
authority for the purposes of Section 85 of the Financial Services and Markets Act 2000.

This presentation does not constitute or form a part of any offer or solicitation to purchase or subscribe for securities in the United States. Vallourec shares may not be sold in the United States absent registration or an
exemption from registration under the U.S. Securities Act of 1933, as amended. Vallourec does not intend to register in the United States any portion of the offering mentioned in this presentation or to conduct a public offering
of the shares in the United States.

The distribution of this presentation in certain countries may constitute a breach of applicable law. The information contained in this presentation does not constitute an offer of securities for sale in the United States, Canada,
Australia or Japan.

                                                                                                                                                                                                                                      2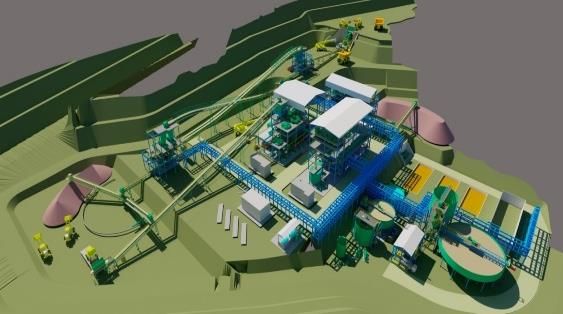
EXECUTIVE SUMMARY
LAUNCHING RIGHTS ISSUE AND RCF REFINANCING TO SUPPORT
VALLOUREC’S TURN-AROUND AND STRATEGY EXECUTION

                                        ►   2019 Results:
                                            • 2019 EBITDA more than doubled, reaching €347m Full Year
                                            • Net debt close to stable at €2,031m
Strong 2019 Results and 2020 Targets
                                        ►   2020 Targets:
Confirming our Operational Recovery
                                            • €500m EBITDA
                                            • Slightly positive Free Cash Flow
                                            • Phasing reflecting usual low seasonality in Q1 and with H2 significantly stronger than H1

                                        ►   Renewed competitiveness already translating into tangible commercial wins
                                        ►   Unique positions to benefit from step change in Brazil off-shore activity and steady recovery in
                                            international markets
 Well Identified Levers for Sustained   ►   New products, services and digital solutions to capture incremental revenues
            Value Creation              ►   Additional savings through “Acceleration” program and further deployment of Brazilian and Asian
                                            routes
                                        ►   Identified opportunities to leverage our expertise and assets in new quickly-emerging Energy
                                            Transition markets

                                        ►   €800m fully underwritten rights issue
                                            • Proforma leverage of c.2.8x at year-end 2020 and strengthened credit profile
  Balance Sheet Strengthening and           • Reduced financial charges by c.€50m p.a. compared to 2019 from combined rights issue, RCF
        Liquidity Extension                    refinancing and exercise of call option on lease contract in Brazil
                                        ►   €800m new revolving credit facility secured
                                            • 4-year maturity with 1-year extension option

                                                                                                                                          3
                                                                                                                                     19 February, 2020   3
1   KEY HIGHLIGHTS OF THE YEAR

                                 4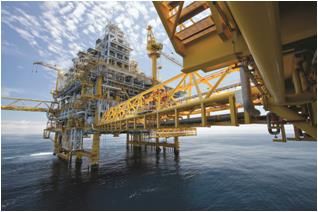
KEY HIGHLIGHTS (1/2)
1 TURN-AROUND MATERIALIZING: STRONG IMPROVEMENT IN PROFITABILITY AND CASH GENERATION
FY 2019: Strong Improvement in EBITDA and FCF Q4 2019: EBITDA Up and Positive FCF
Year-on-year increase in revenue at €4,173m, up EBITDA at €94m, +6% compared to Q4 2018
+6% driven by Oil & Gas notably in EA-MEA regions
Temporary lower activity in US onshore
More than offset by Oil & Gas in EA-MEA, start of
EBITDA more than doubled at €347m, above guidance,
deep off-shore ramp-up in Brazil, mine contribution
reflecting mainly better price/mix in Oil & Gas EA-MEA,
mine contribution and savings Strong savings
EBITDA margin at 8.3%, up from 3.8% in 2018
Positive free cash flow at €76m
Free cash flow at (€41)m, considerably improved from Working capital reduced by €170m
(€494)m in 2018
Net WCR days reduced to 106 days on an annual
quarterly average basis (vs 113 days in 2018)
19 February, 2020 5
KEY HIGHLIGHTS (2/2)
2 3
Restored Competitiveness Driving
ESG at the Core of Vallourec Strategy
Commercial Momentum
Vallourec recently included in the
Signing of the mega contract ADNOC for $900m “A List” for carbon management i.e.
belonging to the 2% best
performers worldwide
Signing of a contract with Technip FMC to supply
Vallourec upgraded to “AA” from
seamless steel rigid risers for the pre-salt field
“A” reflecting Group’ successful
Mero 1 in Brazil achievements
Vallourec ranked among the top 15
Launch of Vallourec.smart brand and associated best performing companies in
digital offers terms of ESG in the Oil & Gas
Equipment segment (116 peers)
Creation of a dedicated CSR committee within the Supervisory Board
Top ESG achievements
74.5% of employees satisfied to work at Vallourec
Strong commitment to the ethics and anti-corruption codes
Almost neutral carbon footprint (only 140 ktons of direct emissions of
CO2)
19 February, 2020 6
2   STRONG 2019 FULL YEAR RESULTS
    DEMONSTRATING TURN-AROUND

                                    7
FY 2019 REVENUE BY MARKET
UP 6.4% VERSUS 2018 (+5% AT CONSTANT EXCHANGE RATES), WITH OIL & GAS EA-MEA LEADING THE GROWTH
Oil & Gas Industry and Other
+11% YoY (+8%1) +15% YoY (+16%1)
FY 2019 revenue
► EA-MEA: in millions of € ► Europe:
• Significant increase fueled by volumes and and as a % of revenue • Industry revenue down, in a challenging market
price/mix environment
► North America:
• Slightly higher revenue with H1 performance ► South America:
offsetting H2 market slowdown exacerbated by • Higher revenue from iron ore reflecting sales
temporary destocking at distributors volume increase and higher iron ore price
2,752
• Lower revenues in lndustry
► South America: 66%
• Lower full year revenue driven by the first 9
months, with in Q4 a strong increase in
deliveries for offshore in Brazil, to be amplified
over 2020
4,173
939
22% Power Generation
Petrochemicals -34% YoY (-34%1)
-16% YoY (-17%1)
192 • Sharp decline in revenue for coal-fired
290
5% conventional power plants, as anticipated
► Decrease in volumes sold in North America 7%
Note:
1. At constant exchange rates
19 February, 2020 8FY 2019 EBITDA
2018 – 2019 REVENUE BRIDGE ► Revenue up €252m or +6%
€m • Positive price/mix effect of +8% mainly driven by EA-MEA Oil &
302 72 4,173 Gas
3,921 (122)
• Negative volume effect of -3%
• Positive currency effect of +2%
2018 Volume Price / Mix Forex 2019
Change
In millions of euros 2019 2018
YoY
► Industrial margin up €159m, or +2.9p.p.
REVENUE 4,173 3,921 6% • Reflecting mainly higher price/mix in Oil & Gas EA-MEA, higher
mine contribution and cost savings, largely offsetting lower
Cost of sales (3,435) (3,342) 3%
contribution from North America
Industrial margin 738 579 27%
(as % of revenue) 17.7% 14.8% + 2.9p.p.
• IFRS 16 impact: +€33m
SG&A costs (378) (405) -7%
(as % of revenue) 9.1% 10.3% -1.2p.p. ► SG&A reduced by 7% and down in percentage of revenue
Other income (expense), net (13) (24) na from 10.3% to 9.1% reflecting continued cost discipline
EBITDA 347 150 +€197m
EBITDA margin (as % of revenue) 8.3% 3.8% +4.5p.p. ► EBITDA increase by €197m, at €347m, margin up 4.5p.p.
19 February, 2020 9FY 2019 EBITDA TO NET INCOME
Change
In millions of euros 2019 2018
YoY
► Operating result improved by €260m, at (€17)m
EBITDA 347 150 +€197m • Mainly driven by higher EBITDA
EBITDA margin (as % of revenue) 8.3% 3.8% +4.5p.p. • Lower impairment charges at (€30)m, mainly related to the
Depreciation of industrial assets (249) (266) -6%
impairment of an asset dedicated to nuclear activity in China
Amortization and other depreciation (58) (34) na • “Assets disposal, restructuring and other” at (€27)m, mainly
reflecting the decision to close the Reisholz Powergen plant in
Impairment of assets (30) (53) na
Germany
Asset disposals, restructuring and
other
(27) (74) na • “Amortization and other depreciation” at (€58)m, of which (€27)m
IFRS 16 impact
OPERATING INCOME (LOSS) (17) (277) +€260m
Net financial income (loss) (244) (220) 11%
► Financial charges up 11%
PRE-TAX INCOME (LOSS) (261) (497) +€236m
• Higher interest expenses, as well as IFRS 16 impact on lease
Income tax (75) (5) na
debt for (€11)m, partly offset by a decrease in foreign exchange
Share in net income (loss) of
(4) 2 na hedging costs
associates
CONSOLIDATED NET INCOME
(340) (500) +€160m ► Pre-tax loss reduced by €236m
(LOSS)
Non-controlling interests 2 2 na
NET INCOME (LOSS), GROUP ► Income tax increase to (€75)m, mainly in Brazil
(338) (502) +€164m
SHARE
EARNINGS PER SHARE (in €) (0.7) (1.1) €0.4 ► Significant reduction of net loss by €164m, to (€338)m
19 February, 2020 10Q4 2019 EBITDA
Q4 2018 – Q4 2019 REVENUE BRIDGE ► Revenue decrease by 10% YoY
€m • Negative volume effect of -25%: mainly lower deliveries in
1,116 280 North America including temporary effects of destocking at
165 3 1,004
distributors and lower deliveries of low end pipes
• Strong positive price/mix effect of +15% driven by better
mix in Oil & Gas in EA-MEA and better mix and prices in
Q4 '18 Volume Price / Mix Forex Q4' 19 South America
Change
In millions of euros Q4 2019 Q4 2018 ► EBITDA at €94m, up 6% YoY
YoY
REVENUE 1,004 1,116 -10% • Industrial margin at €180m, reflecting lower contribution
Cost of sales (824) (910) -9% from North America, partly offset by higher contribution
from Oil & Gas in Brazil and iron ore
Industrial margin 180 206 -13%
(as % of revenue) 17.9% 18.5% -0.6p.p. • SG&A costs reduced by 18% and decreased in percentage
of revenue from 9.5% to 8.7%
SG&A costs (87) (106) -18%
• IFRS 16 impact: +€8m
(as % of revenue) 8.7% 9.5% -0.8p.p.
Other income (expense), net 1 (11) na
EBITDA 94 89 6%
EBITDA margin (as % of revenue) 9.4% 8.0% +1.4p.p.
19 February, 2020 11Q4 2019 EBITDA TO NET INCOME
Q4 Q4 Change
In millions of euros
2019 2018 YoY
EBITDA 94 89 6%
EBITDA as % of revenue 9.4% 8.0% +1.4p.p.
► Operating result improved by €34m YoY
Depreciation of industrial assets (66) (69) -4% • Higher EBITDA
Amortization and other depreciation (14) (8) na
• Asset disposals, restructuring and other at (€23)m, mainly
Impairment of assets - (38) na
reflecting decision to close the Reisholz Powergen plant in
Asset disposals, restructuring and other (23) (17) na Germany
OPERATING INCOME (LOSS) (9) (43) +€34m • Amortization and other depreciation include IFRS 16 impact for
Net financial income (loss) (66) (55) 20% (€7)m
PRE-TAX INCOME (LOSS) (75) (98) +€23m ► Slightly higher financial charges
Income tax (36) (3) na • Higher interest expenses and (€3)m negative IFRS 16 impact
Share in net income (loss) of associates (2) - na
► Pre-tax result improved by €23m, more than offset by
CONSOLIDATED NET INCOME increased income tax in Brazil
(113) (101) -€12m
(LOSS)
Non-controlling interests 2 (2) Na ► Net result, Group share, at (€111)m
NET INCOME (LOSS), GROUP SHARE (111) (103) -€8m
EARNINGS PER SHARE (in €) (0.2) (0.2) Na
19 February, 2020 12CONTINUED PROGRESS IN WORKING CAPITAL
MANAGEMENT
QUARTERLY NET WORKING CAPITAL REQUIREMENT DAYS1
Number of days
162 160 154 149
148 135 141
133
Annual 133 124
115 114 121 114 113 117
Quarterly 114 111 112 108 105 106
Average
94 95
84
Period Q1.15
Q1.15 Q2.15
Q2.15 Q3.15
Q3.15 Q4.15
Q4.15 Q1.16
Q1.16 Q2.16
Q2.16 Q3.16
Q3.16 Q4.16
Q4.16 Q1.17
Q1.17 Q2.17
Q2.17 Q3.17
Q3.17 Q4.17
Q4.17 Q1.18
Q1.18 Q2.18
Q2.18 Q3.18
Q3.18 Q4.18
Q4.18 Q1.19
Q1.19 Q2.19
Q2.19 Q3.19
Q3.19 Q4.19
Q4.19
Annualized
quarterly 4,208 4,072 3,488 3,444 2,684 3,052 2,772 3,351 3,132 3,732 3,856 4,280 3,449 3,928 3,844 4,464 4,100 4,336 4,240 4,016
sales (€m)
Net WCR1
1,873 1,783 1,473 1,088 1,098 1,114 1,028 1,051 1,206 1,165 1,169 990 1,147 1,222 1,310 1,152 1,316 1,279 1,220 1,046
(€m)
► Net working capital requirement at 95 days at end 2019, similar to the level reached at end 2018
► On an annual quarterly average basis, net WCR days reduced to 106, down from 113 in 2018
Note:
1. Net WCR defined as trade receivables plus inventories minus trade payables, net of provisions for inventories and trade receivables; net WCR days are computed on an annualized quarterly sales basis
19 February, 2020 13FY 2019 AND Q4 FREE CASH FLOW
► Considerable improvement in full year Free Cash Flow at (€41)m versus (€494)m in 2018
► Supported by largely improved cash flow from operating activities and positive change in working capital requirement
Q4 Q4 YoY Change Change
€m
2019 2018 Q4/Q4 (€m)
FY 2019 FY 2018
(€m) 1► Large improvement in
Cash flow from operating
Cash flow from operating activities activities +€204m, nearly
1 (14) (13) -1 (6) (210) +204
(A) breakeven
Change in operating WCR (B)
2
[+ decrease, (increase)]1
170 154 +16 124 (155) +279 2► Operating WCR reduced
by €124m
3 Gross capex (C) (80) (65) -15 (159) (129) -30
3► Capex spend reflecting
discipline and rigorous
4 Free cash flow2 (A)+(B)+(C) 76 76 - (41) (494) +453
design approach
4 Q4 similar to Q4 2018
Notes:
1. Operating WCR includes WCR as well as other operating liabilities and receivables
2. Free cash flow (FCF) is a non-GAAP measure and is defined as cash flow from operating activities minus gross capital expenditure and plus/minus change in operating working capital requirement
19 February, 2020 14FY 2019 NET DEBT
2018 – 2019 NET DEBT BRIDGE
€m
Net Debt Net Debt ► Net financial debt as at
as at as at Net Debt
December 31st 2019 : €2,031m
Dec 31st 2018 Jan 1st 2019 as at
Free cash- Dec 31st 2019 • Gross debt : €3,824m
flow = • Cash on hand: €1,794m
(€41)m
► Bank facilities as at December
31st 2019:
Change • Drawn: €1,702m
Asset
Cash Flow in op.
disposals • Undrawn and fully available
WCR 2 Capex
from Op. & other
Activities bank facilities: €426m
IFRS 16 items 3
impact 1
(1,999) (6) 124
(159) 9 (2,031)
(2,058) 59
2019A Leverage: 5.9x
Notes:
1. Reclassified to lease debt under IFRS 16
2. Change in operating working capital requirement, + decrease/(increase)
3. Mainly i) On February 19th 2019, Sumitomo Corporation contributed in cash to a capital increase of Vallourec Star, a Vallourec's subsidiary in the United States, pro rata its holding percentage
(19.47%), for an amount of $59 million (c. €52 million) ii) Repayment of (€33)m of financial leasing debts under IFRS 16
19 February, 2020 153 VALLOUREC STRATEGY
A LEANER AND MORE COMPETITIVE COMPANY, WITH WELL
IDENTIFIED LEVERS FOR VALUE CREATION
16A A Leaner and More Competitive Company
B Well Identified Levers for Value Creation
19 February, 2020 17A A LEANER AND MORE COMPETITIVE COMPANY, FOLLOWING THE
SUCCESSFUL DELIVERY ON 2016 STRATEGIC INITIATIVES
1 OUTPERFORMED COST SAVINGS TARGET SET IN OUR TRANSFORMATION PLAN
2 EUROPE: STRONG FOOTPRINT ADAPTATION
3 NEW HIGHLY COMPETITIVE ROUTES SUCCESSFULLY DEPLOYED
4 A LEANER, STATE OF THE ART AND FLEXIBLE INDUSTRIAL FOOTPRINT
RESTORED COMPETITIVENESS ALREADY MATERIALIZING IN ACCELERATED COMMERCIAL
5 MOMENTUM
19 February, 2020 18A 1 OUTPERFORMED COST SAVINGS TARGET
► Initial 2016-2020 gross cost savings target of €400m surpassed in 2018 with €445m achieved
► Additional 2019-2020 gross savings plan of €200m will be overachieved: €141m already achieved in 2019
€586M GROSS COST SAVINGS ACHIEVED OVER 2016-2019 MANUFACTURING AND SG&A COSTS/T DOWN 40% OVER 2016-2019
€m €586m Manufacturing (excl. raw materials)1 + SG&A (€/t)
€1,748/t €713/t
151 164
130 141 €1,035/t
7% 8% 6% 7%
2016a 2017a 2018a 2019a 2016a 2019a
% % total cost base (excluding raw materials, direct cost of sales, R&D) ► c.40% cost reduction over three years through savings, capacity
rationalization, and new routes deployment
GROUP HEADCOUNT2 EVOLUTION 2014-2019 : -21%
23,709
1,065 ► Reduction of headcount by c.3,500 in Europe (i.e. -35%) and
18,827
(3,455) (1,574) c.1,600 in Brazil (i.e. -19%)
(733) (185)
► Integration of Tianda in 2017
Headcount Europe South North Middle East Asia Headcount
'14 America America Africa '19
Notes:
1. Cost of sales, excluding raw materials and including forex, inflation and perimeter effects
2. Group headcount including permanent, fixed term and apprentices and excluding agency workers
19 February, 2020 19A 2 EUROPE: STRONG FOOTPRINT ADAPTATION
2016: 19 SITES IN FRANCE AND GERMANY POST-2020: 2 PRODUCTION HUBS REMAINING
Germany Germany
Mülheim Mülheim
Düsseldorf (x2) Düsseldorf (x2)
Saint-Saulve (x2) Saint-Saulve
Maubeuge Reisholz
Mülheim
Aulnoye (x3) Aulnoye (x2)
Déville
Montbard (x2)
Cosne sur Loire Montbard (x2)
Villechaud Venarey-Les-Laumes (x2)
La Charité sur Loire
(#) Number of Sites
(#) Number of Sites
Mills
France France
Finishing
Tarbes
Valinox Nucléaire / Vallourec Bearing Tubes
(specialty sites)
► Rationalization over 2016-2018: 10 plants restructured or divested ► Optimized footprint
► Rationalization over 2019-2020: Reisholz mill closure announced Feb.2020 • Hubs located in Düsseldorf (Germany) and Aulnoye (France)
• Integrated flows with satellite sites
Turn-around achieved, setting up Europe as center of excellence for advanced premium products, competitive on local market,
flexible (short lead-time) route for exports
19 February, 2020 20A 3 NEW COMPETITIVE ROUTES SUCCESSFULLY DEPLOYED
BRAZIL ASIA : China + Indonesia
Rationalization and Cost Savings Premiumization of Highly Competitive Manufacturing Base
► Successful integration within Vallourec’s global network
• Tianda’s highly competitive facilities acquired in 2016, now fully
► Fixed costs rationalization / Improved performance in variable integrated to address local and export markets
costs / Sourcing efficiencies • Ideal complement to existing finishing facilities: VAM®
Changzhou (China) and Citra Tubindo (Indonesia)
► Sharing of best practices at Jeceaba site with Nippon Steel
► Premiumization to offer full scope product portfolio at highly
► Jeceaba site: rolling manufacturing costs1 reduced by 27% competitive cost
since 2016
• Certification for premium products fully in line with plan
► Barreiro site: shut down of the 2 blast furnaces and steel mill • Share of premium volume rolled in Tianda increased from 4%
to concentrate all steel production in Jeceaba state-of-the-art in 2017 to 20% in 2019
facility
► Significant contribution to commercial successes
► VSB exports representing more than 60% of total production • N°1 supplier of a major Chinese National Oil Company
• Tianda products included in successful packages of recent
awards in Middle-East and North Africa
New routes utilization rate for Premium O&G EA-MEA demand2 increased from 19% in 2015 to 55% in 2019, resulting in
increase in premium products exported from VSB and Tianda from 40kt in 2015 to 300kt in 2019
Notes:
1. Jeceaba Manufacturing Costs Tracker: tracker for VAM TOP 9 5/8 11.99mm L80, actual average costs of goods sold, including depreciation and excluding SG&A (based on USD)
19 February, 2020 21A 4 A LEANER, STATE OF THE ART AND FLEXIBLE INDUSTRIAL
FOOTPRINT
► Since 2017, reduction of the breakeven point1 by c. 25%
► Share of Europe in total capacity reduced from c.45% to c.25%
► Brazil and Asia highly competitive both for local and export markets, while North America essentially self-sufficient
► Decisive progress in commercial agility thanks to flexible footprint
NEW ROUTES DRIVING RESTORED COMPETITIVENESS PRODUCTION CAPACITY (%kt)
Breakdown of rolling capacity: c.3mt/y
Center
of technological Brazil
2014a
excellence
c.30%
NA c.45%
Europe
North c.25% Europe
Asia Highly
America
Oil and gas local competitive
market supply production
Brazil
hub
China
Highly Steel mills Finishing unit Europe
competitive Tube mills Sales & Services office c.20% c.25%
production 2019a
R&D Plantation and mine
hub
c.30% c.25% North
Brazil America
Note:
1. Defined as sales volume (t) required to cover variable and fixed costs included in EBITDA and capex requirements
19 February, 2020 22A 5 RESTORED COMPETITIVENESS ALREADY MATERIALIZING IN
ACCELERATING COMMERCIAL MOMENTUM
$900M ADNOC MEGA-CONTRACT ILLUSTRATES GROUP CAPABILITY
TO PROVIDE GLOBAL OFFERING COMMERCIAL SUCCESSES IN BRAZIL
► One of the largest awards ever received by Vallourec thanks to: • April 2018, Vallourec signed a
3-year agreement to supply
• Restructured industrial set-up and enhanced competitiveness thanks to new routes Petrobras with OCTG products and
extended supply of services
• Best-in-class integrated solutions, supported by new and innovative digital
solutions
• Contribution to customer’s In-Country Value Program commitment
• Compliance with customer’s requirements on Quality, Health & Safety and • January 2019, multi-year agreement
with Shell in Brazil including
Environment integrated services
► Vallourec will deliver a wide range of products from API to high-end premium
products from Europe, Brazil and China
► Vallourec will provide a comprehensive offer with full range of products and
services: • April 2019, Vallourec won a major
contract to supply seamless steel
rigid line pipe for the pre-salt field
• For both onshore and offshore drilling operations Mero 1 in Brazil
• For applications ranging from conventional to complex wells
After doubling between 2017 and 2018, OCTG tender hit ratio1 in EA-MEA continued to improve in 2019 thanks to the
utilization of new routes
Note:
1. Calculated on open tenders awarded to date
19 February, 2020 23B 2020 AND BEYOND: TAKING VALLOUREC TO THE NEXT LEVEL
VALLOUREC STRATEGIC ROADMAP
1
► AccelerateACCELERATE PROFITABLE
profitable revenue REVENUE on:
growth by capitalizing GROWTH BY CAPITALIZING ON
•a Supportive market fundamentals and strong positions in the most attractive markets
•b Technological edge and brand recognition to develop new products and solutions
•c Core capabilities to capture emerging opportunities for energy transition
2
► Further enhance
FURTHER ENHANCE COMPETITIVENESS
competitiveness through: THROUGH
•a Industrial excellence initiatives
€200m additional gross cost savings targeted in 2021-2022
•b Increased efficiency of support functions
•c Demand for O&G products in EA-MEA essentially allocated to new routes
Well identified levers for value creation
19 February, 2020 24B 1a SUPPORTIVE MARKET FUNDAMENTALS…
FIELD DEPLETION IS THE KEY DRIVER… … BEHIND THE RECOVERY IN E&P CAPEX
$bn – Yearly Growth Rate 2019-23: +3%
% Oil Demand Growth (2018-2030)
CAGR 2019-23
1.3% 699 EA-MEA: +3%
1.0% Latin America: +7%
North America: +3%
544
522
496
481 475
Current Policies Scenario Stated Policies Scenario 455
Source: International Energy Agency – Dec 2019
Depletion rates
All oil fields US shale
(4.5%)
Observed decline rate1 (39%)
(8%) US shale decline rate
Natural decline rate2 2014a 2018a 2019e 2020e 2021e 2022e 2023e
EA MEA Latin America North America Total
Source: International Energy Agency – Dec 2019 Source: BTU Analytics Source: IHS – Global Upstream Spending - December 2019 (latest)
Notes:
1. Production evolution if only investment to enhance already producing fields output is made, no new field is brought on stream
2. Production evolution if no investment, either to bring new field onstream or to enhance already producing field output is made
19 February, 2020 25B 1a … AND STRONG POSITIONS IN THE MOST ATTRACTIVE MARKETS
BRAZIL: A UNIQUE POSITION AND EXPERTISE IN THE FASTEST GROWING OFFSHORE MARKET IN THE COMING YEARS
MASSIVE INVESTMENTS IN E&P RIGHTS IN 2017-2019 BIDDING ROUNDS
VALLOUREC’S STRENGTHS WITH LARGE PARTICIPATION FROM MAJORS
Acquired Offshore Acreage (km2) since 2017
► Vallourec is the only local producer of seamless tubes in Brazil Total: 55,000 km2
► Unique offer of local services
19 800
► Frame agreement with Petrobras, underpinned by longstanding relationship
and supply chain integration
12 650
► Recognized as a supplier of choice by IOCs in Brazil
8 250
• All 2019 rigid pipes tenders won 5 500
3 850
► Exclusively high end Premium due to very demanding nature of presalt deep 2 200 2 200
550
off-shore
► Close collaborative relationships with customers
• Providing full visibility on customers’ 2020 drilling plans Others
Source: ANP Brazilian National Agency of Petroleum, Company Information
SIGNIFICANT INCREASE IN PETROBRAS E&P CAPEX DOUBLING OF BRAZIL OFFSHORE WELL COUNT
Average of Petrobras’ Exploration Capex Per Year ($bn) Petrobras E&P Capex 2020-23, ($bn) Offshore Drilled Well Count in Brazil (Number of drilled wells)
2.3
89
18 75
10 13 43
0.7 9
2016a – 2019a 2020e – 2024e 2020e 2021e 2022e 2023e 2019a 2020e 2021e
Source: Petrobras, Investor Day Dec.2019 Source: Petrobras, Investor Day Dec.2019 Source : Vallourec Research
19 February, 2020 26B 1a … AND STRONG POSITIONS IN THE MOST ATTRACTIVE MARKETS
BRAZIL: EXPLOIT OUR MINE’S FULL POTENTIAL
IRON ORE MINE ACTIVITY MAIN COMPONENTS OF THE PROJECT
► CAPEX of c.€65m
► The mine sells the main part of its
production to the local market and Construction of a new ore treatment line
supplies Vallourec’s blast furnace and plant to treat extracted poor Itabirite (30%
pellet plant located in Jeceaba, Minas - 45% Fe)
Gerais
► Production startup end-2021
► Vallourec’s mine recognized as a
benchmark in terms of environment
► Additional capacity of 3 Mt/y as from 2022
thanks to the filter press investment
made in 2013-14
► Payback c. 2.5 years
► Production of 6.2 mt in 2019 (+32%
versus 2018)
► Increase mine lifetime from 2029 to 2062
► Best-in-class cash cost position
19 February, 2020 27B 1a … AND STRONG POSITIONS IN THE MOST ATTRACTIVE MARKETS
EA-MEA: LEVERAGING STRONG COMMERCIAL PRESENCE AND COMPETITIVENESS IN A RECOVERING MARKET
VALLOUREC’S STRENGTHS EA-MEA FIDs EVOLUTION
# of FIDs (reserves > 50mb)
► A reshaped and agile manufacturing set-up
42 43
• Restored competitiveness 34
23 25
• Flexible and complementary routes with Europe, Brazil and China 24 28
10 13 24
7 16
► Proximity with customers thanks to local presence and ability to 9 18 12 15
6 1 1 7 10
provide local content solutions, such as in Saudi Arabia
2015a 2016a 2017a 2018a 2019e 2020e 2021e
► A complete product and service offer, with leading positions on Onshore Offshore Total
Source: Wood Mackenzie – December 2019
Premium markets currently recovering
EA-MEA as % of Total Vallourec O&G Revenue (average 2014-19) ► Most projects profitable at $50/bbl
► Following resumption of FIDs driven largely by onshore and brownfield
offshore projects, offshore to drive the majority of future incremental
More than 50% mainly on
spending growth and greenfield projects restarting
Premium Segments
► Leading to steady E&P capex growth over the coming years associated
with more favourable OCTG products mix
19 February, 2020 28B 1a … AND STRONG POSITIONS IN THE MOST ATTRACTIVE MARKETS
NORTH AMERICA: VALLOUREC LEADING SUPPLIER FOR THE PREMIUM OIL & GAS MARKET
VALLOUREC’S STRENGTHS US OCTG MARKET – STABILIZING ACTIVITY
► Fully integrated domestic player Mt – US Shipments
8.0
► Leading supplier of seamless pipes for the Oil and Gas market 6.0 6.1
5.6 5.1
3.9
2.3
► Highly flexible operations allowing to adapt to volatile market
► Opportunities for market share gains in an OCTG industry under 2014a 2015a 2016a 2017a 2018a 2019a 2020e
consolidation
Source: Preston Report – December 2019 – Shipments do not include change in inventories
► Sharp activity rebound and inventory replenishment in 2017 and steady
North America as % of Total Vallourec O&G Revenue (average 2014-19) market growth in 2018
► Slow-down in 2019 due to operator cash discipline and strong inventory
c. 36% with strong market destocking in H2
shares in Premium and ► After decline along 2019, limited rig count gain expected compared to 2019
Semi-Premium
► Rebound in our volumes in Q1 2020, while prices are bottoming out
► Limited market growth expected post 2020, with operators prioritizing cash
discipline
19 February, 2020 29B 1b TECHNOLOGICAL EDGE AND BRAND RECOGNITION
NUMBER OF NEW PATENTS FILED
► Dedicated R&D centers in Europe, Brazil and the US
Proven Know-how & ► Over 500 researchers and technicians 28 23 20
20 16
Technology
► +50% co-filed VAM® patents with Nippon Steel over
2017-19 vs previous 3-year period
2015a 2016a 2017a 2018a 2019a
► VAM® brand name
► Co-development with Nippon Steel under shared R&D
Leading Position in ► VAM® Field Services subsidiary to
Premium OCTG agreement
support customers on site
Connections with ► #1 worldwide market share for VAM® connections
VAM Product Family ► 200 licensees for maintenance and repair
► “VAM® system” developed by Vallourec
close to customers operations
► Close collaboration with customers to develop
Innovation customized solutions to meet customer’s specific
with Customers
needs
19 February, 2020 30B 1b CAPTURING INCREMENTAL REVENUES WITH NEW PRODUCTS AND
SOLUTIONS
NEW VAM® CONNECTIONS FOR PREMIUM O&G MARKETS HAVE BEEN RAPIDLY ADOPTED BY CLIENTS AROUND THE
GLOBE
VAM® HTTC offers extreme torque capability Advanced premium integral connection for The latest CLEANWELL® technology is a non-
for highly deviated and lateral sections of the deep offshore or High Pressure / High polluting coating applied in the mill to replace
well – essential for extended reach drilling Temperature wells. both storage and running compounds,
Successful introduction of VAM® breakthrough providing improved safety conditions on drilling
technology for 20,000 psi HPHT application platforms, shorter installation time, and
decrease in waste
Part of the ADNOC recent mega tender
(August 2019) Deployed in the US Gulf of Mexico North Sea, West Africa and Egypt
Saudi Arabia in 2018
19 February, 2020 31B 1b CAPTURING INCREMENTAL REVENUES WITH NEW PRODUCTS AND
SOLUTIONS
NEW DIGITAL SOLUTIONS ALREADY ON THE MARKET AND CONTRIBUTING TO COMMERCIAL
DIFFERENTIATION
Smartengo Smartengo Smartengo Smartengo
Best Fit Running Expert Inventory Traceability
Optimize fit-up Monitor running Give full visibility on Ensure traceability,
operations by analyzing operations & tally inventory & enhance accelerate inbound
pipe end dimensional construction. efficiency in all yard process & facilitate
data for line-pipe Give access to run-in- operations pipe management
welding hole construction with easy access to
report pipe data
Award for "Best Operational Performance 2020" recently delivered by Innovation Makers Alliance, with a specific focus on the
Smartengo Best Fit solution and the data science models
19 February, 2020 32B 1c LEVERAGE OUR EXPERTISE TO PREPARE FOR THE FUTURE WITH
ENERGY TRANSITION SOLUTIONS
ENERGY TRANSITION AND CO2 EMISSION
REDUCTION OFFER OPPORTUNITIES FOR Geothermal – Commercial phase, expanding existing business
VALLOUREC
► Capitalize on VAM® to develop a dedicated product and service offer
► Significant growth expected over 2020-2030 for geothermal application
and beyond
► Markets where our core customers invest multi- Wind Offshore – Development phase
bn$
► Capitalize on design capabilities to develop an innovative jacket
installation solution, ensuring faster and environmental-friendly sea-bed
OUR EXPERTISE AND INNOVATION EFFORTS
anchoring operations for Offshore windmills
ARE WELL SUITED TO SUPPORT OUR
CUSTOMERS IN FOUR CLUSTERS
CCUS – Applied research phase, partnership with O&G majors
► Recognized track record in supplying products
for geothermal applications ► Leverage our material expertise to develop services to CO2-capture
technology providers
► PREON® experience in light tubular steel ► Combine VAM®’s seal tightness performance with the development of
structure for complex construction “intelligent pipes” to offer a global integrity solution for CO2 transportation
► Strong know-how (steel, pipe and connection and injection ecosystem
design) in conveying and containing
dangerous fluids safely Hydrogen – Definition of offering for highly promising market
► A dedicated organization launched to drive ► Develop tubular solutions for Hydrogen storage in salt caverns
innovation projects related to energy transition ► Develop storage, compression & distribution systems for refueling stations
Identified projects to ramp up into material revenue by 2025
19 February, 2020 33B 2a €200M ADDITIONAL GROSS SAVINGS TARGETED IN 2021-2022…
“ACCELERATION” IS A TRANSVERSE PROGRAM…
► Industrial excellence to boost performance and reliability: Industry 4.0 to reduce process variabilities and accelerate flow management
► Efficiency of industrial support functions and SG&A: benchmarking / alignment on best-practices (e.g. maintenance, logistics, end-to-end
processes engineering)
… SUPPORTED BY REGIONAL INITIATIVES
Europe Brazil North America
► Full year impact in 2021 of German ► Continue improvement at ► Upgrade performance of
savings plan Jeceaba site maintenance
• « One mill » concept • Consolidate performance of steel ► Debottleneck finishing operations
plant and further enhancement of and optimize costs
• Reisholz mill closure in H2 2020
rolling mill efficiency
(additional headcount reduction of ► Internalization of some outsourced
c.200) ► New « Mini-mill » program on services
Barreiro site
► Product portfolio optimization
• Flow re-engineering yielding
debottlenecking and cost
improvement
19 February, 2020 34B 2b … AND FURTHER DEPLOYMENT OF NEW ROUTES
COMPLETION OF NEW ROUTES PRODUCT PORTFOLIO EXTENSION…
► Premiumization: Complete industrialization plan for premium grades in Tianda, targeting close to 40% premium production ratio in 2024, up
from 20% in 2019
► Certifications: VSB and Tianda certifications by Majors and NOCs to serve them with an enhanced, agile and cost efficient offer
… LEADING TO INCREASED UTILIZATION OF BRAZILIAN AND ASIAN ROUTES
New routes utilization rate for premium O&G EA-MEA 1
55% c. 70%
19%
2015a 2019a 2024e
O&G growth in EA-MEA to be essentially served by new routes, corresponding to volume growth from c.300kt to c.500kt
Note
1. Percentage of premium OCTG and PLP products rolled in VSB or Tianda on total deliveries of “swing orders”, i.e. orders that can be served indifferently from Europe, Brazil or Asia
19 February, 2020 354 2020 GUIDANCE AND FINANCIAL
PERSPECTIVES
362020 GUIDANCE
UNDERPINNED BY REALISTIC MARKET ASSUMPTIONS AND SECURED BY SELF HELP INITIATIVES
MARKET DRIVERS SELF HELP
► O&G: ► Continued rationalization of German
• 2019 bookings up +16% versus 2018 operations in the frame of the 2019-2020
• Sharp increase in contribution from high savings plan
EUROPE AFRICA alloy OCTG following tightening market ► Closure of Reisholz mill in H2 2020 Continued
AND MIDDLE EAST • Start of ADNOC mega-contract with first cash
ASIA deliveries in H2 2020 discipline
with
► Industry:
reduction in
• German market assumed stable net working
capital
requirements
► Conservative view on market trends, with ► Market share gain opportunity following
to c.100 days
maintained cash discipline by operators local OCTG industry consolidation
NORTH AMERICA of sales1 and
► Rebound of volumes observed in Q1 following 2020 gross
H2 2019 destocking, prices bottoming out capex of
c.€200m
► Step-change in deliveries for deep off-shore, ► Continued savings in the frame of the
SOUTH AMERICA with full visibility on customers drilling plans 2019-2020 plan
► Slightly lower iron ore prices
2020 OUTLOOK: €500m EBITDA AND FREE CASH FLOW SLIGHTLY POSITIVE
EBITDA / FCF PHASING: Q1 MARKED BY USUAL SEASONALITY EFFECT AND H2 SIGNIFICANTLY STRONGER THAN H1
Note:
1. Average quarterly basis
19 February, 2020 37BEYOND 2020: SIGNIFICANTLY IMPROVING CASH
GENERATION
► Topline
► Supportive market trends
► Strong position on key markets
► Enhanced competitiveness
EBITDA GROWTH ► Development of new products and solutions for core markets
► Energy transition opportunities
► Operating costs
► Lowered break-even
► Acceleration program targeting additional €200m gross savings over 2021-2022
► c.€50m reduction in interest charges expected
► c.€25m from combined rights issue and RCF refinancing on a yearly basis, compared to 2019
► c.€25m from exercise of call option on lease contract in Brazil, with an additional positive c.€6-8m impact on
EBITDA
► Enhanced credit profile offering potential for rating upgrade
SIGNIFICANTLY
► Reduced restructuring charges
IMPROVED CASH
► Operational restructuring completed in 2020
GENERATION
► Limited restructuring cash outflow
► Reduced working capital
► Further working capital reduction in days of sales
► Contained capex
► €200-250m annual capex envelope
19 February, 2020 385
RIGHTS ISSUE AND RCF REFINANCING TO
SUPPORT TURN-AROUND AND EXECUTION OF
STRATEGIC OBJECTIVES
39PROPOSED RIGHTS ISSUE…
Quantum ► c.€800m
► Bpifrance undertaking to subscribe pro-rata its 14.6% stake1
► Nippon Steel undertaking to subscribe aiming to hold approx. 10% of Vallourec’s share capital upon completion of
Underwriting the Rights Issue1
► Vallourec has obtained a standby commitment from a syndicate of banks to underwrite the balance of the Rights
Issue, subject to customary conditions
► Terms of the rights issue to be determined by the Management Board of Vallourec
Terms
► Delegation to be granted by Vallourec shareholders’ EGM
► Deleverage to c.2.8x2 at year-end 2020 on a proforma basis
Use of Proceeds
► Finance the exercise of call option on lease contract in Brazil (DBOT) for up to €100m
► Annual Ordinary and Extraordinary Shareholder’s Meeting scheduled on April 6 th, 2020
Timing
► Launch of the rights issue expected in Q2 2020
Note:
1. The total net amount to be newly invested by Nippon Steel for subscription is capped at €35m and that of Bpifrance is capped at €120m
2. At constant foreign exchange rates and including an accounting impact on net debt in 2020 of the exercise of call option on lease contract in Brazil and the transaction-related expenses
19 February, 2020 40…TO ALLOW SIGNIFICANT DELEVERAGING
SIGNIFICANT DELEVERAGING POST RIGHTS ISSUE
€m
5.9x 3.5x c.2.8x1
2,031
c.1,400
1,231
(800)
2019A Net Debt Gross Proceeds of 2019A Net Debt Proforma for 2020E Net Debt Proforma for
Rights Issue Rights Issue Rights Issue 1
x Net Debt / EBITDA
Note:
1. At constant foreign exchange rates and including an accounting impact on net debt in 2020 of the exercise of call option on lease contract in Brazil and the transaction-related expenses
19 February, 2020 41RCF REFINANCING SUPPORTING VALLOUREC LIQUIDITY
► Refinancing of the RCF with our relationship banks
► €800m of commitments providing ample resources given liquidity needs (subject to Rights Issue
completion)
► Long-term liquidity sources with a maturity of 4 years + 1 year extension option
► Facility subject to a covenant to maintain a gearing ratio of a maximum of 100%, similar to
Vallourec’s current facilities
PRO-FORMA LIQUIDITY SOURCES NO DEBT MATURITY BEFORE 2022
€m €m
1,794 1,692
Undrawn 800
800 800
RCF
(1 702) 250
800 892 Cash 550 555
400
Cash as of Repayment Gross New RCF Total PF 2020e 2021e 2022e 2023e 2024e & After
31/12/2019 of Drawn RCF Proceeds Liquidity
Bonds OCEANE RCF (undrawn)
of Rights Issue as of
31/12/2019
19 February, 2020 426 CONCLUSION
43CONCLUSION
► Strong improvement in 2019 results with 2020 objectives confirming our operational and
financial recovery
► Enhanced competitiveness already translating into tangible high profile commercial wins
► Ideally positioned to benefit from rapidly growing Brazil offshore and resumption of E&P
projects in international markets
► Ready to capture future growth opportunities in services and energy transition
► Competitiveness to be further improved through additional efforts on costs and continued
deployment of new routes
► Deleveraging and liquidity extension supporting turnaround and execution of strategic
objectives
19 February, 2020 447 APPENDICES
45FY 2019 REVENUE BRIDGES
2018 – ’19 REVENUE BRIDGE PER MARKET
283 (54) 120 (97) 4,173
3,921
2018 O&G Refining & Petrochems Industry & other Power Gen 2019
2018 – ’19 REVENUE BRIDGE BY GEOGRAPHY
99 4,173
3,921 134
(66) 77 8
2018 North America South America Europe Asia & Middle East Rest of world 2019
19 February, 2020 46REVENUE BREAKDOWN – Q4 2019
REVENUE BY REGION
As % of As % of Change
In millions of euros Q4 2019 Q4 2018
revenues revenues YoY
Europe 138 13.7% 159 14.3% -13%
North America 234 23.3% 317 28.4% -26%
South America 194 19.3% 156 14.0% 24%
Asia & Middle East 339 33.8% 321 28.7% 6%
Rest of World 99 9.9% 163 14.6% -39%
Total 1,004 100% 1,116 100% -10%
REVENUE BY MARKET
As % of As % of Change
In millions of euros Q4 2019 Q4 2018
revenues revenues YoY
Oil & Gas 686 68.3% 737 66.0% -7%
Petrochemicals 76 7.6% 84 7.5% -10%
Oil & Gas, Petrochemicals 762 75.9% 821 73.5% -7%
Mechanicals 77 7.7% 146 13.1% -47%
Automotive 23 2.3% 34 3.1% -32%
Construction & Other 105 10.4% 55 4.9% 91%
Industry & Other 205 20.4% 235 21.1% -13%
Power Generation 37 3.7% 60 5.4% -38%
Total 1,004 100% 1,116 100% -10%
19 February, 2020 47REVENUE BREAKDOWN – FY 2019
REVENUE BY REGION
As % of As % of Change
In millions of euros 2019 2018
revenues revenues YoY
Europe 595 14.3% 587 15.0% 1%
North America 1,215 29.1% 1,281 32.7% -5%
South America 702 16.8% 625 15.9% 12%
Asia & Middle East 1,222 29.3% 1,088 27.7% 12%
Rest of World 439 10.5% 340 8.7% 29%
Total 4,173 100% 3,921 100% 6%
REVENUE BY MARKET
As % of As % of Change
In millions of euros 2019 2018
revenues revenues YoY
Oil & Gas 2,752 65.9% 2,469 63.0% 11%
Petrochemicals 290 7.0% 344 8.8% -16%
Oil & Gas, Petrochemicals 3,042 72.9% 2,813 71.7% 8%
Mechanicals 368 8.8% 469 11.9% -22%
Automotive 115 2.8% 148 3.8% -22%
Construction & Other 456 10.9% 202 5.2% 126%
Industry & Other 939 22.5% 819 20.9% 15%
Power Generation 192 4.6% 289 7.4% -34%
Total 4,173 100% 3,921 100% 6,4%
19 February, 2020 48BALANCE SHEET AS AT DECEMBER 31, 2019
Assets (in millions of €) 31 Dec 2019 1 Jan 2019 31 Dec 2018 Liabilities 31 Dec 2019 1 Jan 2019 31 Dec 2018
Post IFRS 16 Post IFRS 16 Pre IFRS 16 Post IFRS 16 Post IFRS 16 Pre IFRS 16
Equity, Group share (1) 1,467 1,802 1,802
Non-controlling interests 513 462 462
Net intangible assets 63 71 71 Total equity 1,980 2,264 2,264
Goodwill 364 358 358 Shareholder loan 21 29 29
Net property, plant and equipment 2,642 2,777 2,691 Bank loans and other borrowings (A) 1,747 1,746 1,797
Biological assets 62 60 60 Non current lease debt (D) 104 115 -
Associates 129 134 134 Employee benefits 228 214 214
Other non-current assets 132 156 156 Deferred tax liabilities 9 15 15
Deferred tax assets 249 250 250 Provisions and other long-term liabilities 61 50 50
Total non-current assets 3,641 3,806 3,720 Total non-current liabilities 2,149 2,140 2,076
Provisions 121 136 136
Overdrafts and other short-term borrowings
Inventories and work-in-progress 988 1,135 1,135 (B) 2,077 993 1,001
Trade and other receivables 638 599 599 Current lease debt (E) 30 30 -
Derivatives - assets 7 3 3 Trade payables 580 582 582
Other current assets 237 216 216 Derivatives - liabilities 18 32 32
Cash and cash equivalents (C) 1,794 740 740 Tax and other current liabilities 329 293 293
Total current assets 3,664 2,693 2,693 Total current liabilities 3,155 2,066 2,044
TOTAL ASSETS 7,305 6,499 6,413 TOTAL EQUITY AND LIABILITIES 7,305 6,499 6,413
Net debt (A+B-C) 2,031 1,999 2,058 * (1) Net income (loss), Group share (338) (502)
Lease debt (D+E) 134 145 **
* €2,058 million at end of December 2018 includes €59 million of financial lease debt
** Cf detailed explanation in Lease debt IFRS 16 on slide 51
19 February, 2020 49GROSS INDEBTEDNESS
As at 31
In millions of euros
December 2019
Private placement – maturing in August 2027 54
Bond issue – maturing in September 2024 499
Non-convertible bond issue – maturing in October 2022 545
Convertible bond issue – maturing in October 2022 233
Bond issue – maturing in October 2023 396
Commercial paper 110
RCF drawings 1,702
BNDES loan 20
ACC ACE 207
Other 58
Total 3,824
19 February, 2020 50LEASE DEBT - IFRS 16
31 Dec 2019 Change versus 1 1 Jan 2019
In millions of euros 31 Dec 2018
Post IFRS 16 Jan 2019 post IFRS 16
50 -€9m Financial lease debt (1) 59 59
84 -€2m Operational lease (2) 86 -
134 -€11m Total lease debt (3) 145 -
(1) Included in net debt prior to IFRS 16; reclassified to lease debt on 1 st January 2019
(2)
Operational lease reported in off balance sheet items prior to IFRS 16; recognized as lease debt on 1 st
January 2019
(3) - New line items (current & non-current lease debts) identified on the balance sheet under IFRS 16
- At December 31st, 2019, lease debt of €134 million is split into:
Non Current Lease Debt €104 million
Current Lease Debt €30 million
19 February, 2020 51► Euronext Paris: ISIN code: FR0000120354,
Ticker: VK
USA: American Depositary Receipt (ADR) - ISIN
code: US92023R2094, Ticker: VLOWY
► Investor Relations Contact - Vallourec Group
• Email: investor.relations@vallourec.com
• www.vallourec.com
52You can also read