VIRTUAL INVESTOR DAY 2021 - March 3, 2021 - EW Scripps Company
←
→
Page content transcription
If your browser does not render page correctly, please read the page content below

VIRT UAL INVESTOR DAY 2021

          March 3, 2021

                             1
This document contains certain forward-looking statements related to the company’s
                        businesses that are based on management’s current expectations. Forward-looking
                        statements are subject to certain risks, trends and uncertainties, including changes in
S A F E H A R B O R
  D I S C L O S U R E   advertising demand and other economic conditions that could cause actual results to differ
                        materially from the expectations expressed in forward-looking statements. Such forward-
                        looking statements are made as of the date of this document and should be evaluated with
                        the understanding of their inherent uncertainty.

                        Included in this presentation are certain non-GAAP (generally accepted accounting
                        principles) financial measures, in particular adjusted EBITDA and unlevered free cash flow,
                        and are provided as supplements to assist management and the public in their analysis and
                        valuation of the company. These metrics are not formulated in accordance with GAAP, are
                        not meant to replace GAAP financial measures and may differ from other companies’ uses
                        or formulations. A reconciliation of non-GAAP financial measures to GAAP measures
                        reported in our financial statements is included in the appendix.

                        A detailed discussion of principal risks and uncertainties, including those engendered by the
                        COVID-19 pandemic, that may cause actual results and events to differ materially from such
                        forward-looking statements is included in the company’s form 10-K on file with the SEC, in
                        the section titled “risk factors.” The company undertakes no obligation to publicly update
                        any forward-looking statements to reflect events or circumstances after the date such
                        statements are made.

                                                                                                                        2
AGENDA   A quick look at our recent milestones

         Scripps today – A full-scale TV enterprise

         Introducing the new Scripps Networks

         Local Media – The value creation ahead

         Financial highlights

                                                      3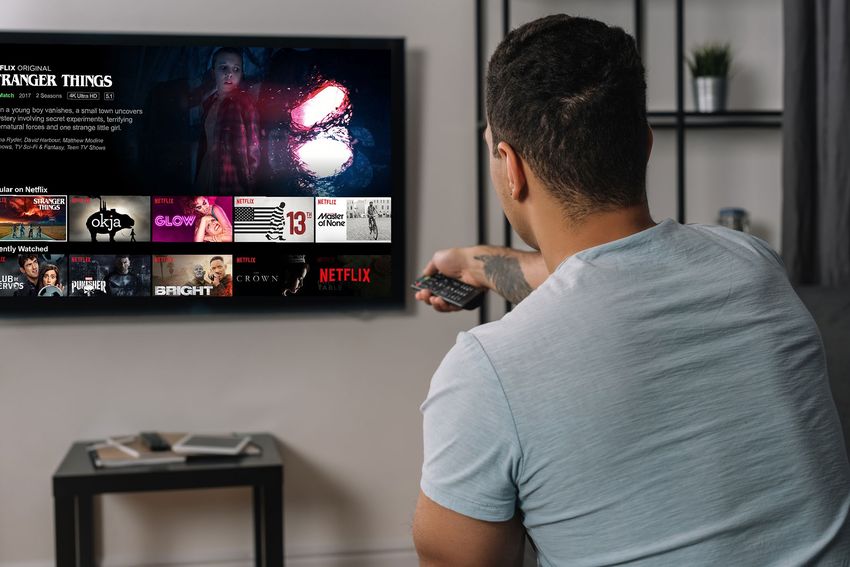
WE HAVE:

                         Reduced company costs by $30 million

                         Restructured and reorganized the company for greater
                         efficiency and effectiveness

                         More than doubled the size of our local television station
SINCE 2017,              portfolio to improve short-term operating performance
                         and to capture more retransmission and political revenue
OUR TEAM
HAS METHODICALLY         Grew and then divested of assets for excellent ROI
EXECUTED
A PLAN THAT              Acquired the fifth-rated national broadcast network, ION,
                         to create a full-scale national networks business that
HAS IMPROVED             creates more than $500 million in synergies
OUR FINANCIAL
PERFORMANCE              Improved margins through prudent expense management
AND SET-UP
                         Positioned the company for greater free cash flow
LONG-TERM                generation and continued growth
GROWTH …
                                                                                      4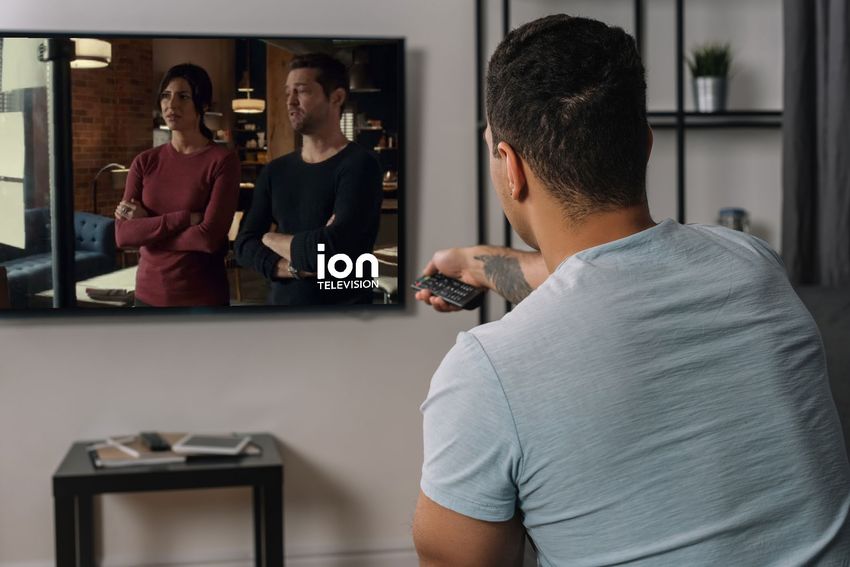
… AND OUR RESULTS DEMONSTRATE THE BENEFITS TO SHAREHOLDERS

                                         • Total shareholder return over last three years of 58%
                                         • Year-to-date stock price up 33% compared to S&P 500 up 4%
                                         • Year-to-date stock price up 33% versus local TV peers up 24%
                                         • Adjusted EBITDA more than doubled from 2016-2017 to 2019-2020
                                         • Met or exceeded guidance for nine consecutive quarters prior to the pandemic

                                                                                                                          5
Based on Scripps’ closing stock price of $20.30 on March 2, 2021
SCRIPPS’ MISSION IS THE UNDERPINNING OF OUR APPROACH
                  TO CORPORATE SOCIAL RESPONSILBILTY

With a motto to “Give light and the people will find their own way,” Scripps delivers on our responsibilities
     as a media corporation by engaging and entertaining, informing and empowering our audiences;
      supporting childhood literacy and other causes in our markets; and representing the diversity
                   of our country on our board, in our workforce and in our work itself.

  IMPACTFUL              CORPORATE            EQUITY, DIVERSITY        HUMAN CAPITAL          ENVIRONMENTAL
 JOURNALISM                GIVING               & INCLUSION             MANAGEMENT             STEWARDSHIP

                                                                                                                6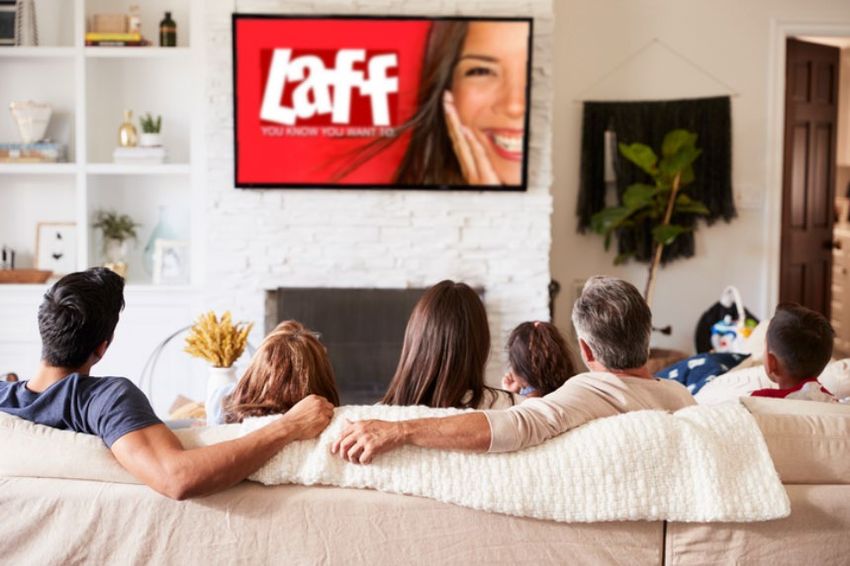
Scripps today:
A full-scale TV enterprise
ADAM SYMSON, SCRIPPS PRESIDENT & CEO

                                       7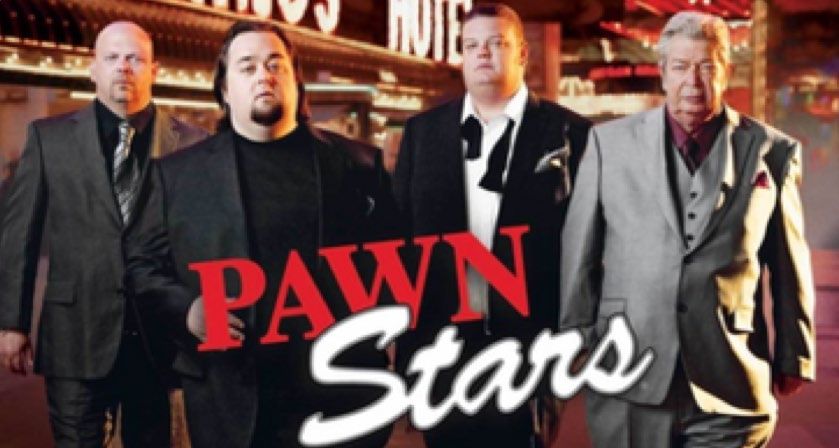
SCRIPPS TODAY IS A DIVERSIFIED TELEVISION COMPANY
                         WHOSE REACH IS BOTH BROAD AND DEEP

                                                    LOCAL MEDIA

•   $1.5 billion in 2020 revenue
•   Reach 25% of U.S. TV households
•   61 stations in 41 markets
•   10 duopolies
•   Diverse affiliation mix
•   $265 million of 2020 political revenue, 35%
    above record 2018 revenue (adjusted combined)
•   $579 million of 2020 retransmission revenue,
    31% above 2019 (adjusted combined)
•   Strong local news ratings; morning shows in
    aggregate for 2020 beat 2015-2018 numbers
                                                                       8
SCRIPPS TODAY IS A DIVERSIFIED TELEVISION COMPANY
                            WHOSE REACH IS BOTH BROAD AND DEEP

           SCRIPPS NETWORKS

•   The leader in free over-the-air television
•   Reach nearly every U.S. TV household
    over the air
•   Available through OTA, OTT and pay TV
•   Demo-targeted entertainment and news
    programming
•   Sold in the upfront and scatter markets
•   2020 adjusted combined revenue of
    $847 million
•   2020 adjusted combined segment profit
    of $320 million

                                                                          9
SCRIPPS TODAY IS A HIGHLY PROFITABLE TELEVISION COMPANY AND
     REALIZED TREMENDOUS RETURNS ON OUR DIGITAL INVESTMENTS

Cash-on-cash return: ~ 2x                                                 Cash-on-cash return: 1.6x

  In the last 13 years, Scripps has created shareholder value through the spinoff of Scripps Networks Interactive,
               the high-return exits of terrestrial radio, podcasting and, soon, digital audio technology,
                      and the acquisition of highly profitable companies including Katz and ION.

                                                                                                                     10
OUR GROWTH STRATEGIES HAVE FOCUSED ON
THE TELEVISION BUSINESS FOR MANY REASONS
• Station/spectrum ownership has high barriers to
entry
• Local broadcast has multiple revenue streams and
local, national and political advertising
• Our local brands are strong and trusted, built on
serving local communities
• The industry forms long-term, predictable,
mutually beneficial partnerships
• Our national networks reach nearly every
American with free, quality programming
• Broadcast television is a ‘lean-back’ medium with
tremendous audience connection and ease of
program discovery
• Broadcast television is the most powerful way for
advertisers to build brands and drive sales
11THE PARADOX:
THE GROWTH OF
SVOD IS DRIVING
THE RESURGENCE
OF FREE
ADVERTISING-
SUPPORTED
TELEVISION
VIEWING Over-the-air is the original free ad-supported television and complements
subscription services for consumer convenience and advertiser reach.
1240% OF U.S. TELEVISION HOUSEHOLDS WERE
‘ANTENNA HOMES’ IN 2020 — COMPARED TO 29% IN 2019
A recent Horowitz report finds that over-the-air viewing is growing, especially among non-cable households,
as consumers create their own ‘self-bundles’ by pairing streaming and broadcast viewing.
The report found: • 57% said they bought antennas primarily because
they do not have cable and wanted access to local
• The percentage of TV viewers who own an antenna broadcast.
is on the rise – from 29% of Nielsen’s 121 million
• 65% of those ages 35-49 gave that answer
U.S. TV household count in 2019 to 40% in 2020
– or nearly 50 million households. • 32% of respondents said local broadcast access
was their second reason for getting the antenna
• 54% of antenna users report buying their first
antenna in the last three years – so they are new • 79% of non-cable/satellite subscribers say
to OTA. they have an antenna on their most-frequently
used TV – they are bundling free OTA with
streaming services.
Source: Horowitz State of OTA 2020, the consumer insights agency’s second annual report on
antenna users and over-the-air viewing. Research conducted in October 2020.
13AS CONSUMERS SELF-BUNDLE, THEY CHOOSE FREE BROADCAST TV
AS AN EFFICIENT PAIRING WITH STREAMING SUBSCRIPTION SERVICES
Over-the-air is a key component to the new consumer bundle.
2015 PAY-TV 2018 CORD-
THE NEW SELF-BUNDLE
SUBSCRIBER CUTTER BUNDLE
$$$$ $$ $$$$ FREE
14IN A WORLD WHERE THE CONSUMER IS SELF-BUNDLING,
SCRIPPS DOMINATES FREE OVER-THE-AIR TV VIEWING
THE NEW SELF-BUNDLE
15Introducing the new
Scripps Networks
L I S A K N U T S O N , P R E S I D E N T, S C R I P P S N E T W O R K S
16THE SCRIPPS NETWORKS MEET THE NEEDS OF AMERICAN AUDIENCES
WHO ENGAGE WITH ENTERTAINING AND INFORMATIVE PROGRAMMING
17THESE NETWORKS
ARE THE LARGEST
SINGLE PORTFOLIO
IN THE GROWING
FREE BROADCAST
TV MARKETPLACE
18OUR NETWORKS
ARE POPULAR
BECAUSE
VIEWERS OFTEN
ARE SEEKING
A ‘LEAN-BACK’
EXPERIENCE
IN THEIR
VIEWING
WITH FAMILIAR
QUALITY
PROGRAMMING
19THE SCRIPPS NETWORKS ARE WATCHED BY 78 MILLION VIEWERS EACH MONTH AND
ARE PROGRAMMED TO ATTRACT DESIRABLE DEMOGRAPHICS FOR ADVERTISERS
OUR AUDIENCE IS DIVERSE
Young Adult Drama Lovers
African Americans News Junkies
Comedy Lovers Of All Stripes
20THE SCRIPPS NETWORKS ARE HIGHLY RATED AND HIGH-RANKING
AMONG COMPETING NETWORKS
2020 PRIME TIME TOTAL AVERAGE VIEWERS
ION: Cable Networks (excluding news) ION: Broadcast Networks African American Networks
901 No. 1 3,108 No. 1 364 No. 1
802 No. 2 2,791 No. 2 291 No. 2
796 No. 3 2,565 No. 3 278 No. 3
790 No. 4 2,504 No. 4 132 No. 4
639 No. 5 901 No. 5 40 No. 5
Viewers in thousands
Source for ION: Nielsen from the average prime time ratings in the 2019-20 television season; data shown for all U.S. TV households. 21
Source for Bounce: Nielsen, Prime time, Live+3, Jan. 1, 2020 – Dec. 31, 2020, P2+ CourtTV and Newsy are not yet Nielsen rated into competitive sets of networks.THE SCRIPPS NETWORKS ARE HIGHLY RATED AND HIGH-RANKING
AMONG COMPETING NETWORKS
2020 PRIME TIME TOTAL AVERAGE VIEWERS
Classic Television Networks True Crime Networks Comedy Networks
670 No. 1 752 No. 1 973 No. 1
562 No. 2 310 No. 2 393 No. 2
388 No. 3 261 No. 3 331 No. 3
123 No. 4 138 No. 4 222 No. 4
112 No. 5 11 No. 5 189 No. 5
Viewers in thousands
Source: Nielsen, Prime time, Live+3, Jan. 1, 2020 – Dec. 31. 2020 P2+. 22
CourtTV and Newsy are not yet Nielsen rated into competitive sets of networks.MEDIA BUYERS CAN’T REACH VIEWERS ON AD-FREE SVOD; THE SCRIPPS NETWORKS
SOLVE THIS PROBLEM THROUGH POPULAR FREE AD-SUPPORTED TV
THE NEW SELF-BUNDLE
23THE FOUNDATION OF OUR VALUE CREATION IS THESE FOUR GROWTH DRIVERS
1 2 3 4
Free TV Viewing Expanded Distribution Portfolio Expansion Maximizing Yield
Accelerating growth Continued distribution Efficient expansion of our Continued enhancement of our
in the over-the-air growth of our networks portfolio to super-serve advertising yield through
marketplace on OTA, OTT and pay TV the over-the-air audience audience growth and better
yield management
24GROWTH DRIVER NO. 1:
ACCELERATING GROWTH IN THE OVER-THE-AIR MARKETPLACE
A comparison of viewing on all TV, only cable and only OTA, 2017-20
Total TV usage impressions Cable impressions Over-the-air impressions
39,000 7,000
46,000
38,000 6,000
45,500 37,000 5,000
+10%
36,000 4,000
45,000
3% 35,000 3,000
44,500
34,000 2,000
-3%
44,000 33,000 1,000
32,000 0
43,500
2017 2018 2019 2020 2017 2018 2019 2020 2017 2018 2019 2020
While total TV impressions – a Nielsen measure of people who watched TV – grew slightly in the pandemic year and
cable impressions continued to decline; over-the-air impressions grew 10% over 2019 as more people sought out free TV.
25
Source: NielsenGROWTH DRIVER NO. 2:
CONTINUED DISTRIBUTION GROWTH OF OUR NETWORKS
ON OTA, OTT AND PAY TV
Over-The-Air
Over-The-Top
Free Ad-Supported
Streaming TV
Pay TV
26Percentage share of national network
viewing from over-the-air households
(people 18-49, total day)
The Scripps Networks
command a larger
7% share of the nationwide
7% 26% viewing audience at the
expense of other
broadcast networks.
Traditional
86% broadcast networks
74% ION
GROWTH DRIVER NO. 3: Katz networks
EFFICIENT EXPANSION Scripps Networks
OF OUR PORTFOLIO
TO SUPER-SERVE THE
OVER-THE-AIR AUDIENCE
2015 2020
27
Source: Nielsen, Live+3 viewing for Mon-Sun 6a-6a.GROWTH DRIVER NO. 3:
EFFICIENT EXPANSION OF OUR PORTFOLIO
TO SUPER-SERVE THE OVER-THE-AIR AUDIENCE
The result
of our portfolio
expansion
is a business with
significant share
in each of our
demographic
market areas.
28GROWTH DRIVER NO. 3:
EFFICIENT EXPANSION OF OUR PORTFOLIO
TO SUPER-SERVE THE OVER-THE-AIR AUDIENCE
OUR TWO NEW NETWORKS WILL LAUNCH IN JULY
Real life. Big drama. No apologies. Here’s to the mavericks, bold and true.
29GROWTH DRIVER NO. 4:
CONTINUED ENHANCEMENT OF OUR ADVERTISING YIELD
THROUGH AUDIENCE GROWTH AND BETTER YIELD MANAGEMENT
CONSOLIDATED DIRECT RESPONSE ADVERTISING INVENTORY
AD SALES ADVERTISING YIELD MANAGEMENT
We are selling advertising for the We are capitalizing on the We will more effectively
Scripps Networks in the upfront growing direct response manage inventory
as a collection of attractive marketplace using the same and rate to drive
demographics together or strategies we have used so higher revenue.
individually, depending on the successfully at Katz.
brand marketers’ needs.
ION consistently ranks in the top 10 for network and cable audiences and yet is ranked only 25th in advertising revenue yield.
302019 – 2020 Combined Financials
Ad Revenue Mix
OTT
5%
OTT
GROWTH 5%
Direct
DRIVER NO. 4: Response
CONTINUED 43%
General Market
ENHANCEMENT 52%
OF OUR
ADVERTISING
YIELD THROUGH
AUDIENCE
GROWTH AND
BETTER YIELD We will manage our networks’ advertising mix between general market and
MANAGEMENT direct response to optimize our greatest return.
31GROWTH DRIVER NO. 4:
CONTINUED ENHANCEMENT OF OUR ADVERTISING YIELD
THROUGH AUDIENCE GROWTH AND BETTER YIELD MANAGEMENT
OTT
ION 5% Grit
~70% ~99%
General Direct
Market Response
General Market Direct Response
We will manage our networks’ advertising mix between general market and direct response to optimize our greatest return.
32THE NETWORKS ARE EXPECTED TO GENERATE NEAR-TERM
ANNUAL REVENUE GROWTH OF MORE THAN 10% AND DIVISION MARGINS OF ABOUT 40%
FINANCIAL HIGHLIGHTS OF THE SCRIPPS NETW ORKS DIVISION
Revenue
• 2020 adjusted combined revenue year over year: About flat
• Near-term future year-over-year revenue growth: Up more than 10%
Synergies from ION acquisition to create Scripps Networks
• More than $500 million through 2025, mostly contractually based
savings as distribution agreements expire
Segment profit/profit margins
• 2020 adjusted combined segment profit: $320 million
• Near-term future division margins: About 40%
33Local Media:
The value creation ahead
B R I A N L A W L O R , P R E S I D E N T, L O C A L M E D I A
34THE HEALTH OF LOCAL CORE ADVERTISING IS BOLSTERED
BY ECONOMIC IMPROVEMENT AND NEW CATEGORY GROWTH
Core advertising is sustainable and resilient because of the lasting appeal of linear television
and the need for local and national businesses to reach geographically based mainstream audiences.
DURABILITY THE POPULARITY RESURGENCE OF
RETAIL OF HOME
OF SERVICES RETURN OF AUTO IMPROVEMENT TRAVEL AND LEISURE
THE RISE OF
SPORTS BETTING OTT AD GROWTH
35CORE ADVERTISING DRIVERS: SERVICES, NOW A THIRD OF CORE AD REVENUE,
BENEFIT FROM STRONG CONSUMER CONFIDENCE
DURABILITY
OF SERVICES
Scripps’ services category was its strongest
category through the pandemic. It has shown
consistent growth since the election in
November, driven by a recovering economy.
This category includes insurance, medical, legal
and home services such as HVAC and
landscaping. It is primarily a local category and
is dependent on disposable income.
36CORE ADVERTISING DRIVERS: AUTO, ABOUT 20% OF CORE AD REVENUE,
IS EXPECTED TO RETURN TO GROWTH THIS YEAR
RETURN
OF AUTO
Auto, our second-largest category,
has been challenged by a host of changes
in the industry in recent years as well as the
recent difficult economic climate. But we are
seeing it stabilize. Some sub-categories have
fully recovered, and local dealer spending is
expected to rise this year as they establish
more profitable structures.
37CORE ADVERTISING DRIVERS: RETAIL, OUR THIRD-LARGEST CATEGORY,
IS JUST BEGINNING TO RECOVER FROM THE IMPACT OF THE PANDEMIC
RETAIL
2020 was a tough year for retail, as brick
and mortar locations faced capacity limits set
by state government. March 2021 is pacing to be
its best month in a year – the first in growth
mode and a real turnaround from its recent
performance. We expect an increase in spending
as restrictions are lifted and retailers seek to
regain market share lost to online shopping.
38CORE ADVERTISING DRIVERS: HOME IMPROVEMENT IS NOW A TOP 5 CATEGORY
THE POPULARITY
OF HOME
IMPROVEMENT
Home improvement began to
grow again in November and has
continued to be up year over year, despite
the pressures of the pandemic economy.
This category has benefitted from
unspent disposable income, increasing
real estate prices and a return
to suburban living.
39CORE ADVERTISING DRIVERS: TRAVEL AND LEISURE CONTINUES TO BE THE
HARDEST HIT BY COVID, BUT WE EXPECT IT TO ROAR BACK LATER THIS YEAR
RESURGENCE OF
TRAVEL AND LEISURE
No category has suffered more than travel and
leisure, as everything from personal travel to live
events and casino visits completely halted when
COVID-19 set in last March.
Sports betting is an emerging sub-category that
has brought new dollars to travel and leisure as
states ratify new gaming laws and large players seek
to establish new customers and market share.
40CORE ADVERTISING DRIVERS: SPORTS BETTING IS NOW A BIG CONTRIBUTOR
AS A GROWING NUMBER OF STATES MAKE IT LEGAL
Legalized Betting by State
Scripps has markets
in seven states that
have legalized
sports betting:
Colorado, Indiana,
Tennessee, Michigan,
Montana, Nevada
and Virginia.
Louisiana is
Scripps Markets
coming this spring.
41
Source: TVBCORE ADVERTISING DRIVERS: A NEW REVENUE STREAM OF CORE IS GROWING
FROM LOCAL NEWS BRANDS’ OVER-THE-TOP TELEVISION DISTRIBUTION
OTT AD GROWTH
Over-the-top video platforms provide local
broadcasters new opportunities to extend their
local TV brands. As advertisers seek to target ads
to local consumers, our established and
respected brands are providing an entirely new
platform for businesses to connect to local
consumers – revenue that became meaningful in
2020 and will continue to grow with
OTT viewership.
42REVENUE DRIVERS: THE 2022 MID-TERM ELECTION YEAR IS EXPECTED
TO EXCEED EVEN THE RECORD 2020 POLITICAL AD SPENDING
2022 POLITICAL YEAR HIGHLIGHTS
• $9 billion is the new national spending mark, and Scripps will take more
than our fair share because of our political sales prowess.
• We host 17 governor’s races in 2022, including Arizona, Colorado,
California, Florida, Kansas, Nebraska, Nevada, Ohio, Texas and Wisconsin.
• We host 18 U.S. Senate races, including Arizona, California, Colorado,
Florida, Kansas, Nevada, Ohio and Wisconsin.
• We will be impacted by nationwide redistricting due to the 2020 census. We
expect races in six of our states to become more competitive: Arizona,
Colorado, Florida, Michigan, New York and Texas.
Scripps markets with strong political advertising spending
In a 2018 report, “Stretching Political Dollars,” AdImpact and Nielsen focused on political advertising in four major U.S.
metropolitan areas: Phoenix, Minneapolis, Tampa and Orlando. The report’s primary conclusion was “how efficient broadcast television
advertising remains” in reaching ‘High Frequency Voters.’ ” — Forbes, Dec. 8, 2020
43REVENUE DRIVERS: AFTER A 31% JUMP IN RETRANSMISSION REVENUE IN 2020,
SCRIPPS EXPECTS ANOTHER BIG INCREASE IN TWO YEARS
GROSS RETRANSMISSION CONTINUES SCRIPPS LOOKS FORWARD TO ANOTHER BIG
ITS STEEP REVENUE TRAJECTORY* RENEWAL YEAR IN JUST TWO YEARS
Cable and
$582 Satellite 4% 21% 75%
Renewals
2021 2022 2023
$383
NONE
$301
11 stations 3 stations
$259
$221 Network
Renewals
6 stations 18 stations
4 stations
4 stations
2016 2017 2018 2019 2020 8 stations
$ in millions
44
*Figures shown on as-reported basis. On an adjusted-combined basis after the divestiture of WPIX, Scripps
reported gross retrans of $440.4 million in 2019 and $578.8 million in 2020 – a 31% increase.AUDIENCE DRIVERS: LIVE SPORTS AND LOCAL NEWS
REMAIN THE PRIMARY REASONS OUR VIEWERS VALUE US
50% of Scripps’ Local Media advertising revenue
comes from local news and live sports programming
45AUDIENCE DRIVERS: EXCLUDING THE PANDEMIC, TV VIEWING REMAINS
CONSISTENT, AND WE EXPECT IT TO RETURN TO PRE-COVID LEVELS
Average Percentage of TV Households
Using Television in Scripps Markets Each Year
51% 51% 52% 52% 53%
50% 46% 50% 49% 47%
45% 44%
23% 24% 24% 24% 24%
21%
6 a.m. 6 p.m. 11 p.m./10 p.m.
2015 2016 2017 2018 2019 2020
46
Source: Nielsen, Live+SDAUDIENCE DRIVERS: OUR NEWS BRANDS MATTER TO LOCAL COMMUNITIES
AND CREATE A DEEP LOYALTY TO LOCAL NEWS
Scripps’ local news coverage inspired new legislation, changed laws and
more open government records more than a dozen times in 2020 – serving
our most important role as a watchdog for our communities and viewers.
47A RECENT MEDIA USE COMPARISON STUDY FOUND
TV REACHES MOST PEOPLE, GARNERS THE MOST TRUST
LOCAL BROADCAST TELEVISION NEWS: NO. 1 FOR TRUST
I trust the news that I see/hear on this media source.
Percentage Agree
75%
71%
68% 67% 66% 66% 63% 61%
59% 58%
56% 55%
45%
31%
Local Local Public Network Radio Local National National/ Cable Network Cable Radio All Other Social
Broadcast Newspapers TV Broadcast Stations TV Newspapers Local News Broadcast TV News Stations Internet Media
TV News News TV News Newspaper Channels TV News Websites/ Websites/ News
News Websites/Apps Websites/Apps Websites/Apps Apps Apps Websites/
Apps
48
Source: Gfk Media Comparisons Study 2021. Persons 18+. Agree Strongly or Agree Somewhat. Q9 – For each source, please indicate the extent to which you agree or disagree with the following statement: I trust the News that I see/hear on this media source.RANK PRO G RAM VIEW ERSHIP
(IN THOUSANDS)
1 FOX SUPERBOWL LIV 50,194
2 FOX SUPERBOWL POST-GUN 42,901
3 FOX SUPERBOWL LIV KICK 32,735
4 FOX SUPERBOWL POST GAME 29,720
5 AFC CHAMPIONSHIP ON CBS 27,840
6 FOX NFC CHAMPIONSHIP 26,491
7 AFC DIVISIONAL PLAYOFF-SU 24,446
8 FOX NFC PLAYOFF-SUN 24,094
9 AFC CHAMP POST GUN ON CBS 23,382
10 NBC NFL PLAYOFF GAME WC 23,103
11 FOX NFC WILDCARD GAME 20,962
12 AFC WILDCARD PLAYOFF 20,584
13 NBC NFL PLAYOFF GAME DIV 19,996
14 FOX NFC PLAYOFF-SU PST GN 19,490
15 FOX NFC CHAMPIONSHIP-GUN 19,367
AUDIENCE DRIVERS: 16 AFC DIVISIONAL PLAYOFF-SA 19,311
LIVE SPORTS GARNER 17 AFC DIV-PLF-POST-GUN-SU 18,972
GREAT VIEWERSHIP 18 FOX NFC CHAMPIONSHIP-KICK 18,864
18,539
19 FOX NFC WILDCARD POST GUN
AND ACCOUNTED 20 FOX SUPERBOWL PRE - 5:30 18,225
FOR ALL BUT ONE 21 AFC CHAMP PRE-KICK ON CBS 16,994
OF THE TOP 25 22 THE OSCARS 16,389
16,235
23 AFC WILDCARD POST GUN
SHOWS IN PRIME TIME 24 FOX NFL SUNDAY-NATIONAL 15,941
LAST YEAR 25 CBS NFL NATIONAL 15,445
49
Source: Nielsen, NNTV Top Ranked Program by Household, Broadcast, Monday -Sunday 6 a.m. – 6 p.m., Sept. 30, 2019 – April 26, 2020 and Sept. 28, 2020 – Jan. 31, 2021GROWTH DRIVERS: MACRO-ECONOMIC FORCES SUCH AS FEDERAL STIMULUS
PORTEND A STRONG ECOSYSTEM FOR CORE ADVERTISING GROWTH
Meaningful federal stimulus
measures promise to put real
money in people’s pockets,
leading to discretionary
spending increases and more
advertising activity.
We began seeing the benefits
of consumer confidence as
our Services and Home
Improvement categories
returned to positive territory
after the election in the fall.
Morgan Stanley Research
Feb. 21, 2021
50Financials for the new Scripps
JASON COMBS, CHIEF FINANCIAL OFFICER
51SCRIPPS’ FINANCIALS REFLECT THE NEW MAKEUP OF THE COMPANY
Scripps Networks Division Local Media Division
52Historical Adjusted Combined Tables
LOCAL MEDIA: 2020 2019
Segment operating revenues:
Core advertising $ 569 $ 683
Political 265 24
Retransmission and carriage fees 579 440
Other 12 19
Total operating revenues 1,425 1,166
Segment costs and expenses:
Employee compensation and benefits 415 409
Programming 394 320
Other expenses 171 186
Total costs and expenses 980 915
Segment profit $ 445 $ 251
Margin 31% 22%
SCRIPPS NETWORKS: 2020 2019
Total operating revenues $ 847 $ 857
Segment costs and expenses:
OUR NEW SEGMENT Employee compensation and benefits 109 101
REPORTING Programming
Other expenses
270
148
272
140
REFLECTS THE WAY Total costs and expenses 527 513
WE OPERATE OUR Segment profit $ 320 $ 344
BUSINESSES Margin 38% 40%
$ in millions
53
Full tables can be found at the back of the Feb. 26, 2021 Scripps earnings release tables.
GAAP reconciliation is in the appendix of this presentation and in the earnings release tables.OUR CAPITAL AND DEBT STRUCTURE ALLOWS US
BROAD FINANCIAL FLEXIBILITY AND MITIGATION OF RISK
CAPITAL STRUCTURE FINANCIAL POLICY
As of Jan. 7, 2021
Secured Debt $2,393 Target mid ~3.0x
Unsecured Debt $1,400 Leverage
De-lever via excess cash flow
Total Debt $3,793
Cash & Equivalents ($263)
Net Debt $3,530
Maintain average cash balance of
Preferred Stock $600 $75 million
Market Capitalization $1,659 Liquidity
Access to $400 million revolver
a
through 2026
Select Credit Stats: Elevated leverage
driven by strategic
Secured Leverage 3.0x acquisition
b
Berkshire Hathaway preferred
a Total Net Leverage 4.9x
No material debt shares prohibit stock repurchase or
Liquidity $663 maturities until dividends while outstanding
2025 Distributions
Weighted Avg. Cost of Debt 4.2%
C
b
Preferred shares: Five-year non-call
Weighted Avg. Maturity 6.3 years Natural interest
hedge with fixed / + $300 million of warrants
C Fixed / Floating (%) 51% / 49% floating mix
54
$ in millions
(1) Based on LQ8A Dec. 31, 2020 EBITDA of $718 million (including ION). Market cap reflected as of March 2, 2021WE HAVE STRATEGICALLY EXECUTED ACQUISITIONS THAT STRENGTHEN
THE ENTERPRISE AND DIVESTITURES THAT BROUGHT STRONG RETURNS
CAPITAL ALLOCATION SINCE 2016 STRONG TRACK RECORD OF SELLING ASSETS
Investment
Return (%)
Local Media
22%
Acquisitions
27%
Dividends 1%
Sale price of $230 million
Share Repurchase
3%
(early 2021 close)
National Media
Acquisitions, net
of divestitures
24%
67%
Other 2%
Sold for $265+ million
(October 2020)
94% of capital deployed since 2016 has been
targeted at strategic M&A opportunities.
55SCRIPPS FLEXED ITS BALANCE SHEET IN ORDER TO
SET UP THE COMPANY FOR AN IMPRESSIVE GROWTH TRAJECTORY
USING LEVERAGE … … TO GROW
6.0x $500
$450
5.2x
$400
4.9x
$350
4.0x
$300
3.7x 3.7x
3.3x $250
$200
2.0x 2.2x $150
$100
$50
$0
2016 2017 2018 2019 2020
0.0x $ in millions
2016 2017 2018 2019 2020 2021 2022 2023 2024 2025 Unlevered free cash flow Adjusted EBITDA
56
Numbers are on an as-reported basisAFTER SEVERAL YEARS OF TRANSFORMATION AND VALUE CREATION, SCRIPPS
IS A FULL-SCALE TV ENTERPRISE AND POWERFUL ECONOMIC ENGINE
Investment Highlights
1. Generating significant free cash flow through our powerful consumer brands in growing marketplaces
2. Capturing the greatest value in the Local Media division from the growing ecosystem of political advertising
revenue and expanding local broadcast retransmission rates
3. Capitalizing on the resilient national advertising marketplace and our owned-and-operated distribution to
grow revenue and expand margins in the Scripps Networks division
4. Helping set the course for the future of broadcast television as the largest holder of spectrum in the U.S.
5. Delivering on our social responsibilities as a media corporation with a focus on creating a better-informed
world; engaging and entertaining, informing and empowering our audiences; and representing the diversity
of our country on our board, in our workforce and in our work itself
57S S P I N V E S T O R D A Y 2 0 2 1
March 3, 2021
58Appendix
59RECONCILIATION OF ADJUSTED EBITDA AND UNLEVERED FREE CASH FLOW
(NON-GAAP MEASURES)
2016 2017 2018 2019 2020
Income (loss) from continuing operations, net of tax $ 62 $ (10) $ 70 $ (2) $ 154
Provision (benefit) for income taxes 35 (19) 23 3 56
Interest expense 18 27 36 81 93
Defined benefit plan expense 14 14 20 7 4
Share-based compensation costs 8 12 11 13 14
Depreciation 33 34 34 40 50
Amortization of intangible assets 20 19 26 44 57
Impairment of goodwill and intangible assets 0 36 0 0 0
Losses (gains), net on disposal of property and equipment 1 0 1 (2) 1
Acquisition and related integration costs 1 0 4 26 19
Restructuring costs 0 4 9 3 0
Miscellaneous, net 2 (7) (0) (1) (3)
Adjusted EBITDA 192 110 234 213 444
Capital expenditures (26) (17) (47) (61) (45)
Proceeds from FCC Repack 0 0 2 7 28
Unlevered free cash flow $ 166 $ 92 $ 189 $ 159 $ 428
$ in millions
60You can also read