Infodemics on Youtube: Reliability of Content and Echo Chambers on COVID-19
←
→
Page content transcription
If your browser does not render page correctly, please read the page content below
Infodemics on Youtube: Reliability of Content and Echo
                                                              Chambers on COVID-19
                                                      Niccolò Di Marco1 , Matteo Cinelli2 , and Walter Quattrociocchi3
                                                                               1
                                                                                University of Florence, Italy
                                                                          2
                                                                              Ca’ Foscari University of Venice
                                                                              3
                                                                                Sapienza University of Rome
arXiv:2106.08684v1 [cs.CY] 16 Jun 2021

                                                                                          Abstract
                                                   Social media radically changed how information is consumed and reported. Moreover, social
                                               networks elicited a disintermediated access to an unprecedented amount of content. The world
                                               health organization (WHO) coined the term infodemics to identify the information overabundance
                                               during an epidemic. Indeed, the spread of inaccurate and misleading information may alter behav-
                                               iors and complicate crisis management and health responses. This paper addresses information
                                               diffusion during the COVID-19 pandemic period with a massive data analysis on YouTube. First,
                                               we analyze more than 2M users’ engagement in 13000 videos released by 68 different YouTube
                                               channels, with different political bias and fact-checking indexes. We then investigate the rela-
                                               tionship between each user’s political preference and her/his consumption of questionable/reliable
                                               information. Our results, quantified using information theory measures, provide evidence for the
                                               existence of echo chambers across two dimensions represented by the political bias and by the
                                               trustworthiness of information channels. Finally, we observe that the echo chamber structure
                                               cannot be reproduced after properly randomizing the users’ interaction patterns.
                                         Keywords: Infodemics, Social Media, Youtube, Misinformation

                                         1    Introduction
                                         The case of the COVID-19 pandemic made explicit the critical role of information diffusion during
                                         critical events. A relevant example was the massive amount of uncertain information shared by the
                                         media to justify the withdrawal of one AstraZeneca vaccine batch, which led to a dramatic lack of trust
                                         in it. At the very first stages of the COVID-19 pandemic, the World Health Organization (WHO)
                                         defined infodemics as “an overabundance of information - some accurate and some not - that occurs
                                         during an epidemic” [1]. Other definitions stressed the element of disinformation spreading rapidly
                                         through social media platforms and other outlets [2]. The information ecosystem radically changed
                                         with the advent of social media platforms as they implement algorithms and interaction schemes to
                                         maximize user engagement. Those algorithms account for users’ preferences and may significantly alter
                                         social dynamics and information diffusion [6].
                                             We need to understand how people seek or avoid information and how those decisions affect their
                                         behavior [3] when the news cycle — dominated by the disinter-mediated diffusion of content — signif-
                                         icantly alters how information is consumed and reported on.
                                             This corresponds to investigate what is called social contagion, i.e., the spread of ideas, attitudes,
                                         norms, or behavioral patterns from individual to individual through social influence, imitation, and
                                         conformity. Social contagion depends on users’ attitudes, tendencies, and intentionality. In general,
                                         users tend to select the information they like the most and ignore statements dissenting from their
                                         worldviews [7, 23]. Our attention span is limited [4, 5] and feed algorithms might limit our selection
                                         process by suggesting content similar to those we are usually exposed to [14, 15]. Furthermore, users
                                         show a tendency to favor information adhering to their beliefs and join groups formed around a shared
                                         narrative, that is, echo chambers [7, 16, 17, 18, 19, 20]. Echo chambers are environments in which
                                         users’ opinion, political leaning, or belief about a topic gets reinforced due to repeated interactions with
                                         peers or sources having similar tendencies and attitudes. Selective exposure [21] and confirmation bias

                                                                                               1
[22] (i.e., the tendency to seek information adhering to preexisting opinions) play a pivotal role in the
emergence of echo chambers on social media [7, 20, 23, 24]. In this work, we follow the definition of echo
chambers provided in [6] to understand the users’ attention patterns on YouTube during the COVID-
19 pandemic. According to some studies, YouTube is playing a prominent role in the radicalization
of opinions [10, 25, 26] and in the diffusion of questionable (i.e., poorly fact-checked) content being
one of the most visited online domain and information retrieval platforms. Our dataset contains 10M
comments relative to the videos published from 68 prominent information channels on YouTube in a
period ranging from December 2019 to September 2020.
In more detail, we analyze users engagement, in terms of comment posted by the users, on videos
produced by YouTube channels with a known political bias and fact-checking index. We then investi-
gate the relationship between users political preferences and their consumption of questionable/reliable
information. We start by introducing some preliminaries used throughout the article. Then, we explain
how we categorize YouTube channels in order to obtain their bias in the political dimension and their
reliability in terms of information produced and disseminated. Then, we investigate the relationship
between the users political preferences and their consumption of questionable/reliable information.
Finally, we analyze the relationship between the preferences of users with respect to those expressed
by other users connected to them in the social network finding that echo chambers exist on YouTube
across the political and fact-checking dimensions.
2 Related Works
The spread of misinformation and disinformation online is one of the most studied topics of the last
few years. In general, the issue has been investigated on multiple platforms, both mainstream ones
(e.g. Twitter) and niche ones (e.g. Gab) [7, 8, 9, 13].
A 2018 study [11] limited to Twitter claimed that fake news travels faster than real news. However,
a multitude of factors affects information spreading on social media platforms. Online polarization, for
instance, may foster misinformation spreading [7, 12]. The range of topics covered when investigating
the study of misinformation is also vast, including politics, science, and medicine, among other societal
issues. Very few studies investigated the problem of misinformation diffusion on YouTube and mostly
in recent times. Indeed, research on online social systems disregarded YouTube concerning other social
media platforms (such as Facebook or Twitter) despite its general use by the general audience [41].
Among the possible reasons for this underestimation (especially in the scientific literature), users’
potential anonymity (especially for what concerns comments below videos) and the impossibility to
retrieve friendship networks and, to some extent, interaction networks.
One of the main aims of scientific research concerning YouTube is devoted to understanding such
a platform’s role in exacerbating users’ opinions through its algorithm of video recommendations.
This strand of research was fueled by several news articles that were claiming the radicalizing role of
YouTube and its role in disinformation spreading [32, 33, 34]. However, despite the presence of an
algorithmic effect, that is common in many social media platforms [6], the role of YouTube in creating
rabbit holes, i.e., loops of extreme/questionable contents reinforced by the algorithm and by individual
choices in a sort of vicious circle, is still strongly disputed [35, 36, 37, 38, 39, 40]. Nonetheless, regardless
of the algorithmic bias, recent work found evidence of political polarization [13], hate [47] and echo-
chambers [10] on YouTube, thus confirming, to some extent, the fact that users tend to aggregate and
reinforce common opinions concerning polarizing topics.
Another relevant strand of research involving YouTube concerns its role in the diffusion of health-
related information and the consequences that disinformation may pose for people’s health. The
medical community has therefore conducted several studies on relevant topics such as vaccines [44],
cancer [45] and also COVID-19 [42, 43]. However, such studies suffer from limitations related to shallow
volumes of analyzed data, which is very limited in providing a detailed picture of online information
consumption patterns. Differently, a recent work [15] investigated the problem of the infodemic (at its
early stage), including YouTube among other platforms using a representative sample of 7M comments,
finding that YouTube amplifies questionable sources less than the other mainstream platforms.
So far, no studies have provided evidence about echo chambers on YouTube concerning medical
issues and especially about the COVID-19 pandemic.
23 Preliminaries and Definitions
In this section, we introduce our dataset and some operational definitions used in the analysis.
3.1 Dataset
We consider more than 10M comments of more than 2M users on 13000 videos published by 68
YouTube channels directly linked to news outlets. Table 1 contains a breakdown of the dataset. We
collected videos using the official YouTube Data API, searching for videos that matched a list of
keywords, including the terms (coronavirus, nCov, corona virus, corona-virus, covid or SARS-CoV ).
An in-depth search was then performed by crawling the network of related videos as provided by the
YouTube algorithm. We filtered the videos that matched our set of keywords in the title or description
from the gathered collection. Finally, we collected the comments received by those videos.
Users Videos Channels Comments Period (y/m/d)
2092817 12933 68 10968002 2019/12/2 - 2020/9/5
Table 1: Data breakdown of the dataset.
Using the data provided by Media-Bias-Fact-Check (MBFC), an independent fact checking agency,
we assigned a Political leaning index and a Fact-checking index to each YouTube channel. MBFC
provides such indexes for news outlets and we assume that they are inherited by their official YouTube
channels. The first index provides a score for the channel’s bias in the political dimension (i.e., its
political leaning), while the second represents the factual reporting level of the news published from
it. For instance, considering the YouTube channel of Breitbart (a popular far-right news outlet),
MBFC assigns to it a political leaning corresponding to Extreme right and a Factual reporting index
corresponding to Mixed. Specifically, we assign the values reported in Table 2 and Table 3.
Label Extreme left Left Left-center Center Left-right Right Extreme right
Political leaning -1 − 23 − 31 0 1
3
2
3 1
Table 2: Political bias indexes associated to each channel using MBFC.
Factual reporting Very low Low Mixed Mostly factual High Very high
Fact-checking 0 0.2 0.4 0.6 0.8 1
Table 3: Fact-checking indexes associated to each channel trough MBFC.
In Figure 1 displays some general features of our dataset.
3.2 Methods
An echo chamber can be defined as an environment made up of users sharing a similar opinion, belief,
or political leaning. The views of each user get reinforced due to the repeated interactions with users
sharing the same ideas. We quantify the strength of the preferences of YouTube users by means of
their engagement (specifically their comments) on videos. Consider a user i commenting a number
ni of videos, each of them having a particular political leaning bi inherited by the channel that has
published it. We define the political bias of user i as
ni
1 X
pi ≡ bj . (1)
ni j=1
This index represents an average of the channel’s political leanings on which user i comments and
therefore provides information about the user’s political preference/bias.
3(a) (b)
1.00 1.00
Political bias
Factual reporting
0.75 Extreme left 0.75
Very low
Left
Low
Left−center
0.50 0.50 Mixed
Center
Mostly factual
Right−center
High
0.25 Right 0.25
Very high
Extreme right
0.00 0.00
Channels Comments Videos Channels Comments Videos
(c) (d)
2.0
0.4
1.5
0.3
Density
Density
1.0
0.2
0.5 0.1
0.0 0.0
10 100 1000 1 10 100 1000
Number of comments Number of videos
Figure 1: (a) statistics about the political bias of the channels, (b) statistics about the factual re-
porting of the channels, (c) density of comments per user (only users with at least 10 comments were
considered), (d) density of videos per channel.
Similarly, each video has a fact-checking index fi inherited by the channel that has published it.
Therefore, we define the persistence index of user i as
ni
1 X
ci ≡ fj (2)
ni j=1
Also (2) has an interpretation similar to the previous one. In particular it is an average of the
channel’s fact-checking indexes on which user i comments and therefore gives information about the
user’s persistency in commenting videos characterized by a certain trustworthiness. Finally, note that
pi ∈ [−1, 1], while ci ∈ [0, 1].
To study the relationship between the two indexes pi and ci , we constructed a bipartite network
G users/channels in which two nodes i, j are connected if and only if the user i commented at least
one video published from the channel j. We decided to follow the network approach since it allows
us to introduce relational indexes and study the social dynamics typical of social networks, such as
YouTube.
4 Experiments
In this section we employ what previously introduced to investigate the relationship between the
two indexes, pi and ci . Since it has been reported a link between the political leaning of users and
their tendency to consume high/low fact-checking news [31], we compare the political leaning and the
persistence index of each user to verify if a relation exists. Then, we try to detect echo chambers using
the topology of G while characterizing the relationship between users using the two indexes of political
bias and factual reporting.
44.1 Relation between political bias and persistence
A relation between users’ political bias and their tendency to consume pro vs. anti-science news has
been reported in Twitter [31]. To verify if a similar relation was present on YouTube during the
COVID-19 pandemic, we constructed a 2D-density plot confronting the political bias and each user’s
persistency index. In particular, to obtain Figure 2, we decided to consider the users with at least ten
comments to improve the plot’s visibility.
Figure 2: Relation between the political bias of users with at least 10 comments and their persistence
index. It is clear that the users with a leaning far from the center tend to consume information from
less fact-checked source. In particular, users with a Left leaning have more than one behaviour: a
part of them consume more fact-checked news, while the others tend to get information through less
reliable channels.
Figure 2 shows the results, in which we may note that the users with political leaning far from
the center tend to consume less fact-checked news. Interestingly, users with a political leaning skewed
towards Left display more than one behavior with a minor part of them having a higher persistency
score. Simultaneously, the majority shows lower values of it, indicating that Left political leaning users
consume, in a somewhat segregated manner, information from both reliable and questionable sources.
4.2 Echo Chambers
The echo chamber concept translates into a topology property of the users’ network, in which a user
i (with a given pi and ci ) is surrounded by users with similar index values. Those concepts can
be quantified by defining, for each user i, the average political leaning and persistence index of its
neighbors:
1 X
pN
i = Aij pj (3)
ki j
1 X
cN
i = Aij cj (4)
ki j
where ki is the degree of node i and Aij is the adjacency matrix of the users bipartite projection
obtained from G. Specifically, Aij = 1 if and only if user i and user j commented at least one common
video.
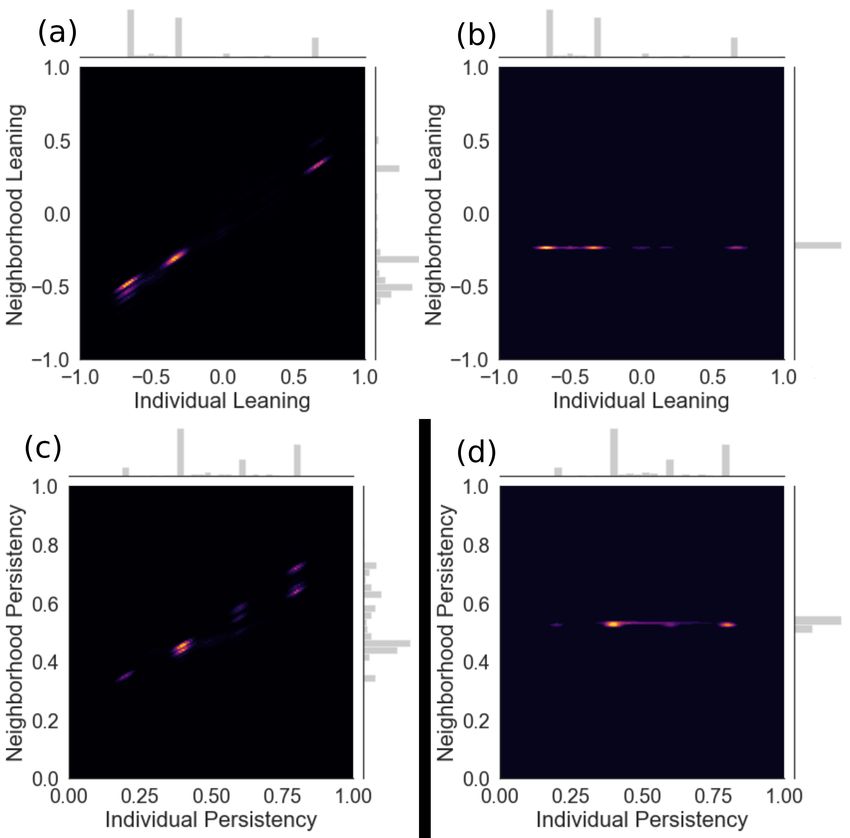
5Figure 3: (a) relation between the political bias of users and the average political bias of their neigh-
borhood. (c) relation between the persistence index of users and the average persistence of their
neighborhood. (b) and (d) are obtained in the same fashion of (a) and (c) but in a randomized
network. Plots (a)-(c) clearly shows the presence of echo-chambers from both the political and the
questionable/reliable dimension. Plots (b)-(d) confirm that echo-chambers don’t arise from random
behaviour.
6Figure 3 shows the results of the analysis. The color represents the density of users: the lighter,
the larger the number of users. The plots (a), (c) show clearly the presence of echo chambers in the
political dimension and the fact-checking dimension. To understand if echo chambers represent a
peculiar feature of the empirical network that we are taking into account, we randomized the links
of the initial bipartite network [46], employed to obtained the co-commenting network, with 2 × 10⁸
iterations and performed the same analysis on the randomized user network. The results are shown
in (b), (d) of Figure 3, in which we may note that the echo chamber effect disappears. In particular,
users with a specific value of pi and ci have contact with users with different values of those indexes
thus resulting in a distribution with little variation on the y axis.
To give a quantitative description of our results, we compute the joint entropy of the distributions
shown in Figure 3. The joint entropy for two discrete random variables is a measure associated with
their degree of uncertainty. Consider two random variables X, Y . The joint entropy is defined as
XX
H(X, Y ) = − P (x, y) log2 (P (x, y)). (5)
x∈X y∈Y
where X is the range of X, Y is the range of Y and P (x, y) is the joint probability of those values.
If P (x, y) = 0 we assume that also P (x, y) log2 (P (x, y)) = 0.
The interpretation of (5) relies on the concept of information content: entropy measures the average
amount of information carried by the outcome of a trial to predict future outcomes and how “surprising”
the outcome is. The distribution with the highest entropy is the uniform distribution, since there is no
way to predict the future outcomes and it assumes the value log2 (n), where n is the number of possible
couple (x, y). On the other hand, the distribution with the lowest entropy value (H(X, Y ) = 0) is
P (x, y) = δ(x0 , y0 ), since it is possible to predict exactly what the next outcome is.
We computed (5) for the joint distributions showed in Figure 3, comparing them with their random
counterparts. To compute the joint probability we employed a quantization of the space using a grid
with steps of 0.01 used to sampling the frequencies of the distributions. We created a matrix of
frequencies for each distribution. Since pi ∈ [−1, 1] and ci ∈ [0, 1] the matrices corresponding to the
political distribution had size 200 × 200, while the matrices relative to the persistency distribution had
size 100 × 100. The values were then normalized by their maximum value log2 (n). The results are
showed in Table 4 and Table 5.
H(X, Y )
Political bias 0.3863
Random political bias 0.2914
Table 4: Joint entropy computed for the distributions in Figure 3 (a)-(b).
H(X, Y )
Persistency 0.4297
Random persistency 0.3338
Table 5: Joint entropy computed for the distributions in Figure 3 (c)-(d).
The computed values show that the random counterparts of the real distributions have lower values
of entropy. Therefore, the echo-chamber behavior is more unexpected than their random counterpart.
This can be explained by noticing that the randomization process leads to distributions centered
(approximately) in one point, resulting in a reduced entropy.
5 Conclusions
This paper addresses information diffusion during the COVID-19 pandemic period with massive data
analysis on YouTube. First, we analyze more than 2M users’ engagement in 13000 videos released
by 68 different YouTube channels, with different political bias and fact-checking indexes. We then
investigate the relationship between each user’s political preference and her/his consumption of ques-
tionable/reliable information. Our findings show that, during the COVID-19 pandemic, echo chambers
7exist on YouTube across the political and the fact-checking dimensions. Furthermore, a substantial
difference between the echo chambers behaviour and the random behaviour has been highlighted.
References
[1] WHO Situation Report 13. https://www.who.int/docs/default-source/coronaviruse/situation-
reports/20200202-sitrep-13-ncov-v3.pdf?sfvrsn=195f4010 6
[2] Zarocostas, J. How to fight an infodemic. Lancet 395, 676 (2020).
[3] Sharot, T., Sunstein, C. R. How people decide what they want to know. Nat. Hum. Behav. 2020,
1–6 (2020).
[4] Andrea Baronchelli. The emergence of consensus: a primer. Royal Society open science,
5(2):172189, 2018.
[5] Matteo Cinelli, Emanuele Brugnoli, Ana Lucia Schmidt, Fabiana Zollo, Walter Quattrociocchi,
and Antonio Scala. Selective exposure shapes the facebook news diet. PloS one, 15(3):e0229129,
2020.
[6] Matteo Cinelli, Gianmarco De Francisci Morales, Alessandro Galeazzi, Walter Quattrociocchi,
Michele Starnini The echo chamber effect on social media. Proceedings of the National Academy
of Sciences Mar 2021, 118 (9) e2023301118; DOI: 10.1073/pnas.2023301118
[7] Michela Del Vicario, Alessandro Bessi, Fabiana Zollo, Fabio Petroni, Antonio Scala, Guido
Caldarelli, H. Eugene Stanley, Walter Quattrociocchi. The spreading of misinformation on-
line. Proceedings of the National Academy of Sciences Jan 2016, 113 (3) 554-559; DOI:
10.1073/pnas.1517441113
[8] Lazer et al., The science of fake news. Science Vol. 359, Issue 6380, pp. 1094-1096 (2018).
[9] Bovet, A., Makse, H.A. Influence of fake news in Twitter during the 2016 US presidential election.
Nat Commun 10, 7 (2019). https://doi.org/10.1038/s41467-018-07761-2.
[10] Homa Hosseinmardi and Amir Ghasemian and Aaron Clauset and David M. Rothschild and
Markus Mobius and Duncan J. Watts. Evaluating the scale, growth, and origins of right-wing
echo chambers on YouTube, 2020, arXiv, cs.SI.
[11] S. Vosoughi, D. Roy, S. Aral, The spread of true and false news online. Science 359, 1146–1151
(2018).
[12] M. D. Vicario, W. Quattrociocchi, A. Scala, F. Zollo, Polarization and fake news: Early warning
of potential misinformation targets. ACM Trans. Web 13, 1–22 (2019).
[13] Bessi A, Zollo F, Del Vicario M, Puliga M, Scala A, et al. (2016) Users Polarization on Facebook
and Youtube. PLOS ONE 11(8): e0159641. https://doi.org/10.1371/journal.pone.0159641
[14] Ana Luciá Schmidt, Fabiana Zollo, Michela Del Vicario, Alessandro Bessi, Antonio Scala, Guido
Caldarelli, H Eugene Stanley, and Walter Quattrociocchi. Anatomy of news consumption on
facebook. Proceedings of the National Academy of Sciences, 114(12):3035–3039, 2017.
[15] Cinelli, M., Quattrociocchi, W., Galeazzi, A. et al. The COVID-19 social media infodemic. Sci
Rep 10, 16598 (2020). https://doi.org/10.1038/s41598-020-73510-5
[16] K. H. Jamieson, J. N. Cappella, Echo Chamber: Rush Limbaugh and the Conservative Media
Establishment (Oxford University Press, 2008).
[17] P. A. Champin, F. Gandon, L. Médini K. Garimella, G. De Francisci Morales, A. Gionis, M.
Mathioudakis, “Political discourse on social media: Echo chambers, gatekeepers, and the price
of bipartisanship” in Proceedings of the 2018 World Wide Web Conference, WWW ’18, P. A.
Champin, F. Gandon, L. Médini, Eds. (International World Wide Web Conferences Steering
Committee, Geneva, Switzerland, 2018), pp. 913–922.
8[18] R. K. Garrett, Echo chambers online?: Politically motivated selective exposure among Internet
news users. J. Comput. Mediated Commun. 14, 265–285 (2009).
[19] W. Cota, S. C. Ferreira, R. Pastor-Satorras, M. Starnini, Quantifying echo chamber effects in
information spreading over political communication networks. EPJ Data Sci. 8, 35 (2019).
[20] K. Garimella, G. De Francisci Morales, A. Gionis, M. Mathioudakis, “The effect of collective
attention on controversial debates on social media” in WebSci ’17: 9th International ACM Web
Science Conference (Association for Computing Machinery, New York, NY, 2017), pp. 43–52.
[21] J. T. Klapper, The Effects of Mass Communication (Free Press, 1960).
[22] R. S. Nickerson, Confirmation bias: A ubiquitous phenomenon in many guises. Rev. Gen. Psychol.
2, 175–220
[23] M. Del Vicario et al., Echo chambers: Emotional contagion and group polarization on Facebook.
Sci. Rep. 6, 37825 (2016).
[24] A. Bessi et al., Science vs conspiracy: Collective narratives in the age of misinformation. PloS
One 10, e0118093 (2015).
[25] T. Konitzer, J. Allen, S. Eckman, B. Howland, M. M. Mobius, D. M. Rothschild, and D. Watts,
Comparing Estimates of News Consumption from Survey and Passively collected Behavioral Data
(2020).
[26] Statista, “Number of YouTube viewers in the United States from 2018 to 2022,”
https://www.statista.com/statistics/469152/ number-youtube-viewers-united-states/ (2019).
[27] S. Clark and A. Zaitsev, Understanding YouTube Communities via Subscription-based Channel
Embeddings. arXiv preprint arXiv:2010.09892 (2020).
[28] Zeynep Tufekci, “Youtube, the great radicalizer,” https://www.nytimes.com/2018/03/10/opinion/
sunday/youtube-politics-radical.html (2017).
[29] Tom Whyman, “Why the right is dominating YouTube.”
https://www.vice.com/en us/article/3dy7vb/ why-the-right-is-dominating-youtube (2017).
[30] ames Bridle, “Something is wrong on the internet,” something-is-wrong-on-the-internet-
c39c471271d2 (2017)
[31] Ashwin Rao, Fred Morstatter, Minda Hu, Emily Chen, Keith Burghardt, Emilio Ferrara, Kristina
Lerman. Political Partisanship and Anti-Science Attitudes in Online Discussions about Covid-19.
arXiv:2011.08498 [cs.SI].
[32] Zeynep Tufekci, “Youtube, the great radicalizer”, https://www.nytimes.com/2018/03/10/opinion/sunday/youtube-
politics-radical.html, (2017).
[33] Tom Whyman, “Why the right is dominating YouTube.”, , (2017).
[34] Kevin Roose, “The making of a YouTube radical”, https://www.nytimes.com/interactive/2019/06/08/
technology/youtube-radical.html, (2019).
[35] Ribeiro, M. H., Ottoni, R., West, R., Almeida, V. A., & Meira Jr, W. (2020, January). Au-
diting radicalization pathways on YouTube. In Proceedings of the 2020 conference on fairness,
accountability, and transparency (pp. 131-141).
[36] Cho, J., Ahmed, S., Hilbert, M., Liu, B., & Luu, J. (2020). Do search algorithms endanger
democracy? an experimental investigation of algorithm effects on political polarization. Journal
of Broadcasting & Electronic Media, 64(2), 150-172.
[37] Munger, K., & Phillips, J. (2020). Right-Wing YouTube: A Supply and Demand Perspective. The
International Journal of Press/Politics, 1940161220964767.
9[38] Ledwich, M., & Zaitsev, A. (2020). Algorithmic extremism: Examining YouTube’s rabbit hole of
radicalization. First Monday.
[39] Faddoul, M., Chaslot, G., & Farid, H. (2020). A Longitudinal Analysis of YouTube’s Promotion
of Conspiracy Videos. arXiv preprint arXiv:2003.03318.
[40] Feezell, J. T., Wagner, J. K., & Conroy, M. (2021). Exploring the effects of algorithm-driven news
sources on political behavior and polarization. Computers in Human Behavior, 116, 106626.
[41] Perrin, Andrew, Anderson, Monica. 2019. Social Media Use in 2019. Washington, D.C.: Pew
Research Center.
[42] Li, H. O. Y., Bailey, A., Huynh, D., & Chan, J. (2020). YouTube as a source of information on
COVID-19: a pandemic of misinformation?. BMJ global health, 5(5), e002604.
[43] Puri, N., Coomes, E. A., Haghbayan, H., & Gunaratne, K. (2020). Social media and vaccine hesi-
tancy: new updates for the era of COVID-19 and globalized infectious diseases. Human Vaccines
& Immunotherapeutics, 1-8.
[44] Donzelli, G., Palomba, G., Federigi, I., Aquino, F., Cioni, L., Verani, M., ... & Lopalco, P. (2018).
Misinformation on vaccination: A quantitative analysis of YouTube videos. Human vaccines &
immunotherapeutics, 14(7), 1654-1659.
[45] Loeb, S., Sengupta, S., Butaney, M., Macaluso Jr, J. N., Czarniecki, S. W., Robbins, R., ...
& Langford, A. (2019). Dissemination of misinformative and biased information about prostate
cancer on YouTube. European urology, 75(4), 564-567.
[46] Maslov, S., & Sneppen, K. (2002). Specificity and stability in topology of protein networks. Science,
296(5569), 910-913.
[47] Cinelli, M., Pelicon, A., Mozetič, I., Quattrociocchi, W., Novak, P. K., & Zollo, F. (2021).
Online Hate: Behavioural Dynamics and Relationship with Misinformation. arXiv preprint
arXiv:2105.14005.
10You can also read