"Smarter Lithuania - Innovative and Smart Economic Transformation": EU investments in 2021- 2027
←
→
Page content transcription
If your browser does not render page correctly, please read the page content below
„Smarter Lithuania – Innovative and Smart
               Economic Transformation“:
             EU investments in 2021- 2027
Jekaterina Rojaka
Vice-Minister
June 27th, 2019
Malta

                                                                                                                                                               6,6
                           Poland

                                                                                                              5,4

Source: Eurostat
                         Hungary

                                                                                                        4,9
                            Latvia
                                                                                                       4,8
                         Slovenia                                                                4,5

                         Romania
                                                                                           4,1

                         Slovakia
                                                                                           4,1

                          Estonia
                                                                                         3,9

                          Cyprus
                                                                                         3,9

                         Lithuania
                                                                                   3,4

                         Bulgaria
                                                                             3,1

                         Czechia
                                                                            3,0

                           Austria
                                                                      2,7

                          Croatia
                                                                     2,6

                            Spain
                                                                   2,5

                      Netherlands
                                                                   2,5

                         Sweden
                                                               2,3
                                                                                                                    Real GDP in 2018, annual change, percent

                         Portugal
                                                             2,1

                          Greece
                                                        1,9
                                                                                                                                                                     In 2018, Lithuania demostrated strong growth

                        Euro area
                                                       1,8

                           France
                                                 1,5

                         Belgium
                                             1,4

                        Germany
                                             1,4

                   United Kingdom
                                             1,4

                         Denmark
                                           1,2

2

                             Italy
                                     0,9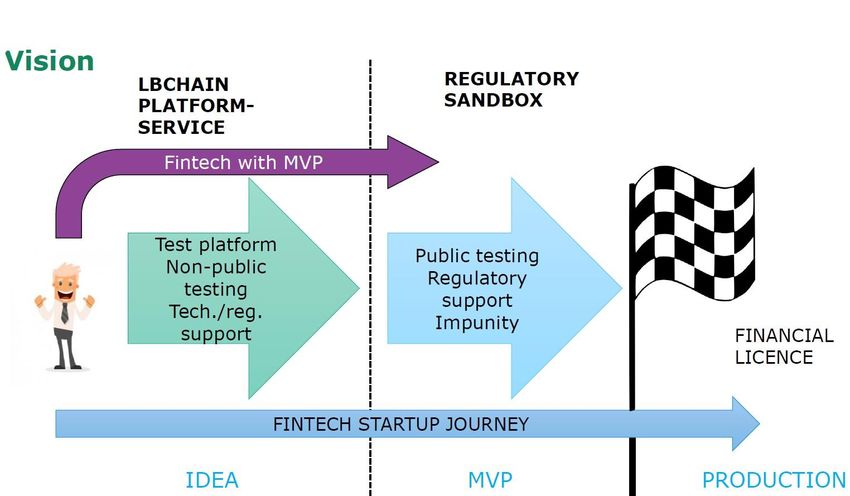
However, Lithuania still lags behind EU by
  productivity

                                 Labour productivity per person employed and hour worked in 2017, EU28=100                                                     189,2

                                                                                                                                                           160,2

                                                                                                                                                  129,1129,9
                                                                                                                                             116,8
                                                                                                                         110,9112,1115,1115,1
                                                                                              101,5   106 106,6 107 108,7
                                                                                95,8 99,8 100

                                              76,4   80,4 80,8 80,9 81,1 84,3
                          71,7 74,7 75,4 75,8
           65,2 67,9 68
    46,7

Source: Eurostat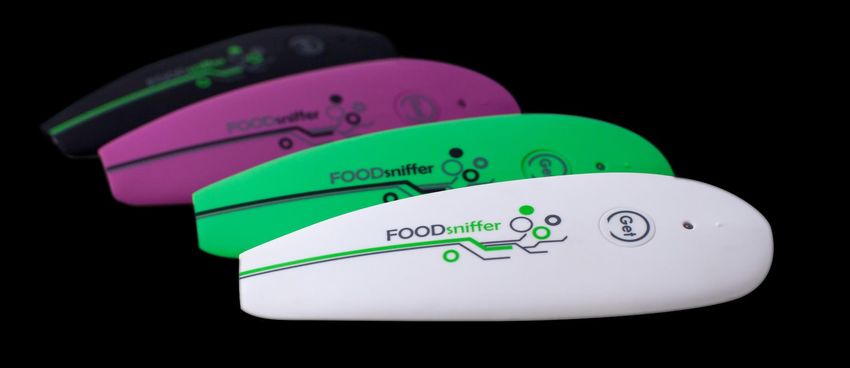
MANUFACTURING HAS BIG IMPACT ON
  ECONOMY, BUT LACKS INNOVATION
   Summary of benchmark analysis (deviation from indicator average, %)
                                                                                        Belgium
                                Manufacturing: share                                    Denmark
                                      in GDP
                                      60                                                Germany
                                      40
                                                                                        Netherlands
                                      20
                                       0                       Share of medium-high-    Finland
 Manufacturing: labor
                                     -20                        tech sectors in total
    productivity                                                                        Sweden
                                     -40                           manufacturing
                                     -60                                                Lithuania
                                     -80
                                    -100

Manufacturing: wages                                           Turnover per person
   and salaries                                                     employed

                               Share of employees in
                               manufacturing sector
                                in total employment
  Source: Lithuanian Industry Digitization Roadmap 2019-2030

Lithuania has improved its digital score over 2014-
    2019
                                                  Digital Economy and Society Index, 2014

Source: European Commission, Digital Scoreboard
Lithuania has improved its digital score over 2014-
    2019
                                                  Digital Economy and Society Index, 2019

Source: European Commission, Digital Scoreboard
Lithuania is less advanced in enabling digital tools

       SME                    Analysing big data Cloud computing services     Selling online          Paying to advertise online

                                                                         35                      21                              32
       Digital Frontrunners                     13

        Digital Challengers               9               13                           14                              24

                  Lithuania                    12              16                                22                              32

      LARGE
                                                                         63                           43                         43
         Digital Frontrunners                        37

          Digital Challengers             22                    31                          31                          34

                    Lithuania            20                         34                      29                              38

 Source: Eurostat, McKinsey
Worsening demographic situation urges for policy changes
                           Population by age

                                 96
                                 92
                                                                       • Population number in 2000
                                 88
                                 84
                                 80
                                 76
                                                                                3 512 074
                                 72
                                 68
                                 64
                                 60
                                 56
                                 52
                                                                       • Employed in 2000
                                 48
                                 44
                                 40
                                 36
                                 32
                                 28
                                                                                2 296 995
                                 24
                                 20
                                 16
                                                                        or 65,4 percent
                                 12
                                  8
 2000                             4
                                                                2000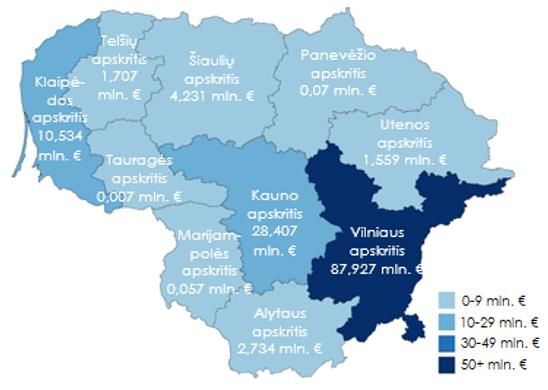
Worsening demographic situation urges for policy changes
                        Population by age

                                 96
                                 92
                                                                          • Population number in 2015
                                 88
                                 84
                                 80
                                 76
                                                                                    2 921 262
                                 72
                                 68
                                 64

                                                                          • Employed in 2015
                                 60

  2015
                                 56
                                 52                         2015
                                 48
                                 44
                                 40
                                 36
                                 32
                                 28
                                                                                    1 950 322
                                                                          Or 66,8 percent
                                 24
                                 20
                                 16
                                 12
 2000                             8
                                  4
                                                                   2000
Worsening demographic situation urges for policy changes
Population by age
96
92
• Population number in 2020
88
84
80
76
2 671 108
72
2020 68
64
2020
• Employed in 2020
60
2015
56
52 2015
48
44
40
36
32
28
1 724 428
Or 64,6 percent
24
20
16
12
2000 8
4
2000Worsening demographic situation urges for policy changes
Population by age
2050 96
92
2050 • Population number in 2050
88
84
80
76
1 910 327
72
2020 68
64
2020
• Employed in 2050
60
2015
56
52 2015
48
44
40
36
32
28
1 050 480
or 55 percent
24
20
16
12
2000 8
4
2000Recent international migration data is encouraging
International migration in Lithuania, thou
28,9 +59%
22,0 24,3 22,1
19,8 20,2 20,4 18,9
15,7
6,8 7,7 8,6 9,3
5,6 6,5 5,2
-16,0
-30,4 -25,8
-37,7 -32,4 -36,6 -32,2
-38,5 -41,1 -38,8
-44,5 -47,9
-53,9 -50,3
-57,9
-83,2
-88%
Emigrants Immigrants Immigrants LT
2004 2005 2006 2007 2008 2009 2010 2011 2012 2013 2014 2015 2016 2017 2018 2019 I-V
Source: OSP, EIM 13Higher
Higher Average Higher
GDP Wage growth of
growth Exports
• Better chances to
survive the Valley
Increase in
the number of THE of Death
innovative INNOVATION • Lithuania’s leap
companies
REFORM in global and EU
innovation
indexesSTI SYSTEM Increase of RDI oriented FDI:
REFORM: OUTCOMES • Attractive landscape and policy for more R&D
oriented FDI
• Attracted top talent in RDI field
• More expertise and expert involvement in all
stages of innovation
• Increase of breakthrough and disruptive
innovations
Unified STI policy:
• Adjusted strategic governance of STI area
and policy coordination
• Clearly defined areas of responsibility for
STI policy making
• Consolidated functions of STI policy
implementation in one responsible agency
• Elected STI policy leader Effective innovation support
• Common understanding of RDI activities system:
• New Law on Technology and Innovation • Improved financial motivation system for RDI
• Long term STI strategy activities
• Updated and optimized areas and • Unified assessment and evaluation system of
priorities of S3 RDI activities
• More focus on experimental development and
innovationSPENDING VS IMPACT
OF R&D ON INNOVATION
Public spending on R&D, % of GDP
0,665
0,700 0,619
0,607
0,600 0,561 0,549
512 679 0,500
0,400
0,434 0,422 0,445
mil. EUR mil. EUR
0,300
2007-2013 2014-2020
0,200
0,100
0,000
SPENDING
2011 2012 2013 2014 2015 2016 2017 2018
ES LT
• Public spending on R&D in Lithuania is similar
28th to the EU average
According to
RDI • However, by utilization of R&D spending,
IMPACT
economic Lithuania is among the outsiders.
impact
2016*
*Source: EU Innovation Scoreboard 2017TURNOVER FROM NEW PRODUCTS
BUSINESS SPENDING
2012 2014 2016 ON INNOVATION
New to the Mil. EUR
1400 1274,6
company products 1.5 2.45 5.12
1200 1089,3
New to the market
products 0.92 1.32 1.49 1000
800 638,3
TOTAL, bil EUR 2.4 3.77 6.6 600
Income from the
400
200
commercialization of 0
new products,
2012 2014 2016
!
mil EUR (2016)
[VALUE]
Higher education & public sector 5.5 mil EUR
Lithuanian companies 6.6 bil EUR
0 1000 2000 3000 4000 5000 6000SHIFTING RDI PARADIGM
30% 30%
D&I R
R 70% D&I 70%TOWARDS THE SMARTER ECONOMY
Reform basis:
THE LAW ON
TECHNOLOGY & Revision of
INNOVATION innovation
support
system
Attraction of
R&D oriented
FDI Revision of
STI system
Result:
INNOVATION AS THE
BACKBONE OF
LITHUANIAN ECONOMYKEY 3 ELEMENTS OF
INNOVATION REFORM
Revision of innovation
support system • One ministry in charge of
technology & innovation
policy
Attraction of R&D
oriented FDI • One agency
• Update of S3 strategy
Revision of STI
systemKEY 3 ELEMENTS OF
INNOVATION REFORM
• Using EU SF to create
innovative products/services
Revision of • Creating infrastructure
innovation necessary for experimental
development
support system • Creating the framework for
Attraction of R&D
oriented FDI innovation development
infrastructure
• Involving technology scouts
• Motivating scientists to
Revision of STI cooperate with businesses
system
• Developing the framework of
consulting servicesKEY 3 ELEMENTS OF
INNOVATION REFORM
Revision of innovation
support system
• Attraction of R&D oriented
FDI
• Participation of experts in
Attraction of the realization processes
of innovations
R&D oriented • Talent attraction in RDI
Revision of STI
FDI system fieldTHE CORE OF THE REFORM
Innovation Support
Financial support Fund
THE LAW ON
TECHNOLOGY AND
INNOVATION
One Innovation
Clear concept of STI Agency
system
Embeded model of Defined responsibilities and
the cyclic innovation clear areas of governanceACHIEVMENTS
The Law on Empowered Evaluation of Economic
the impact of Update of
technology and RDI Council diplomacy
EU VP1 priority S3
innovation map of RDI
• Evidence-based • Investment
• Clear leadership • Holistic attitude • Evidence
analysis policy sustainability and
and towards the based analysis
making continuity are
responsibilities formation and for international
• Analysis of the ensured
in the STI field implementation co-creation
impact of existing
• Strengths • Effective project
• Efficient of the STI policy interventions selection
innovation • Valuable • Basis for an
identified
• Lithuania‘s procedures
support expertise and efficient and
interests • Reducing the
experience targeted
abroad administrative
preparation for burden
• Networking of
the challenges of
Lithuanian
the new 2021–
ambassies
2027 financing
intensifiedUPCOMING TO-DO LIST
Establishment of One Improvements of the
Innovation Boosting of Innovative
Innovation Support operating model of
Agency public procurement
Fund governmental
research institutes
• Venture capital, • Optimisation of the • Strengtening • Demand-oriented
loans and STI agencies network experimental innovation policy
guarantees to • Strengthening development part in instrument
innovative strategic capacities the innovation cycle • Improvement of public
businesses • Consolidation of the • Transfer knowledge service effectiveness
• Sustainable source programmes and to business and efficiency
for innovation facilities • Enhance demand for • Support to start-ups
support research and and innovative business
technology to launch and growWhy one agency?
RDI system is
fragmented,
complicated and
does not meet
business needs
26Recommendations: to consolidate institutions in order to more
efficiently implement R&I policy
Research and Innovation Observatory (RIO) experts in assessing Lithuania's research and innovation
system draw attention to highly fragmented policy priorities of the Lithuanian RDI system, strategic level
programs, funding and low interinstitutional cooperation. Experts emphasize the need to consolidate the
efforts and resources of state institutions to achieve their purposeful use for the implementation of
R&I policy.
Organisation for Economic Co-operation and Development (OECD) also highlights the fragmentation and lack of
coordination of Lithuanian RDI policy. OECD experts recommend reviewing and consolidating all strategic-
level R&D programs, preparing and implementing institutional reform of RDI policy implementation,
including consolidate agencies and their programs. The experts propose to choose from two consolidation
principles: (1) Aggregate the agencies according to the similarities and complementarity of the existing functions,
or (2) Aggregate the agencies according to the similarities and complementarity of target groups of beneficiaries.
IMF discussions with Lithuania under Article IV of the Agreement states that there are many institutions in
Lithuania with advisory and implementing functions and subordinate to the Government, the Seimas, the
Ministry of Finance, the Ministry of Education and Science and the Ministry of Economy. The report points
out that there is a lack of effective coordination between the institutions, which increases their
maintenance costs and makes it difficult to use the entire STI system. IMF experts offer to merge all
institutions that are dedicated to promoting innovation to a single institution, and the institutions
responsible for the implementation of studies and fundamental research policies – to another one.
EC recommendations on the 2019 National Reform Programme, Stability Programme: 3. Focus investment-
related economic policy on innovation, energy and resource efficiency, sustainable transport and energy
interconnections, taking into account regional disparities. Stimulate productivity growth by improving the
efficiency of public investment. Develop a coherent policy framework to support science-business
cooperation and consolidate research and innovation implementing agenciesInnovation agency: one stop-shop for business
Customer Service , information and
consultancy
Pro-active search for the new customers
The twin derivative is two entities
Think tank, recommendations for
policy-makers
Financial support
administration
Financial instruments and
fonds2019 2020 Action plan
06 07 08 09 10 11 12 01 02 03 04 05 06 07 08 09 10 11 12
MITA re-organistion, disconnect from ŠMSM
Harmonisation of IT systems, single CRS
Real Estate
IA Statutes, structure and legislative procedures
Įmplementation of the chosen merge model
Registering the agency in the Register of Legal Entities
Internal communication
Preparation for initial reorganization actions (HR, hirings, facilities, etc.)
Gov. Gov. Approval of the action plan for the mergering business support institutions in one Agency
approval
Rebranding
Report Consultancy; two working groupsBackground publications for 2021-2027 EU
investments in Lithuania
• Country Report Lithuania 2019;
• OECD Economic Surveys - Lithuania 2018;
• National progress programme (project);
• Evaluation on Lithuanian economic sectors finance post 2020;
• Ongoing impact evaluation on 1 priority axis (RDI);
• Ongoing impact evaluation on 3 priority axis (business sector).Partnership in investments planning process for 2021-
2027
Objective Data Participants
1.1 Research and 09/05/2019 Public institutions, business associations, etc.
innovation, advanced
technologies
1.2 Digitisation 15/05/2019
1.3 Growth and 04/04/2019
Competitiveness of SMEs
1.4 Skills for Smart 09/05/2019
Specialisation, Industrial
Transition and
EntrepreneurshipAnnual increase in GDP, compared to the scenario without the EU
investments
1,4 1,30
1,26 1,29
1,2 1,15 1,13 1,11
1
Impact on GDP, p.p.
0,83 0,86 0,81
0,8 0,76 0,75
0,69
0,6 0,56 0,52
0,51 0,52
0,46 0,46 0,48 0,47
0,42 0,43 0,43 0,41
0,38 0,39 0,38 0,37 0,36
0,4 0,33 0,31 0,30
0,28 0,27 0,26 0,25
0,21 0,25 0,24 0,23 0,23 0,23 0,22
0,19 0,17 0,15
0,2 0,14 0,15 0,14 0,13
0,00 0,00 0,00 0,00 0,00 0,00 0,02
0
2006 2007 2008 2009 2010 2011 2012 2013 2014 2015 2016 2017 2018 2019 2020 2021 2022 2023 2024 2025 2026 2027 2028 2029 2030
2007-2013 2014-2020 Abu paketai
both
HERLIT macroeconomic model was the theoretical basis of the evaluation. In the national and EU practice of public policy analysis
macroeconomic models are one of the most recognized instruments for the impact evaluation of the Programmes’ investments. HERMIN
macroeconomic modelling system is designed to analyse and evaluate medium and long-term impact of the state interventions. These
models are used in evaluations commissioned by the European Commission and the European Parliament.
Source: HERLIT-16, Ministry of the Economy and InnovationModel confirms 0,56 p.p. increase in GDP and 5,9 thousand
additional jobs created due to EU investments in 2020
0,7
Annual increase in GDP and employment, compared to the scenario without the EU investments, p.p.
0,6
0,52
0,56 0,48
0,52
0,5 0,43
0,4 0,42
p.p.
0,3
0,21
0,19 0,17
0,2 0,15
0,15 0,14 0,13
0,14
0,1
0,02
00,00 0,00 0,00
2013 2014 2015 2016 2017 2018 2019 2020 2021 2022 2023 2024 2025 2026 2027 2028 2029 2030
Impact on Employment, % Impact on GDP, %
Source: HERLIT-16, Ministry of the Economy and Innovation1st Policy Objective
A Smarter LITHUANIA – Innovative
and Smart Economic
Research and Innovation
TransformationReturn on investment: on average additional value added created
by projects exceeds the costs of these projects by 2.2 times, with
highest economic benefit from the R&I
3,5
3,19
Additional value added created by projects implemented in 2014-2030, by sector, times
3
2,39
2,5
2,29
2 2,03
Times
1,59
1,5
1
0,5
R&I
RTD Business and Business Environment Energy
Energetics Tourism Human Resources
0
2013 2014 2015 2016 2017 2018 2019 2020 2021 2022 2023 2024 2025 2026 2027 2028 2029 2030
Source: HERLIT-16, Ministry of the Economy and InnovationExperience from 2014-2020: PRIORITY AXIS 1. STRENGTHENING RESEARCH AND
DEVELOPMENT AND INNOVATION
PROBLEMS SOLUTIONS
Low value-added-based structure of the
Lithuanian economy 1. Financing of corporate R&I activities
Export of Lithuanian knowledge-intensive
2. Attraction of FDIs
products and services, employment in
knowledge-intensive enterprises, economic
impact of investments and other knowledge- 3. Building and development of networks, supporting
intensity indicators - behind the EU average activities of R&I partnerships
Supported activities:
4. Strengthening of the availability and quality of
innovation support services
Non-active business-science cooperation
5. Explaining innovations to SME (LIC project
Low number of innovative firms continuance)
Low private R&I investment 6. Promotion of the demand for innovationAchieved results Private investments matching public support:
in 2014-2020 in Higher
2023 Plan in OP – EUR 175 million, of which
financial instruments – EUR 1,7 million;
R&I area quality of
business Achieved (June 26th) – EUR 39 million, of which
consultation financial instruments – EUR 255 thousand
Number of enterprises receiving
Better
grants – 671 business-
science
cooperation
Number of enterprises
supported to introduce new to Lithuania‘s
the market products – 262 place in Number of enterprises receiving
Innovation
Scoreboard non-financial support (FI) - 622
- from 24 to
21
Number of enterprises supported
to introduce new to the firm
products - 47
More
innovationAnnual increase in R&I, percentage points Source: HERLIT-16, Ministry of the Economy and Innovation
Lithuania has higher potential in the capital and larger cities,
while other regions are lagging behind
                                    Commited investments in 2014-2020 of priority axis
                                            1 (R&I), as of December 2018.

Source: Visionary Analitics, 2019
Innovative firms are concentrated in four regions, however
innovators in R&I area are mainly located in Vilnius
Index of Lithuanian innovative firms, LT average = 100 Innovative firms indicators, by region
Capital Central and
region Western
Lithuania
Business sector 3 385 2 190
employees involved in R&D
(2017) - individuals
Expenditure on R&D in the 80 378 34 182
business sector (2016) -
million EUR
The share of innovating 50 44,7
enterprises compared to all
enterprises (2016) - (%)
Proportion of employees in 72 66,1
innovative enterprises
compared to employees of
all enterprises (2016) -
(percent)
Share of turnover of 78,9 75,6
innovative enterprises
compared to total turnover
of enterprises (2016) - (%)
Source: Visionary Analitics, 2019Current problems to be tackled The economy's capacity to innovate and absorb R&I is limited. Innovating firms in Lithuania are relatively small in size; Cooperation between businesses and universities or research centres remains scarce; Investment in R&I is below the EU average; Low business demand for research and innovation is mainly predetermined by the structure of the economy, which mostly consists of lower value added industry and services; Belated reform of the innovation policy – started only in 2018
Proposals and recommendations
   MOST SUCCESSFUL – TO
   CONTINUE                                                   TO BE IMPROVED
   According to Impact Evaluation of the 1 Priority Axis      Moreover, all activities could be improved by
   (Visionary Analitics, 2019), most successful and           • Creating more synergy between measures, less
   popular activities were:                                     fragmentation;
   • Corporated R&I activities                                • Scaling-up, as massives measures lead to more
                                                                efficiency;
   • Activities promoting demand for innovation.
                                                              • more attention for new innovators;
                                                              • more attention for innovation support services;
                                                              • developing forms of cooperation.

All proposals for 1.1 objective activities in 2021-2027 were prepared according provisions of Country Report
Lithuania 2019 Annex D, OECD survey 2018, National progress programme (project), 2014-2020 projects
experience and Impact Evaluation recommendations
2021-2027 investments
1.1. objective „Enhance research and innovation capacities and the uptake
of advanced technologies“
Low private RDI investment, Creation of new high value -
low economic impact added products Start-ups acceleration and
(RCO01, RCO02, RCO03, RCO08; development
RCR01, RCR02, RCR03, RCR05, (RCO15, RCR17, RCR01)
RCR06, RCR19)
Proposed
Non-active knowledge
activities: Collaborative, contract-based
triangle (science-business- International networking
research
state) (RCO01, RCO02, RCO07, RCO10, (RCR19)
RCR02)
Small, weak in international High-value added FDI
area innovators (national indicators)Digitisation
Digitisationfor
forCitizens,
Citizens,
Companies
Companiesand andGovernments
Governments
1.2 objectiveExperience from 2014-2020:
PRIORITY AXIS 2. PROMOTING INFORMATION SOCIETY
PROBLEMS SOLUTIONS
1. Increasing the availability and use of
Unequal coverage of hi-speed
broadband electronic communication networks
broadband among the regions
and the provision of services
Low security of the information 2. Increasing the efficiency of the protection of
infrastructure and resources state information infrastructure and resources
Supported activities:
Small share of enterprises use public 3. Increasing the reuse of public sector
sector information for the information for business and public needs
development of new commercial
digital products and services 4. Increasing the demand for ICT among the
population
Low accessibility and quality of public
and administrative services 5. Increasing the accessibility and quality of
public and administrative servicesAchieved results in One single
2014-2020 in gateway to
information society open data:
the
Lithuanian
Open data
portal
Created more digital services
(e.g.: E-invoice, E-waybill,
applied accounting system,
Better
protection of smart cash registers and etc.)
state
information
and
resources
State Population usage of internet up to
information
infrastructure 78 percent (in 2013 - 65 proc.)
50,18 % consolidation
in progress
population using
public e-services
More
e-services
Source: Ministry of Finance, Annual OP implementation reportCurrent problems to be tackled
Slow development of digital economy;
Very low share of open data compared to EU28, low availability and insufficient reuse;
Digital divide between rural, older, disabled and lower-income residents and educated, high-income,
young residents in internet use: Only 55 % of people have basic digital skills (as opposed to 57 % in the
EU as a whole), although Lithuania is one of the EU countries with the lowest proportion of adults with a
low level of education (in 2017 only 12% Lithuanians have less than lower secondary education, against
an EU average of 25%);
Non-systemical view on Cyber Security.
All proposals for 1.2 objective activities in 2021-2027 were prepared according provisions of Country Report Lithuania 2019 Annex
D, OECD survey 2018, National progress programme (project), Evaluation on Lithuanian economic sectors finance post 2020,
2014-2020 projects experienceDigital Economy and Society Index 2019:
Lithuania overview
LITHUANIA EU average
RANK SCORE SCORE
DESI 2019 14 52.0 52.5
DESI 2018 14 49.2 49.8
DESI 2017 18 44.6 46.9ICT Infrastructure Optimization & Management
Transformation
Aim of the Program: Optimization of ICT Infrastructure (policy, human resources,
processes, technologies)
Budget: EUR 38.331.470
Term of the Program – 31.12.2023
Added value:
1. Centralized, standardized and secure management of information resources
2. Focusing ICT policy on the new stage of digital state and economic development
3. Cost savings for hardware and licenses by 30%Status of the Program
2018 2019 2020 2021 2022 2023
2nd stage: 3rd stage:
1st stage: ICT optimization Adjustments as
Focusing Policy implementation needed
model
CIO Office Implementation of Digital Agenda
Management Model and Preparation
G-Cloud: infrastructure and Platform G-Cloud expansion stages
State ICT Center Increasing the competencies of the State IT Center
State Data Center No. State Data Center
1 Data Center support and backup (from startup)
No.2
Migration Iterations of Migration
Optimization of working
Robotization of Maintenance/ optimization
places
Time frame
Part of Continuous
Tags: Legislation Ongoing activity Planned activity
program activityCentral eHealth System (ESPBI IS)
Storage and exchange of 12
different clinical documents
related to:
• referrals,
• discharge letter,
• out-patient medical records,
• E-Prescriptions,
• lab results, etc.
as well as 8 medical certificates:
• health certificates for students,
drivers, holders of weapons,
• birth or death certificates, and
others.Central eHealth System: main indicators
92 %
Central eHealth system
e-
100 %
(ESPBI IS) is capable of
Prescriptio
ns pharmacie
s are
storing patient information from
87 %
connected
and can
various health care institutions
eEpicrisis dispense
medicines
(HCI) in one eHealth history.
835 HCI (out of 900) by
are connected to ePrescripti
central eHealth ons
system. These HCI
take care of 95 %
One Resident – One EHR
75 % Lithuania's patients
100 % (electronic health record)
health
certificates death
for drivers certificate
100 %
birth
certificate
5
2Development of eHealth System
2016 – 2018
2009-2015 2019
eHealth
Implementation of Future
growing
eHealth projects development
usage
Implementation of New documents stored per Action plan 2019-2025
national eHealth and month
2016.12 – 116.000 Development projects for
other information 2017.12 – 1.240.000 3 years perspective
systems 2018.12 – 2.331.000
2019.04 – 3.004.000
532021-2027 investments
1.2. objective „Reap the benefits of digitalisation for citizens,
companies and goverments“
Development of digitalisation
Large digital exclusion of Innovative and users friendly
capacities (inohub,
population (low demand for public digital services
competence centre,
ICT) creation and development
innovation centre and etc.) (RCO13, RCR11, RCR12)
(RCR13)
Installation and development
Proposed Cyber security (public sector, of interoperabilty solution in
The potential of ICT in the
activities: SME‘s) (national indicators) public sector
public sector is not in use (RCO14, RCR11)
enough
Consolidation of the state
Upscale and accelerate open
information resources
data
(national indicators) infrastructure
(national indicators)
The potential of ICT in
business is not in use enoughGrowth and Competitiveness of
SMEs
1.3. objectiveExperience from 2014-2020
PRIORITY AXIS 3. PROMOTING COMPETITIVENESS OF SMALL AND MEDIUM-SIZED BUSINESS
PROBLEMS SOLUTIONS
Lithuania - behind the EU-27
average in terms of Low productivity of the
entrepreneurship level manufacturing industry 1. Increasing the level of
entrepreneurship
Lack of initiatives promoting
entrepreneurship and a lack of
Expensive
financing
implementation of
technological 2. Increasing the
Insufficient access of SMEs, innovations in business internationalisation of SME’s
particularly start-ups, to the and improvement of
necessary sources of financing technological capacities;
Supported
lack of funds; and activities:
insufficient level of
Limited accessibility and supply of organisational and non- 3. Increasing the productivity of
services for business technological
innovations launched in
SME’s
business by companies
Very small domestic market,
export volumes of domestic goods
of Lithuania are small, 4. Increasing investments of SMEs
Low level of
low internationalisation of SMEs investment into in eco-innovation and other
eco-innovation, resource-efficient technologies
Value-added generated by production costs resource-
per one employee of SMEs in Lithuania is efficient
nearly 3 times as high as the EU-27 average technologiesAchieved results in
2014-2020 in „Doing
business promoting business“
– Lithuania Private investments matching public support:
in 14 place 2023 Plan in OP – 307 million EUR, of which
financial instruments – 81 million EUR;
Achieved– 252 million EUR, of which financial
instruments – 133 million EUR.
59 million
Number of for industry
digitalisation
enterprises in SME‘s
receiving grants
– 6054
Fostering of
ecoinnovation
Number of new
enterprises
receiving
investments –
2062
Promoting
business
modernisation
in regionsSource: HERLIT-16
Current problems to be tackled
- The benefits of Lithuania's speedy economic convergence are heavily
concentrated in the two metropolitan areas;
- Despite the improved availability of funding, SMEs access to finance score
remained close to the EU average. SMEs continued to experience some
challenges in obtaining loans;
- Productivity growth is concentrated in low value added sectors (decreasing
competitiveness of SME‘s);
- Export market potential in not in use (to give more attention for EU strategic value
chains)
Proposals and recommendations
   MOST SUCCESSFUL – TO
   CONTINUE                                                   TO BE IMPROVED
   According Impact Evaluation of the 3 Priority Axis         Moreover, all activities could be improved by
   (Visionary Analitics, 2019) most effective activities      • more synergy between measures;
   were:                                                      • massives measures lead to more efficiency;
   • development access of SMEs, particularly start-ups,      • more attention for new export market;
      to the necessary sources of financing, searching of     • more attention for new technologies (Industry
                                                                 4.0 and etc.);
      new export market and new trade partners.
                                                              • better access to international market and
                                                                 networks.

All proposals for 1.1 objective activities in 2021-2027 were prepared according provisions of Country Report
Lithuania 2019 Annex D, OECD survey 2018, National progress programme (project), 2014-2020 projects
experience and Impact Evaluation recommendations
2021-2027 investments
1.3. objective „Increase the growth and competitiveness of small and medium-sized
enterprises“
Building of technological
Participation in cooperation
capacity in Industry 4.0 areas
networks and interregional
Decreasing competitiveness and in key enabling
clusters, including Baltic Sea
technologies (RCO01, RCR03,
RCR19, RCR25)
region (RCR19, national indicators)
Slowed productivity growth SME’s internationalisation
Investment in non-
and preparing for the future activities, identifying new
technological innovation
Proposed (RCO01, RCR04, RCR19, RCR25) export market
(RCO01, RCR19)
activities:
Weak enterpreneurship in New started firms creation,
regions Supporting of various acceleration, development
business financing models and mentoring activities,
(RCO01, RCR19, RCR25, RCR04) especially in regions
(RCO15, RCR17, RCR01)
Low integration to global
value chain
Investments in ecoinnovation
(national indicators)Skills for Smart Specialisation,
Industrial Transition and
Entrepreneurship
1.4. objectiveExperience from 2014-2020
PRIORITY AXIS 9. EDUCATING THE SOCIETY AND STRENGTHENING THE POTENTIAL OF HUMAN RESOURCES: problems and solutions
1. Improvement of 2. Support for
qualifications and investing companies
competence of and companies
No forecasting of human
human resources engaged in RDI
resources system
(„Skills vouchers“) activities
3. Apprenticeship and 4. Medium-term
the acquisition of forecasting of the
No instrument enabling
Supported sectoral competences demand for human
comparison of the
professional structure of activities: resources
the labour market at
international and
5. Development of a
domestic levels
complete instrument
for the international 6. Forecasting studies
and national on the demand for
No functioning nationally comparison of labour human resources in
supported scheme for market’s professional the labour market
enhancement of the structure
workforce qualificationsAchieved results
in 2014-2020 in Better
qualifications
and
human resources competence
of human
The employed people who participated in ESF
training awarding a qualification or competence
resources
2023 Plan in OP – 65 000;
Achieved until now – 31 306
Better R&I
competence
of human
resources
Trained
employees of
supported
micro, small
and medium- Improved
sized sectoral
enterprises – competences
11 664
Development
of the
forcasting of
the demand of
human
resourcesIn the mid-term, highest EU investments impact in HR area is on wages, while in the long-run on productivity in manufacturing
Problems still remain:

-   Lithuania has made limited progress in improving the quality, efficiency and labour market relevance of education and
    training;
-   Adults participation in learning remains low;
-   Lack of coordination of the validation of programmes across education, the labour market and the voluntary sector;
-   Public financial incentives or grants are mostly focused on medium-sized and large business;
-   Non-sustainable adult learning system.

According provisions of Evaluation on Lithuanian economic sectors finance post 2020, activities could be improved:
- more attention for variety and needs-match learning programmes;
- better access for training services;
- better motivation for better qualification.

    All proposals for 1.4 objective activities in 2021-2027 were prepared according provisions of Country Report
    Lithuania 2019 Annex D, OECD survey 2018, National progress programme (project) and 2014-2020 projects
    experience
2021-2027 investments
1.4. objective „Develop skills for Smart Specialisation, industrial transition
and entrepreneurship“
Low degree of innovation and SME’s and innovation SME’s re-skilling, up-skilling
digital proficiency providers training on how to in Smart Specialisation,
manage innovation, skills on industrial transition,
developing and providing R&I digitalisation, productivity
ideas and services (RCO101, areas (including
Skills mismatch and weak RCR98) apprenticeship)
firms employees preparation (RCO101, RCO16, RCR97, RCR98)
for future challenges Proposed Developing of
activities: entrepreneurship in out-of
Development of a complete
school forms
(RCO101, RCO16)
instrument for the
international and national
Weak enterpreneurship comparison of labour
market’s professional
structure (national indicators)
The lack of the qualified
workforce in SME‘s
Tools of vocational guidance for all age groups
Recognition of competences acquired in different ways
Attraction of the high-qualified specialists from third
Lack of the export
countries and instrumens for their integration
management knowledge and
skills in SME‘sFinancial Instruments
2014-2020 FINANCIAL INSTRUMENTS
                            AND PARTIAL COMPENSATION OF INTEREST
                  EUR 420.27m amount allocated for all instruments, out of which:
           EUR 229.96m ESIF: EUR 199.08m for FIs, EUR 30.88m for Partial compensation of interest
                          and EUR 190.31m national resources (reflows) for FIs
                                                                                                                                          Partial
     Equity Instruments (EUR                       Debt Instruments (EUR               Guarantee Instruments (EUR                     compensation of
                  169.18m)                                     142.35m)                               73.86m)                            interest
 Seed and             Co-
                  investment     Development
  Venture                        Funds I and II,     Risk Shared
                  Fund II and                                                           Individual      Portfolio
Capital Fund,                      up to EUR            Loans,                                                         Portfolio
                      Co-                                                              guarantees     guarantees
   Up to                         15.6m and up            up to       Open Credit                                      guarantees
                  investment                                                          for loans and    for loans,
 EUR 14.8m                       to EUR 17.4m       EUR 79.65m       Fund II, up to                                  for factoring,
                   Fund R&I,                                                             leasing,        up to
                                                    (EUR 76.64m       EUR 57.7m                                           up to
                     up to                                                                 up to      EUR 28.26m
                                                   ESIF, EUR 3.01m                                                     EUR 4.3m
     Co-           EUR 11.6m      Business                                               EUR 29m
                                                       reflows)
 investment      and up to EUR   Angels Fund
                                                                                                                                           Up to
    Fund,             5m              II,
                                                                                                                                         EUR 30.88m
    up to                         up to EUR
  EUR 12.5m                          11m
                  Seed and                                                                                            Individual
                                                                                                       Portfolio
   Baltic          Venture                                                            Export Credit                  guarantees
                                                                     Crowdfunding                     guarantees
 Innovation      Capital Fund                                                         Guarantees,                      for large
                                 Accelerator                          Loans, up to                    for leasing,
Fund I and II,        II,                                                                up to                       companies,
                                 Fund, up to                            EUR 5m                           up to
    up to           Up to                                                               EUR 8m                           up to
                                 EUR 14.48m                                                            EUR 4.3m
  EUR 26m         EUR 14.8m                                                                                            EUR 4m
    each

                                                        ESIF/
   Reflows                                                              Reflows         Reflows                        Reflows
                     ESIF             ESIF             Reflows                                           ESIF                               ESIF
  (national)                                                           (national)      (national)                     (national)
                                                      (national)
FINANCIAL INSTRUMENTS IN 2014-2020 PROGRAMMING PERIOD
• Increased attention to financial instruments (19 active, 1 are coming)
• Promotion of new types of financing (including alternative) (portfolio
guarantees for factoring, crowdfunding loans, export credit guarantees, co-
investment fund for R&I)
• Equity instruments for different stages of SMEs‘ life cycle (pre-seed, seed,
start-up, expansion, growth)
• Further cooperation with other Baltic countries (Baltic Innovation Fund II)
• Wide use of reflowsCHALLENGES IN IMPLEMENTING FINANCIAL INSTRUMENTS IN 2014-
2020 PROGRAMMING PERIOD
• Limited possibilities of implementation of pilot financial instruments
from ESIF (due to various restrictions and audits)
• Limited possibilities of combination of grants and FIs under single
operation
• Too detailed ex-ante assessment methodology – delayed reaction to
changing market needs
Challenges with specific financial instruments from ESIF:
• Loan instrument „Risk Shared Loans“ is not running as expected
(market situation changed; conditions of this instrument became
unattractive for banks)
• Still no investments from Co-investment Fund R&I (science
institutions are not keen to invest into spin-offs)FINANCIAL INSTRUMENTS IN 2021-2027 PROGRAMMING PERIOD
• Financial instruments (loans, guarantees, equity) – to be used to
support broader scope of activities
• Further development of equity ecosystem
• Potential wider deployment of combination of grants and financial
instruments (depending on the final version of CPR)
• Reflows would be used more widely
Ex-ante assessment will show which objectives would be
pursued (activities would be covered) through financial
instrumentsAnnual increase in GDP level in p.p. (Financial instruments impact)
(Source: HERLIT-16)
Source: HERLIT-16, Ministry of the Economy and InnovationSUCCESS STORIES
Success Story. Foodsniffer
                                       • The World’s first handheld
                                         mobile device that determines
                                         the freshness of raw meat and
                                         fish.

                                       • Export to 15 countries: UK,
                                         France, Switzerland, Italy, Czech
                                         Republic, South Africa and more.

         „Business Angels Fund“
                                               „InoPatent“               „InoVouchers“
         Funded – 1.366.003 Eur
                                 Project value – 7.640 Eur   Project value – 52.618,40
        Out of which 928.529 Eur
                                      Funded – 5.730 Eur                           Eur
           Business Angels‘ fund
                                                              Funded – 36.774,96 Eur
Success Story. LB CHAIN PLATFORM-SERVICE
Technological / regulatory sandbox
Bank of Lithuania
„Pre-Commercial Procurement LT“
Project value – 896 300 Eur
Funded – 761 855 EurE-invoice subsystem (i.SAF)
Services provided in i.SAF Benefits
i.SAF subsystem Conditions for waiving
i.SA
containing invoice paper invoices are
F
data created
A preliminary VAT
Preparation of invoice is prepare for a
preliminary VAT Tax Payers (TP), thus
returns saving the time of a TP
E-services
Invoicing system for
E-invoicing small business
Notification on Cross-check of
discrepancies of information allows
cross-check of identifying fraudulent
invoices between TPs
sellers-buyersSuccess Story. Fishfinder Deeper
The world’s most popular castable fishfinder.
„New Opportunities LT“ „Expo Certificate LT“
Project value – 90.000,00 Eur Project value – 57.331,84 Eur
Funded – 45.000,00 Eur Funded – 28.665,03 EurIntensive trainings to increase added value created by SMEs Program requirements: SME with export potential 2 participants per company (CEO+Export manager) Motivation to change :Whats in it for SME 8 days of trainings and individual consultations Create or Rebrand and understand how to earn from what Previous participants increased their export after the trainings twice, from 8134 to 17349 thounsands EUR.
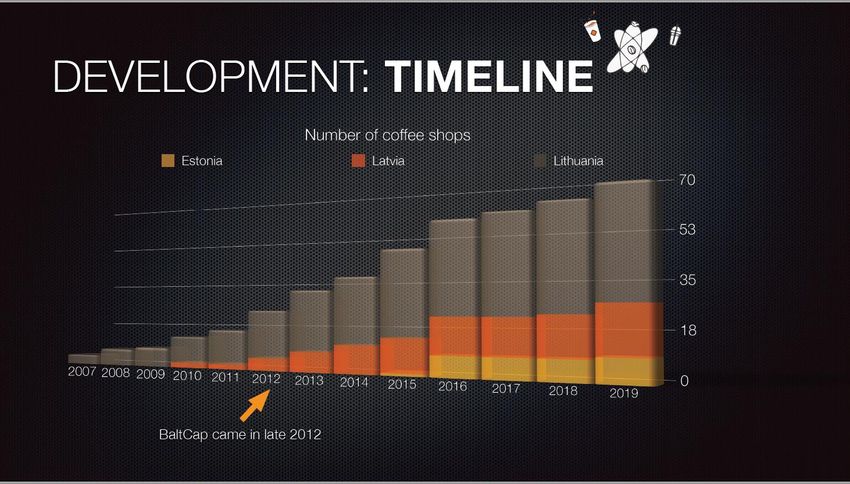
SUCCESS STORY (FI): CAFFEINE

                               LT: est. 2007, 40 coffee shops
                               LV: est. 2010, 18 coffee shops
                               EE: est. 2015, 9 coffee shops
Thank You!
Kiek švietimo sistemos pasiūla ir įgyjami įgūdžiai atitiks
darbo rinkos poreikius?
                 Įgūdžių neatitikimo komponentai, pagal kvalifikaciją, proc. nuo 15-64 m. darbuotojų

Šaltinis: EBPO
Investicijos į žmonės – viena svarbiausių sėkmės
komponenčių
Suaugusiųjų (25-64 m.) dalyvavimas mokymuose 2017 m., proc.
31,2
30,4
26,8 27,4
23,6
19,9
18,7 19,1
17,2 17,2
15,8
14,3
10,6 11,3 12
9,8 9,8 9,9
8,9
7,5 7,9 8,4 8,5
6,9
5,9 6,2
4 4,5
3,4
2,3 2,3
1,1
Šaltinis: EurostatKiek Lietuvos darbo rinką paveiks automatizacija?
Panel A. Region of Type B
Lithuania
Number of jobs, thsd
20
93
15
12 24
10 71
21 75
52 51 91
26 82
5 34 42
25 41
23 22 96 53
35 72 94
0 32 74 73 62 92
14 1131 54 44 81
13
43
-5 83
61
-10 Teisininkai,
ekonomistai...
IT specialistai, Siuvėjai,
-15 statybininkai
inžinieriai...
...
-20
33
-25
0.3 0.4 0.5 0.6 0.7
Average risk of automation
Nekvalifikuoti gavybos, statybos, pramonės ir transporto darbininkai (93), Maisto gamintojai, medienos meistrai, siuvėjai ir kiti giminiškų profesijų
darbininkai ir amatininkai( 75), Valytojai ir pagalbininkai (91)
Duomenys: OECD Country Profile of Lithuania, 2018You can also read