6th Annual State of Automotive Recalls Summit
←
→
Page content transcription
If your browser does not render page correctly, please read the page content below

6th Annual State of Automotive Recalls Summit
2018 Recap
• Number of vehicles recalled in the U.S. has stabilized since elevated activity during 2014 - 2016
   • Number of individual campaigns greater than years of exceptional activity
   • Number of vehicles affected by recalls is consistent with prior year, and vehicles involved in
     campaigns other than Takata inflator recalls is consistent with activity since 2015.
   • Approximately 24 million vehicles recalled exclusive of Takata inflators

• Six non-Takata campaigns in 2018 affected more than 1 million vehicles (46% of non-Takata recalls):
    • FCA electrical system: a short circuit in the vehicle’s wiring may prevent cruise control from
      disengaging (4.8 million vehicles)
    • Ford seatbelts: sparks from the deployment of the front seatbelt pretensioner may ignite materials
      within the B-pillar area (1.6 million vehicles)
    • Ford steering wheel: steering wheel may detach while driving (1.3 million vehicles)
    • Ford fuel system: cannister purge valve may malfunction and cause an engine to stall while driving
      without the ability to restart the vehicle (1.3 million vehicles)
    • FCA latches: tailgate latch actuator limiter tab may fracture and cause tailgate to unlatch while driving
      (1.1 million vehicles)
    • GM steering: electric power steering assist may be lost momentarily (1 million vehicles)

                                                                                                                  2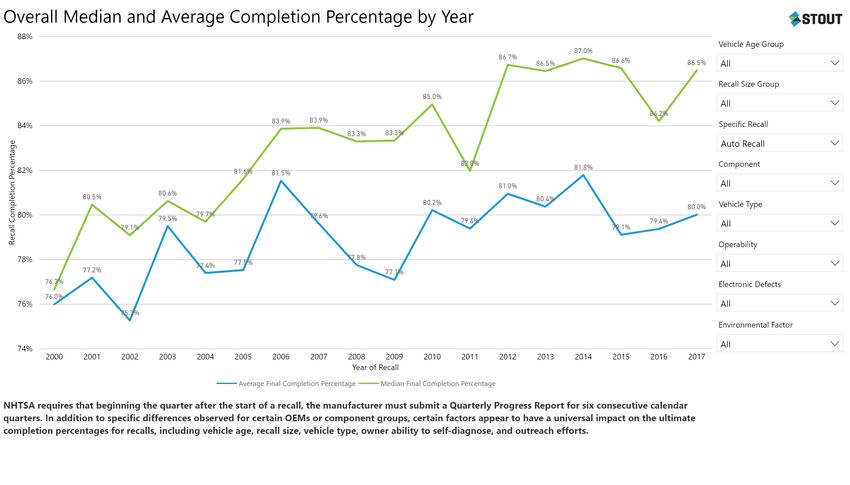
2018 Recap

2018 Recall Sizes
• Largest recall of 2018:
    • Issued by FCA related to 2014 – 2018 Dodge, RAM, Jeep and Chrysler vehicles may
      experience electrical short preventing cruise control from disengaging
    • 4,846,885 vehicles affected

• Smallest recalls of 2018
   • 2 vehicles recalled by Bugatti and Mercedes-Benz

                                                                                        3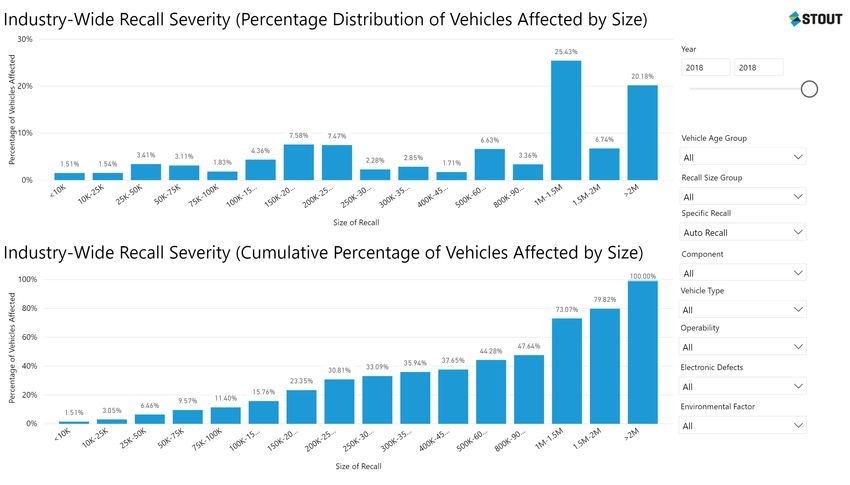
2018 Recap

Sources:
Traffic Volume Trends November 2018, Federal Highway Administration1
Number of motor vehicles registered in the United States from 1990 to 2017, statista2

                                                                                        4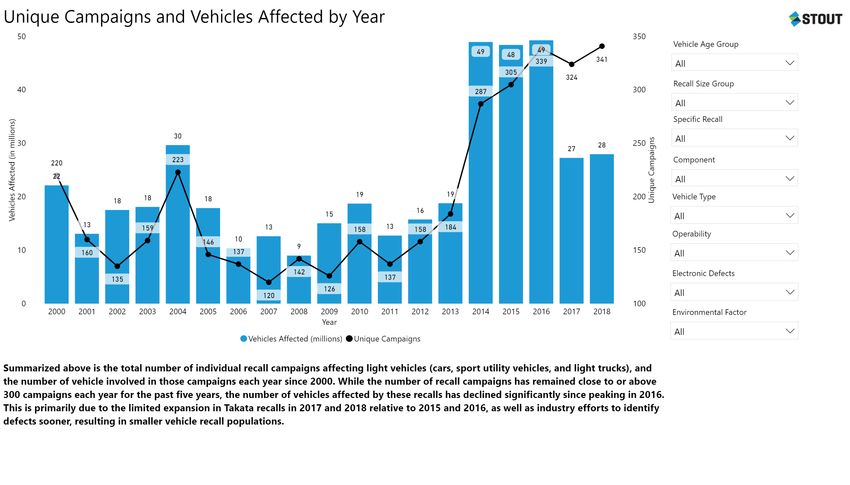
2018 Recap

Source: Average Age of Automobiles and Trucks in Operation in the United States, Bureau of Transportation Statistics3

                                                                                                                        5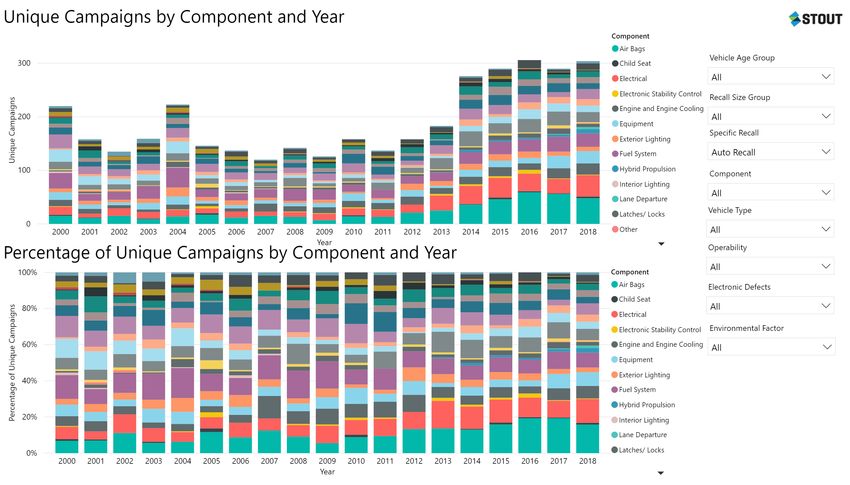
2018 Recap
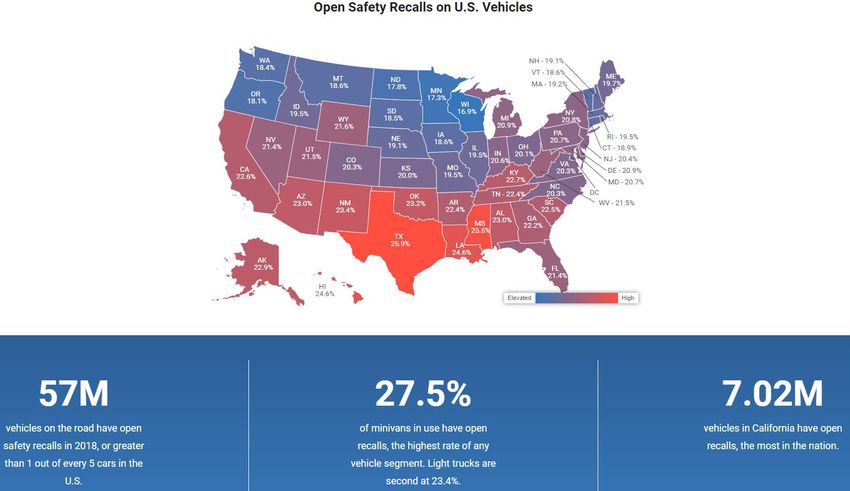
Source: Carfax Vehicle Recall Check4
6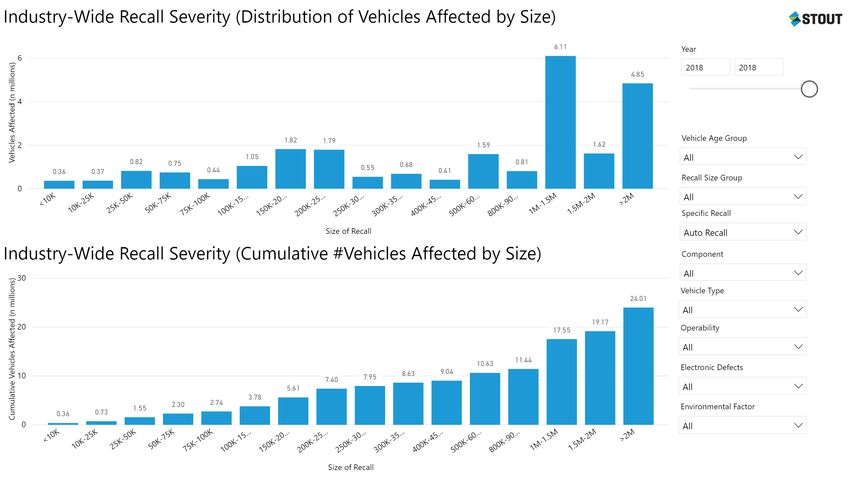
2018 Recap

Takata Update
• All remaining vehicles were scheduled to be recalled by 12/31/2018 (all unrepaired non-desiccated PSAN) 5
• All like-for-like replacements scheduled to be recalled by 12/31/2019 5
• On December 21, 2018, the Independent Monitor of the Takata Recalls issued a second report about the state of the
  Takata recalls
    • As of October 2018, approximately 17 million vehicles still had unrepaired defective Takata airbag inflators
    • The Report discusses initiatives implemented by manufacturers resulting in unprecedented increases in recall
      completion percentages, especially for the older and more dangerous vehicles affected:
      • Improving data quality
      • Segmented analysis
      • Communications
      • Overcoming owner inconveniences
      • Dealer engagement
      • Third party engagement
      • Canvassing 6

                                                                                                                      7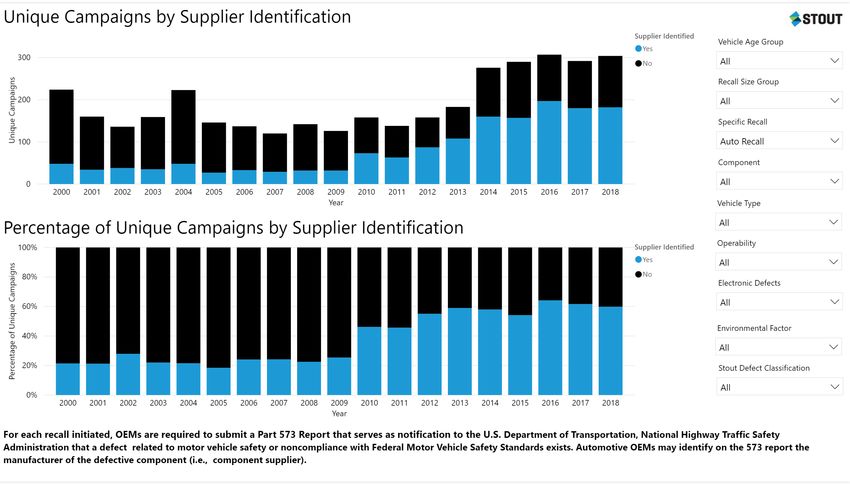
2018 Recap

Takata Update
• As of January 18, 2019, the overall recall completion percentage for Takata recalls was 65% 5
• The completion percentages for Priority Groups 1 – 9 are available at NHTSA.gov :

                                                                                                  8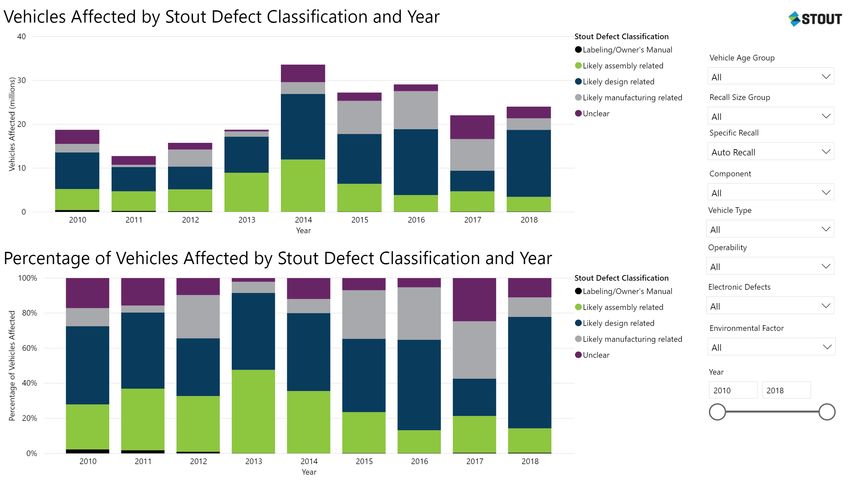
Data Analysis and Review:
Recall and Defect Overview

                             9
Recall and Defect Overview

Recall Data Analysis: Process and Background
• Information downloaded from NHTSA website (www.nhtsa.gov) for historical recalls dating back to 1966

• NHTSA data provided detail regarding NHTSA campaign number, manufacturer, model and model year,
  component, total units affected, and certain additional fields

• Stout analyzed recall trends for OEMs across various component groupings and timeframes

                                                                                                         10
Recall and Defect Overview
Year in Review: Stabilization in the Industry
• Takata inflator recalls have abated, providing insight into industry recall activity
• Units affected by recalls in 2018 nearly identical to 2017
• Non-Takata inflator activity is consistent over past four years
• Approximately 24 million vehicles recalled for non-Takata inflator defects in 2018
• Despite stabilization in number of vehicles recalled, number of campaigns has increased
• Average recall size declining
• Airbag recalls not associated with defective Takata inflators still represent the greatest number of recalls,
however electrical recalls affected more vehicles in 2018 (significantly influenced by FCA cruise control
recall)
13Recall and Defect Overview
Analysis by Size of Recall
• Large recalls may be the most newsworthy, but historically have not been the most prevalent
• 65% (on a unique campaign basis) involve fewer than 10,000 units in 2018, many with significantly
less
• However, recalls of greater than 100,000 units consistent involve more than 85% of vehicles affected
by recall in any year.
• There has been a steady increase in the number of recalls involving fewer than 100,000 units since 2014
• Recalls over 100,000 units represented less than 20% of all unique recalls each year since 2014.
• We observe certain differences for large recalls as compared to small recalls, such as
• Differences in completion percentages
• Differences in age of vehicles involved
• Differences in frequency of suppliers being named in DIRs
14Supplier Identification: 573 Letter Review
20Supplier Identification
Part 573 Letter Review
• For each recall initiated, OEMs are required to submit a Part 573 Report that serves as notification to
the U.S. Department of Transportation, National Highway Traffic Safety Administration that a defect
related to motor vehicle safety or noncompliance with Federal Motor Vehicle Safety Standards exists
• Required sections of report include:
• Manufacturer, Designated Agent and other Chain of Distribution Information
• Identification of the Recall Population and its Size
• Description of the Defect or Noncompliance and Chronology of Events
• The Remedy Program and its Schedule
• Manufacturer of Defective Component
21Analysis of Part 537 Letters
Supplier Identification: Observations and Conclusions
• Review of 573 Reports indicates continued trend of more frequent supplier identification, particularly
for certain components
• Both in terms of number of campaigns and as a proportion of total campaigns
• Airbags, electronic stability control, and hybrid propulsion represent components where supplier is
most likely to be identified
• Proportion of suppliers identified in recalls involving design related defects is declining, however
suppliers named in manufacturing related defects at levels not seen since 2008
27Recall Completion Percentage
Overview
28Recall Completion Percentage Overview
Recall Completion Percentage Review
• NHTSA requires that beginning the quarter after the start of a recall, the manufacturer must submit a Quarterly
Progress Report for six consecutive calendar quarters. The deadline for the report is the 30th day of the month
following the quarter’s end.
• In analyzing this data, Stout linked Quarterly Progress Reports to NHTSA’s larger recall database using campaign
numbers in order to analyze trends in completion rates across different subsets of recall data.
• Required Data to be disclosed includes:
• NHTSA-assigned recall identification number
• Manufacturer-assigned recall identification number, if applicable
• Various dates of notification for dealers and purchasers
• Number of items involved in the recall
• Number of items at respective quarter’s end that have been remedied
• Number of items as respective quarter’s end that have been inspected and determined to not need a remedy
• Number of items unreachable for inspection
• Number of items returned and/or repaired by dealers, retailers and distributors
29Recall Completion Percentage Overview
Recall Completion Percentage - Highlights
• Three recent campaigns achieved 100% completion:
• Model Year 2016 Honda Clarity –
• Fuel cell control unit may cause loss of power
• 471 vehicles affected
• Model Year 2019 Subaru Ascent –
• Missing spot welds in B-pillar area
• 293 vehicles affected
• Model Year 2018 Rolls-Royce Ghost –
• Head airbags may not fully inflate
• 3 vehicles affected
30Recall Completion Percentage Overview
Recall Completion Percentage - Highlights
• Older and larger campaigns that have achieved notable completion percentages:
• Model Year 2001 - 2002 Dodge Dakota, Durango, Ram van and Ram pick-up trucks vehicles –
• The ignition / park shift interlock system may become inoperative, allowing the shifter to be moved out of
the “Park” position with the ignition key removed; this can also allow the ignition key to be removed when
the shifter has not been placed in the “Park” position.
• 576,418 vehicles affected
• 6 - 8 years old at time of recall
• 80.8% completion
• Model Year 1999 - 2000 Chrysler Cirrus, Dodge Stratus and Plymouth Breeze vehicles–
• Power steering fluid leakage in the presence of an ignition source may result in an under hood fire.
• 216,299 vehicles affected
• 6 - 8 years old at time of recall
• 87.0% completion
31Recall Completion Percentage Overview
Recall Completion Percentage – Influential Factors
• In addition to specific differences observed for certain OEMs or component groups, certain factors appear to have a
universal impact on the ultimate completion percentages for recalls:
• Vehicle Age: Completion percentages for recalls involving older vehicles are generally lower, sometimes
significantly. This impact becomes more pronounced as vehicles get older.
• Recall Size: Completion percentages for larger recalls (>100,000 units) are often approximately 5-10% lower
than for smaller-sized recalls.
• Vehicle Type: Completion percentages for trucks and minivans appear to perform differently than for sedans and
full-size vehicles.
• Owner Ability to Self-Diagnosis: If the vehicle owner can easily self-diagnosis whether the vehicle suffers from
the defect, completion percentages may suffer.
• Outreach Efforts: New ways of engaging with vehicle owners is demonstrating success – email, television
advertising, print advertising, mobile apps, etc.
32Recall Completion Overview
Recall Completion Percentage – Keys to Further Recall Success
• On December 21, 2018, the Independent Monitor of the Takata Recalls issued a second report about the state of the
Takata recalls.6 The Report discusses initiatives implemented by manufacturers resulting in unprecedented
increases in recall completion percentages, especially for the older and more dangerous vehicles affected:
• Improving data quality: frequently refresh and supplement vehicle owner registration records
• Segmented analysis: Categorize affected vehicle owner populations by available attributes and develop targeted
communications
• Communications: send outreach that is: frequent, personalized, bilingual, conveyed through multiple channels, conveys
urgency and importance, contains a call to action, uses eye catching graphics, conveys repair is free, clearly identifies
services offered
• Overcoming owner inconveniences: Offer free services that minimize repair inconvenience
• Dealer engagement: Proactively engage and motivate dealers to conduct recall outreach
• Third party engagement: Use DMVs, IRFs, insurers, auction houses and used car dealers to increase awareness and
facilitate repairs
• Canvassing: Engage in door to door canvassing of owners older unrepaired vehicles where repeated prior outreach has
been ineffective
40Recall Completion Percentage Overview
Implementing Recall Completion Benchmarking
• Completion percentage benchmarking can be utilized by OEMs and suppliers to:
• Monitor the pace of completion in active campaigns
• Ensure compliance with regulatory and enforcement actions
• Plan replacement part inventories and dealer service capacity
• Estimate potential financial exposure in cost recovery actions
• Identify appropriate risk mitigation and insurance strategies
41Electronic Component Defects
42Electronic Recalls and Software Recalls
Electronic Components: Industry Highlights
• U.S. DOT released the policy document Automated Vehicles 3.0: Preparing for the Future of
Transportation in September 2018,7 containing principles to guide future policy:
• Multimodal safety guidance
• Clarification of policy and roles
• How to work with DOT as technology evolves
• Integration of DOT administrations
• In October 2018, Pennsylvania’s Governor signed an act which allows for “platooning” of two or three
buses, military vehicles, or motor carriers, using a combination of V2V communications systems and
vehicle automation to control acceleration and braking to travel in close proximity.8
• Reduces aerodynamic drag, resulting in fuel savings and reduced emissions
• Reduces excessive braking, lessening impacts on infrastructure and decreasing congestion
43Electronic Recalls and Software Recalls
Electronic Components: Industry Highlights
• In January 2018, GM submitted a petition to NHTSA to put zero-emissions driverless
cars on public roads beginning in 2019.
• Vehicles would be built on the Chevy Bolt EV platform.
• Seeking permission to meet 16 safety requirements “in a different way.” 9
• Now open to public comment on the proposed exemptions for the next 60 days.
44Electronic Recalls and Software Recalls
Electronic Components: Analysis
• Our analysis of automotive electronics highlights the role of software in the failure or remedy of
electronic defects.
• Stout’s analysis has focused on the following categories of defects:
• Integrated Electrical Components (“IECs”) – Failure of electrical components due to physical defect.
Includes defects related to water intrusion, wiring failure, etc.
• Software Defect – Failure of components related to defect in operating software
• Software Integration – Failure results from software interfacing with other components or systems in
the vehicle
• Software Remedy – Software flash or replacement is identified as the appropriate defect remedy
45Electronic Recalls and Software Recalls
Electronic Components: Observations
• Recalls of electronic components have declined in 2018, however the number of campaigns involving
software based defects continues to increase
• IEC recalls have steadily declined over the past three years, while software based recalls have remained
stable
• One recall resulted in a significant increase in software integration activity in 2018:
• FCA electrical system (4.8 million vehicles): A short circuit in the vehicle’s wiring may cause the
system to stop communicating while the cruise control is active. The fault handling strategy in the
ECM software does not remove positive torque requests in the event of the electrical short.
• FCA performed a software flash on the ECM to improve the fault handling strategy so any torque
requests will be cancelled in the event of a short circuit during a positive torque request
50Electronic Recalls and Software Recalls
Electronic Components: Defect Emergence and Tail Risk
• Electronic content in vehicles has been expanding in terms of amount of this content, and the
applications in which it is utilized.
• In an evolving technological landscape, manufacturers and suppliers may struggle to predict patterns of
failure and understand the duration of their potential exposure to failure of new components and
technologies.
• While reviewing the individual defect descriptions associated with electronic recalls, Stout observed that
software-based defects (software defects and software integration) often appeared early in vehicle life
and infrequently after the first two years.
• Electronic defects which involve the physical component (software remedy and IEC) were observed to be
less frequently concentrated around the early years of vehicle life.
• Stout has plotted the frequency of software-based and non-software-based electronic defects on heat
maps to visualize the emergence of these defects by model year.
• Red indicates the greatest number of campaigns by recall year and model year; green indicates the
lowest.
51Electronic Recalls and Software Recalls
Emergence of Software-Based Recalls
Recall Year
MAX MY 2009 2010 2011 2012 2013 2014 2015 2016 2017 2018
2009 4 0 0 0 0 0 0 0 0 0
2010 1 1 1 0 0 0 0 0 0 0
2011 n/a 1 3 0 0 1 0 2 1 0
2012 n/a n/a 1 4 1 0 0 0 0 0
2013 n/a n/a n/a 2 3 1 0 0 0 1
2014 n/a n/a n/a n/a 4 11 3 0 2 2
2015 n/a n/a n/a n/a 1 5 20 0 0 1
2016 n/a n/a n/a n/a n/a n/a 2 9 0 1
2017 n/a n/a n/a n/a n/a n/a n/a 5 11 4
2018 n/a n/a n/a n/a n/a n/a n/a n/a 5 13
2019 n/a n/a n/a n/a n/a n/a n/a n/a n/a 7
52Electronic Recalls and Software Recalls
Emergence of Non-Software-Based Recalls
Recall Year
MAX MY 2009 2010 2011 2012 2013 2014 2015 2016 2017 2018
2009 47 12 7 8 4 3 4 8 5 4
2010 31 72 15 6 8 6 8 10 5 5
2011 n/a 37 51 9 12 18 10 21 6 6
2012 n/a n/a 35 71 22 10 10 10 22 13
2013 n/a n/a n/a 33 76 27 15 11 4 18
2014 n/a n/a n/a n/a 36 102 28 19 15 6
2015 n/a n/a n/a n/a n/a 81 120 30 14 8
2016 n/a n/a n/a n/a n/a n/a 53 133 37 14
2017 n/a n/a n/a n/a n/a n/a n/a 66 136 21
2018 n/a n/a n/a n/a n/a n/a n/a 1 44 140
2019 n/a n/a n/a n/a n/a n/a n/a n/a n/a 66
53Electronic Recalls and Software Recalls
Electronic Components: Defect Emergence and Tail Risk - Observations
• Both software-based and non-software-based recalls exhibit their greatest emergence between years 1
and 2 of vehicle life.
• The software-based recalls show little emergence after year 2 (limited tail risk), while the non-software-
based recalls present a moderate level of recall emergence throughout all years in the analysis
(continued tail risk through all 10 years presented)
• Software-based recalls are therefore more likely to:
• Be more predictable (limited tail risk)
• Involve smaller populations (less production history)
• Achieve higher recall remedy completion (newer and smaller vehicle population)
• Conversely, non-software-based recalls may:
• Be less predictable (longer tail)
• Involve larger population (more production history)
• Achieve lower recall remedy completion (potentially older and larger vehicle population)
54Electronic Recalls and Software Recalls
Remedies for Electronic Component Defects
• Electronic components offer unique opportunities for vehicle safety, improved fuel economy and
performance, and driver convenience.
• While the nature and scope of potential consequences of electronic component defects is still developing,
we have insight into types of remedies available.
• In addition to studying the nature of the defects associated with electronic components, Stout has
reviewed and analyzed the remedy descriptions for each of these campaigns.
• Our analysis considers:
• Remedy procedures
• Remedy time
• Delivery methods
• Completion percentages
55Electronic Recalls and Software Recalls
Remedy Procedures
• Our analysis considers electronic defects involving IEC devices and those that relate to the software
controlling or interfacing with those devices.
• By the nature of our analysis, remedies of IEC devices involve inspection, repair, or replacement of the
IECs. OEMs’ and suppliers’ exposures in these remedies are influenced by the cost of remedy
components, service labor times, and the number of vehicles that are repaired.
• Repairs to these components are not completed with software remedies.
• These nature of these exposures are not substantially different from those faced by defects found in
traditional components.
• Remedies of software-based defects may be remedied with a combination of replacement of the defective
component and/or an update to the software affecting the defective component. The past 10 years of
remedies for software-based defects indicate:
• 90% involve software-only remedies
• 7% involve a combination of software remedy and component repair or replacement
• 3% involve only the repair or replacement of an affected component
56Electronic Recalls and Software Recalls
Remedy Time
• Remedy times for the inspection, repair, or replacement of defective components may be difficult to
estimate or predict without specific remedy instructions:
• Type of component
• Location of component
• Nature of defect
• Nature of repair
• Remedy times for software-based defects are more standard across a variety of defects.
• Stout gathered Technical Service Bulletins and reviewed remedy instructions for all software remedy
based recalls in 2018. We observed:
• Range of software remedy times: 0.2 – 2.0 hours
• Average software remedy time: 0.6 hours
• Remedy times typically provide for driving vehicle in / out of service bay, stabilizing the vehicle power
supply, connecting the service tool to the vehicle’s USB or data port, and performing the update.
57Electronic Recalls and Software Recalls
Remedy Delivery Method
• Most electronic defects, including those involving software remedies are performed by a service
technician at a dealership, requiring owners to make a service appointment and go to dealerships.
• Software remedies do provide opportunities for repairs to be performed without vehicles being taken to
the dealership:
• USB flash drive
• Over-the-air (OTA)
• To date there are only limited examples of USB flash drive or OTA delivery of software remedies for
defects resulting in recall:
• USB flash drive: FCA radio software vulnerability (15V461 and 15V508)
• OTA: Tesla overheating vehicle charger (14V006)
• GM and Ford plan to have most vehicles able to accept OTA remedies by 2020.10
58Electronic Recalls and Software Recalls
Remedy Delivery Method
• Delivery of software remedies outside of a dealership are more commonly found among service
campaigns other than recalls (TSBs).
• Most of these updates involve non-critical updates (e.g., infotainment, navigation map updates, and
sound system changes).
• Between 2017 and 2018, Stout identified 8 TSBs involving OTA updates:
• Two appear to describe a notification to dealers of a primary remedy issued over-the-air to vehicle
owners, including one pilot program tested by GM.
• However, several service bulletins describe diagnosing and repairing failed OTA update attempts:
• One FCA OTA caused vehicle radios to become inoperative
• Three Honda / Acura service bulletins related to displaying error codes after attempted OTA updates.
59Electronic Recalls and Software Recalls
Remedy Completion Percentages
• Remedy completion percentages for electronic defects are higher than those of all other recalls during
the period 2008 - 2017:
• Industry average= 76%
• Electronic defects average = 79%
• This is influenced in large part by the younger age of vehicles affected by electronic components and the
relatively convenience of the remedies available.
• Among electronic defects, we observed a wider disparity between those recalls involving IEC defects and
software related defects over the period 2008 - 2017:
• IEC = 76% (consistent with industry average)
• Software integration = 81%
• Software defect = 84%
• Software remedy = 86%
60Electronic Recalls and Software Recalls
Remedy Completion Percentages
• Software remedy completion percentages are further enhanced by the convenience associated with
remedies delivered directly to owners (USB flash drive and OTA)
• While limited recall data exists for these campaigns, we can look at three such campaigns that have been
executed to date:
• 14V006: Tesla charger (21k vehicles affected)– 99.7% completion
• 15V461: FCA radio software vulnerability (1.4M vehicles affected) – 99.0% completion
• 15V508: FCA radio software vulnerability (7.8k vehicles affected) – 98.8% completion
• Each of these campaigns involved vehicles that were 3 years old or less at time of recall and reflect a
wide range of campaign sizes.
• The nature of the remedy in these campaigns minimized owner inconvenience which provided for high
remedy completion percentages.
61Electronic Recalls and Software Recalls
Observations and Conclusions
• Recalls involving software-based defects, including the number of vehicles affected, at record levels in
2018, a trend that we expect to continue.
• These defects demonstrate more consistent emergence patterns and shorter tail.
• Software-based defects also provide more opportunities for software remedies:
• Most often do not involve component repair or replacement
• Limited service labor times
• Opportunities for alternative remedy delivery.
• Electronic defects exhibit higher recall completion percentages than industry averages, especially for
software-based defects.
62Tire Recalls
63Tire Recalls
Nature of Tire Failures
• Each year about 33,000 tire-related passenger vehicle crashes occur, resulting in 19,000 injuries.11
• In 2017, 738 people died in tire-related motor vehicle traffic fatalities.12
• In 2014, the National Transportation Safety Board identified the following concerns related to tire
safety:
• Problems with the tire registration and safety recall system;
• Failure to establish the current level of crash risk posed by tire aging and lack of consumer guidance
on the issue;
• Poor tire maintenance practices by consumers;
• Barriers to technological innovation that could prevent or mitigate tire-related crashes. 11
• Tires are susceptible to age and climate-related deterioration:
• “Tires are primarily degrading from the inside-out, due [to] permeation and reaction of the
pressurized oxygen within the tire structure, with rates proportional to temperature.” 13
• Large body of scientific evidence indicates that tires expire after six years.14
64Tire Recalls
Tire Recalls - Background
• Tire manufacturers are subject to the reporting and notification requirements of Parts 573 and 577 of the
Federal Motor Vehicle Safety Standards.
• Tire manufacturers are also subject to the tire identification and recordkeeping requirements of Part 574
• The tire labeling requirement applies to all new, retreated tires and non-pneumatic tires and tire
assemblies, and requires that manufacturers identify:
• Plant code identifying the manufacturer or retreader;
• Manufacturer’s code containing significant characteristics of the tire;
• Date code
• Retreaded tire mark (as applicable)
• Tire manufacturers are required to remedy defective or nonconforming tires within the first 180 days
after the later of 1) an owner’s receipt of a notification letter, or 2) the owner’s receipt of notification that
a replacement is available.
65Tire Recalls
Tire Recalls - Background
• Tire recalls initiated by tire manufacturers differ from vehicle recalls involving tires. Tire recalls initiated
by tire manufacturers typically involve an issue of safety or noncompliance related to the manufacture,
materials, or labeling of the tire itself.
• Vehicle recalls involving tires often include:
• Tires damaged during vehicle assembly
• Tire pressure monitoring systems
• Installation of incorrect tires
• In addition to the vehicle recalls involving the tire defects described above, Stout has reviewed the recalls
initiated by tire manufacturers.
• We have excluded certain unique conditions related to trailer tires, motorcycles, labeling, etc., in order
to focus on conditions that made lead to failures or safety defects involving light vehicles.
66Tire Recalls
67Tire Recalls
68Tire Recalls
69Tire Recalls
70Tire Recalls
Tire Recalls - Observations
• Moderate level of tire recalls each year
• Typically about 9 recalls per year
• Average of 460k units affected per year
• Most tire recalls affect 10,000 or fewer units
• Average tire recall affects 54,000 units
• Majority of campaigns over past 10 years (55%) relate to tread / belt defects:
• Insufficient tread base
• Chunking / cracking
• Tread separation
71Tire Recalls
72Tire Recalls
73Tire Recalls
74Tire Recalls
75Tire Recalls
Tire Recalls – Completion Percentages
• Overall completion percentages for tire recalls involving passenger vehicles is approximately 30%.
• This is significantly below the industry average for vehicle recalls
• Tire recall completion percentages are significantly impacted by age
• Average completion percentage for tires older than five years is less than 5%
• There are several characteristics of tire recalls that impact completion percentages:
• Difficulty locating registered owners
• Limited requirements of independent dealer / distributors to collect registration information
• Limitation on manufacturer’s requirement to remedy
• Periodic replacement of tires by vehicles owners
76Tire Recalls
Tire Recalls – Observations and Conclusions
• Tire recalls are generally small and infrequent
• Tire equipment recalls are unique, and face different barriers to successful remedy completion
• Importance of engaging other stakeholders and understanding where risks remain
• Enhanced and creative outreach
• Data sharing with retailers, dealers, etc.
• Raising awareness
• Understanding risk profiles
77Other Indicators of Defect
78Other Indicators of Defect
Beyond U.S. Recall Data
• NHTSA recalls represent a focal point in the study of automotive component defects:
• Robust data set
• Specific vehicle model and production population data
• Detailed defect, consequence, and remedy verbatim descriptions
• While robust, this data is limited to safety defects that rise to the level of recalls.
• Stout has identified, collected, and analyzed additional sources of defect data to study
the emergence and patterns of other component defects that may not result in safety
recalls.
79Other Indicators of Defect
Beyond U.S. Recall Data
• Stout’s analysis includes these other sources of component defect information:
• Earning Warning Reporting (“EWR”) – Pursuant to the TREAD Act, NHTSA requires manufacturers
of motor vehicles to report certain specified information about each incident involving deaths and
injuries.
• NHTSA Defect Investigations – NHTSA also provides a database of all defect investigations
conducted by the agency from 1972 through the present. Investigations may result in safety recalls, or
may be designed to assess the scope or effectiveness of current recalls.
• Motor Vehicle Defect Petitions (“MVDP”) – MVDPs represent consumer submitted petitions to
NHTSA requesting the investigation of a potential issue. These petitions are reviewed by NHTSA, and
if accepted can result in the launch of an investigation.
• Petitions for Inconsequential Noncompliance – Vehicle and component manufacturers are permitted
to request from NHTSA an exemption from the notification and remedy requirements of the safety
act, due to the inconsequential impact of a known defect on vehicle safety.
• Technical Service Bulletins (“TSBs”) – Service procedures issued by OEMs to service technicians for
the diagnosis and repair of known defects. Defects identified in TSBs may subsequently result in
recalls.
80Other Indicators of Defect
Beyond U.S. Recall Data
• International Recall Data – In addition to U.S. recall and component defect data, Stout has collected and
analyzed recall data from the following non-U.S. jurisdictions:
• Australia
• Brazil
• Canada
• Germany
• Japan
• United Kingdom
81Other Indicators of Defect
Conclusions
• Analysis of many data sets can provide a more comprehensive understanding of the risk of component
defect.
• U.S. recall data is robust and instructive, but analysis of other data sets provides additional perspectives:
• Nascent field incidents
• Defect and component failure patterns or other potential safety concerns identified by NHTSA
• Concerns of the public
• Insights into NHTSA’s approach to risk assessment
• OEM communications to technicians
• Incidence of automotive component defects abroad
• Understanding of component defect is enhanced by insightful analysis of multiple data sets.
96State of Automotive Recalls Summit: Conclusions
• Record number of U.S. light vehicle recalls identified in 2018
• Light vehicle recall activity appears to be stabilizing: 25M – 30M vehicles affected per year
• Average recall size continues to decline – a sign that the industry is proactively identifying and
responding to defects
• Recall completion percentages continue to improve. Early results indicate that recalls initiated in 2018
are on track to exceed recent remedy completion experience.
• Regulatory focus
• Industry reaction to recent recall activity
• Software-based defects increased significantly in 2018, but provide more opportunities mitigating
exposure to remedy costs while enhancing remedy completion
• Engaging stakeholders and information sharing provides a path to recall remedy improvements
• An informed understanding of recall risk is enhanced by industry expertise and comprehensive analysis
of multiple sources of automotive component defect data
9798
Contact Information
For further information regarding this presentation please contact a Stout representative:

                     Robert Levine                                                   Raymond Roth
                     Senior Manager                                                  Director
                     +1.248.432.1294                                                 +1.248.432.1337
                     rlevine@stout.com                                               rlevine@stoutadvisory.com

                     Neil Steinkamp
                     Managing Director
                     +1.646.807.4229
                     nsteinkamp@stout.com

                                                                                                                 99
Footnotes
1 – https://www.fhwa.dot.gov/policyinformation/travel_monitoring/18novtvt/18novtvt.pdf
2 – https://www.statista.com/statistics/183505/number-of-vehicles-in-the-united-states-since-1990/
3 – https://www.bts.gov/content/average-age-automobiles-and-trucks-operation-united-states
4 – https://www.carfax.com/recall/
https://www.nhtsa.gov/equipment/takata-recall-spotlight
5 – https://www.nhtsa.gov/recall-spotlight/takata-air-bags
6 – https://www.nhtsa.gov/sites/nhtsa.dot.gov/files/documents/update_on_the_state_of_the_takata_airbag_recalls-tag_0.pdf
7 – https://www.transportation.gov/sites/dot.gov/files/docs/policy-initiatives/automated-vehicles/320711/preparing-future-
transportation-automated-vehicle-30.pdf
8 – Pennsylvania Department of Transportation Request for Information for Vehicle Platooning, RFI Number 3518RF101
9 – https://www.detroitnews.com/story/business/autos/general-motors/2018/01/12/gm-driverless-car-fleet-cruise-av/109381232/
10 – https://www.consumerreports.org/automotive-technology/automakers-embrace-over-the-air-updates-can-we-trust-digital-car-
repair/
11 – https://www.ntsb.gov/safety/safety-studies/documents/SIR1502.pdf
12 – https://www.nhtsa.gov/equipment/tires
13 – https://www.nhtsa.gov/DOT/NHTSA/NVS/Public%20Meetings/SAE/2010/MacIsaac_SAE2010.pdf
14 – http://www.tiresafetygroup.com/tires-expire-in-six-years/
100You can also read