Defect localization by an extended laser source on a hemisphere - Nature
←
→
Page content transcription
If your browser does not render page correctly, please read the page content below
www.nature.com/scientificreports
OPEN Defect localization by an extended
laser source on a hemisphere
Daniel Veira Canle1*, Joni Mäkinen1, Richard Blomqvist1, Maria Gritsevich1,2,3, Ari Salmi1 &
Edward Hæggström1
The primary goal of this study is to localize a defect (cavity) in a curved geometry. Curved topologies
exhibit multiple resonances and the presence of hotspots for acoustic waves. Launching acoustic
waves along a specific direction e.g. by means of an extended laser source reduces the complexity of
the scattering problem. We performed experiments to demonstrate the use of a laser line source and
verified the experimental results in FEM simulations. In both cases, we could locate and determine the
size of a pit in a steel hemisphere which allowed us to visualize the defect on a 3D model of the sample.
Such an approach could benefit patients by enabling contactless inspection of acetabular cups.
Acoustic wave generation and detection on curved geometries is challenging. Contacting techniques need to
be adapted to the sample shape to effectively transmit and receive acoustic energy. Coupling sound to a sample
may be hard e.g. when it is small or when sample access is restricted1. Furthermore, contacting transducers
modify the boundary conditions of the sample under inspection and they are prone to oscillation2. As a result,
both transmitted and received signals are distorted which make it hard to analyze the sample geometry. Practical
difficulties arising from curvature include geometric focusing, and dispersion of acoustic waves. Acoustic waves
generated on a spherical surface converge at the antipodal point. Measuring close to this focal point is desirable
in order to achieve a high signal-to-noise ratio. The drawback in this approach is the presence of large amplitude
gradients making the choice of exact measurement location critical to obtain repeatable results. Any recorded
echo is masked by resonances since spherical structures are resonant geometries for acoustic w aves3. Another
unique feature of closed geometries is the presence of whispering gallery waves also known as circumferential
waves. Circumferential waves, commonly used for pipe and cylinder i nspection4–8, circumnavigate the sample
multiple times and are characteristic of pipes and spheres3, 9–12. Compared to spheres, hemispheres add complex-
ity to the interpretation of wave propagation since acoustic waves reflect off their equator. The aim of this study
is to develop a method to visualize damage on a hemispherical shell.
Damage detection in shells is commonly done with Lamb waves. Their wave mode profile is defined with
respect to the mid-plane between the two boundaries13–19. Any tapering20 or curvature of the plate21–24 modifies
the symmetry plane of the particle displacement which alters the shape and cutoff frequencies of the acoustic
waves. Such modified Lamb waves are sometimes called quasi Lamb w aves21. Here we generate and detect Lamb
waves by laser ultrasound in a contactless manner. Laser ultrasonic methods can efficiently generate and detect
acoustic waves in a rapid manner with high bandwidth and spatial r esolution2. Specific sample regions can be
targeted by launching directed acoustic waves with extended laser sources22, 25, 26. This practice is commonplace
for inspection of p ipes5, 8, 27, 28 and Lamb waves are commonly used to characterize spherical s hells29. Here we
show an approach that benefits from a directed acoustic source to localize damage on a hemispherical shell.
Previously we showed that an extended line source combined with interferometric detection can locate holes
as small as (∼0.7λ) on steel shells18. Here, we demonstrate how the acoustic field interacts with the cavity and
we use this information to visualize the hole in a 3D model of the sample. This approach removes the need for
complex scanning t echniques30 and data interpretation based on mode c onversion31. Such a simple approach
could assist in the inspection of acetabular cups by characterizing their adhesion as well as the integrity of their
attachment points32–34.
Experiments
We developed the damage detection method by studying four stainless steel hemispherical shells (Ø = 50 mm
and 0.6 mm thickness). These structures featured holes with diameters of 9.5 mm, 4 mm, and 2 mm at a polar
angle θ = 45° whereas the last shell was pristine and served as a reference. We glued the samples to a 3D printed
1
Department of Physics, Division of Material Physics, Faculty of Science, University of Helsinki,
P.O.B. 64, 00014 Helsinki, Finland. 2Finnish Geospatial Research Institute, Geodeetinrinne 2, 02430 Masala,
Finland. 3Institute of Physics and Technology, Ural Federal University, Mira Str. 19, 620002 Ekaterinburg,
Russia. *email: daniel.veiracanle@helsinki.fi
Scientific Reports | (2021) 11:15191 | https://doi.org/10.1038/s41598-021-94084-w 1
Vol.:(0123456789)
www.nature.com/scientificreports/
Figure 1. Experimental setup for laser ultrasound measurements. Nd:YAG laser (blue) generates guided waves
on the sample whilst the laser Doppler vibrometer (LDV, red) detects them from the edge (a). The top view
(bottom half) illustrates how the sample and the defect (grey circle) rotate in relation to the LDV (dashed red
circle) and the Nd:YAG excitation laser (blue). A spherical (cylindrical) lens generates an acoustic point (line)
source at the apex of the sample, (b–d). For localization (e), an effective approach is to use a stationary line
source (c). We compare the acoustic directivity of the point and line sources on the hemispherical shell in the
supplementary material of this study.
Figure 2. Filtering to remove standing waves in the structure. Signal shape produced by a point excitation on
a damaged sample (a) and its frequency content (b). The raw signal (a, red, offset 6 nm for clarity) features a
resonance that masks the echo. A high pass Fourier filter ranging from 0.1 to 0.5 MHz (b) removes the standing
wave interference and reveals an echo (a, blue).
polylactic acid (PLA) holder with epoxy (Araldite® extra strong). The entire outer surface of the shell was attached
to the holder except for a 3 mm wide brim (Fig. 1).
The hemispherical shell completed three rotations (200 points per revolution, 1.8° per step) under non-
ablative pulsed illumination by a Q-switched Nd:YAG laser (CFR Big Sky Laser Series, 8 ns, 40 mJ per pulse,
3 Hz pulse repetition frequency, 12 pulses per step) whilst a Polytec OFV303 (OFV3001 controller) laser Doppler
Vibrometer (2 MHz bandwidth in displacement mode) detected the acoustic waves at 0.8 mm distance from
the edge of the sample. This approach generates acoustic maps by stacking signals of consecutive measurements
next to each other. MATLAB [MathWorks® R2018b] generated the acoustic maps by averaging 12 signals at every
point across the three rotations. To remove resonances which mask the acoustic waves, we filtered the data using
a Butterworth high-pass filter (sampling frequency 62.47 MHz for experiments and 100 MHz for simulations,
stop frequency = 0.1 MHz, pass frequency = 0.5 MHz). This approach reveals echoes carrying information about
scatterers present in the structure (Fig. 2).
To localize damage on a 3D model of the hemisphere, we calculated the group velocity of the A0 mode. An
algorithm extracted the time-of-arrival of the A0 mode from the data shown in Fig. 5b,e by finding the first peak
of the guided wave front (Fig. 5c,f). For every azimuth we calculated the acoustic power and determined the
-3 dB points (Fig. 5). These points delimit the boundaries of the pit of azimuthal coordinates φ1 and φ2 (Fig. 1e).
Scientific Reports | (2021) 11:15191 | https://doi.org/10.1038/s41598-021-94084-w 2
Vol:.(1234567890)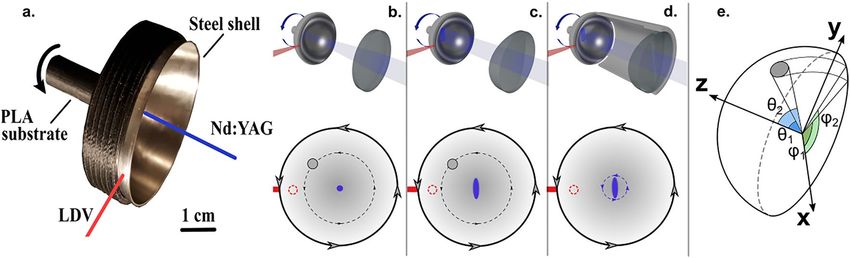
www.nature.com/scientificreports/
Figure 3. Comparison of a sample featuring a cavity (a) and the 3D model showing the localized defect (b).
The blue and red regions indicate the size and location of a 9.5 mm defect predicted by the FEM simulations
and the experimental results respectively. The translucent blue and red regions highlight the confidence limits of
the defect size obtained from the simulations and the experiments respectively. The small mismatch in the polar
direction might have been caused by a small offset produced when drilling the cavity.
We calculated the polar coordinates θ1 and θ2 from the propagation time of the echoes reflected from the defect
at φ = 102.8° and φ = 295.2° (Fig. 5c,f). The calculation of the width and length of the defect when knowing the
polar and azimuthal coordinates is straightforward and it is described in the calculations section of the supple-
mentary material (Supplementary Fig. S2).
Simulations
We recently did finite element method (FEM) simulations (COMSOL Multiphysics® v. 5.3a) of laser-generated
ultrasound on a hemispherical s hell35. We studied guided waves generated by a point source, their propagation
on an intact sample, and their interaction with a circular defect. In the present study we expand our simulations
to include the line excitation. Videos of the FEM simulations are provided in the supplementary material to this
work.
The simulation models were built the same way as i n35 for a 3D structure. COMSOL’s Heat Transfer Module
was coupled to the Solid Mechanics Module through thermal stresses in the time domain to generate propagat-
ing elastic waves. Both the point and line excitations were modelled as Boundary Heat Sources with profiles
corresponding to the ones used in the measurements. The boundary sources were defined as two perpendicular
Gaussian profiles. The line source had FWHMs of 0.90 mm (line width) and 7.8 mm (line length), and the point
source FWHM was 1 mm.
We determined the normal displacements at the surface of the sample at 1.85 mm distance from its edge and
we assumed a point-like detection.
Results
To localize the cavity on a 3D model of a hemisphere (Fig. 3), we first launched and detected the acoustic waves
from two points on the equator of the sample (Fig. 4). We chose this configuration due to ease of access, how-
ever this approach did provide insufficient information for calculating the polar angles of the defect. Instead,
we placed the detection point on the equator and the excitation location at the apex of the hemisphere. This
approach yielded acoustic maps (Fig. 5) showing echoes radiating from the scatterer which allowed us to estimate
the defect size and location (Table 1).
Discussion and conclusions
The defect localization (Fig. 3) is made possible by the extended laser source. Such an acoustic source generates
a planar wave package whose shadowing by a defect allows one to calculate the width of the region containing
the scatterer. The width of the smallest detectable defect is determined by the size of the line source and the size
of the scanning steps. In practice, this technique is applicable down to defect sizes equal to half the width of the
acoustic source (3.9 mm). This has been verified both numerically and experimentally by studying defects of sizes
down to 2 mm18 (Table 1, Supplementary Fig. S3). Each scanning step corresponded to an azimuthal rotation
of 1.8° or 0.6 mm at the defect location. The calculation of the length of the defect can be frustrated by the long
tails of the antisymmetric Lamb waves mode (Fig. 2). In our case, the tail from the direct wave would cover the
echo radiating from the defect if the distance from the detection point to the scatterer would be smaller than
3 mm. Beyond these limitations another fundamental limiting factor is the wavelength of the interferometer.
The OFV303 operated in displacement mode (2 MHz bandwidth) and considering the group velocity of the
antisymmetric mode (Supplementary Eq. S2), the detectability limit is roughly 1.5 mm.
A challenge of using laser interferometry for damage localization is laser alignment. To achieve a high signal-
to-noise ratio (SNR), the laser beam from the LDV must be perpendicular to the surface of the sample. The
shortest optimum distance for the OFV303 is 232 mm. The leverage caused by this distance means that a 11.4’ tilt
in the laser beam translates as a 1 mm distance on the surface of the sample. This is the reason why the distance
from the LDV to the brim of the hemisphere is different for simulations and experiments. We performed multiple
experiments to properly align the LDV and obtain a high SNR but decided not to repeat the simulations since
they are computationally heavy taking about a month of computer time in total.
In this study, the radius of the hemisphere is much larger than the central acoustic wavelength λ ∼ 3 mm.
Therefore, the impact of curvature on wave modes is negligible and we treat these vibrations as Lamb waves.
The uniqueness of the problem arises when the excitation and the detection locations lie on the equator at dia-
metrically opposite locations (Fig. 4). This region comprises a convergence point for acoustic waves, a point that
Scientific Reports | (2021) 11:15191 | https://doi.org/10.1038/s41598-021-94084-w 3
Vol.:(0123456789)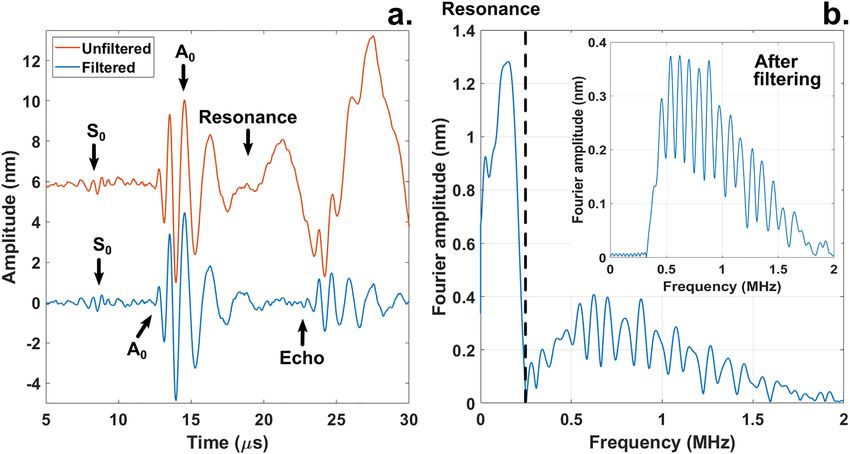
www.nature.com/scientificreports/
Figure 4. Detection of Lamb waves originated at the equator of the hemisphere. The Nd:YAG laser (dashed
blue ellipse) generated acoustic waves from the edge of the hemisphere and the LDV aimed at the opposite end
(dashed red circle) measured the vibrations (a,e). The acoustic maps consist of 200 signals stacked next to each
other where the x-axis represents the azimuthal angle, the y-axis the propagation time of the acoustic waves and
the color gradient the wave amplitude. Upper row: Lamb waves generated with a point laser source; Bottom
row: Lamb waves generated with a laser line source. Intact sample (b,f); damaged sample with a 9.5 mm pit,
experimental results (c,g) and FEM simulations (d,h). Data have been filtered to remove resonances. The laser
line source produces a planar wave front whose shadowing (g,h) highlights the presence of a defect. In this
configuration, there are insufficient data for calculating the polar angles since the echoes emanating from the
defect are not visible in the experimental context (g).
features large gradients in the acoustic field amplitude (Supplementary Video 1). Consequentially, even small
deviations in detection position make the experiment challenging to reproduce. Furthermore, our FEM simula-
tions show that due to the reflections from the equator at these wavelengths, there is a region where the surface
displacement is a node yielding low signal-to-noise ratio (Supplementary Fig. S2). We alleviated these issues by
selecting the apex of the hemisphere as the source of acoustic waves while keeping the detection location on the
brim of the hemisphere (Fig. 5).
Inspection of spheres and hemispheres suffer from interference caused by infinite paths of the same length
connecting the poles on the shell surface. Path selection by directed acoustic fields minimizes the multipath
interference. We further reduced this problem by moving the excitation location to the apex of the dome since,
in the case of hemispheres, multipath interference only emerges when the detection and the excitation locations
lie on the equator (Fig. 4).
As explained by S hui3, spheres are inherently resonant geometries for acoustic waves because of geometric
focusing. When acoustic attenuation is low, acoustic waves converge at the antipodal point and circulate the
surface of the hemisphere multiple times (Supplementary Video 2). Knowing the group velocity of the A0 mode,
the resonance frequency is approximately fres = cRA0 where cA0 and R are the group velocity of the A0 mode and
R the radius of the hemisphere. In our case fres = 120 kHz which is close to the observed value fres = 162 kHz.
One could incorrectly interpret resonant modes as propagating waves leading to wrong conclusions. Filtering the
data reveals an echo hiding under the resonance (Fig. 2). Knowing the time-of-flight of the echo and its angular
width allowed us to estimate the size of the defect as well as its location (Table 1).
Despite the limitations of the introduced technique, the proposed approach extracts enough information to
localize a defect in a 3D model of the sample (Fig. 3). Our method localized damage in curved geometries while
minimizing interference caused by curvature. The contactless nature of the technique preserves the information
of the propagating wave front since the sample boundaries are not loaded by contacting t ransducers2. Launch-
ing acoustic waves with an extended line source allowed us to localize a defect without the need of mapping the
acoustic field across the surface of the sample36. The inspection of curved structures with buried defects could
benefit from these advantages since it could be possible to image defects despite access being restricted29, 32.
Scientific Reports | (2021) 11:15191 | https://doi.org/10.1038/s41598-021-94084-w 4
Vol:.(1234567890)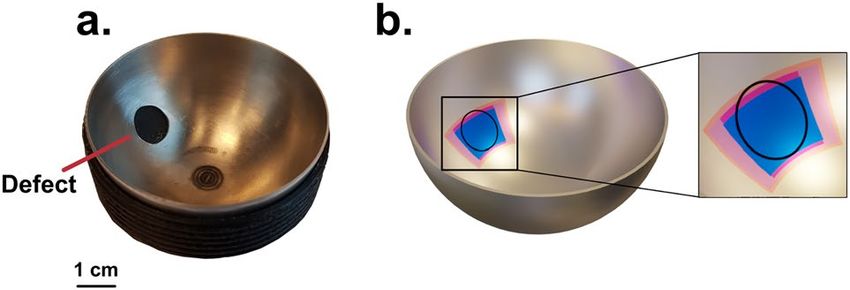
www.nature.com/scientificreports/

                                  Figure 5.  Detection of Lamb waves originated from the apex of the hemisphere. The acoustic maps (a,b,d,e)
                                  consist of 200 signals stacked next to each other where the x-axis represents the azimuthal angle, the y-axis the
                                  propagation time of the acoustic waves and the color gradient the wave amplitude. First row: Experimental
                                  results; second row: simulation results (a,d point source, b,e line source). c,f: echoes arising from a 9.5 mm
                                  defect on a laser line source scan at φ = 102.8° and its antipodal location φ = 295.2°. The black lines in (b,e)
                                  represent the acoustic power at different azimuths. The horizontal white lines represent its mean value across
                                  the undamaged region while the vertical lines are the −3 dB points. Data have been filtered to remove standing
                                  waves.

                       9.5 mm defect                                4 mm defect                                      2 mm defect
                                                                      Polar angles (°)

                                                                        Azimuths (°)

                                                                                                              -                        -

            Length, l (mm)        Width, w (mm)       Length, l (mm)         Width, w (mm)             Length, l (mm)           Width, w (mm)

                                                                                                                                       -

                                  Table 1.  Defect location and size in the true location, simulated, and experimental cases for the 9.5 mm, 4 mm
                                  and 2 mm holes. From top to bottom, expected (green), experimental (orange), and simulation results (blue).
                                  Length and width are the dimensions of the sector containing the defect along both, the azimuthal and polar
                                  directions (Fig. 1e). The azimuthal coordinates as well as the width for the 2 mm defect in the experimental
                                  case are missing since there was no visible shadowing of the acoustic waveforms by the cavity (Supplementary
                                  Fig. S3). The magnitudes feature confidence limits of one standard deviation. The corresponding uncertainty
                                  calculations are presented in the supplementary material.

Scientific Reports |   (2021) 11:15191 |               https://doi.org/10.1038/s41598-021-94084-w                                                     5

                                                                                                                                              Vol.:(0123456789)
www.nature.com/scientificreports/
Received: 25 April 2021; Accepted: 5 July 2021
References
1. Canle, D. V., Salmi, A. & Haeggstrom, E. Flaw detection in rotating structures by Lamb waves. in 2016 IEEE International Ultrason-
ics Symposium (IUS) 1–3 (IEEE, 2016). doi:https://doi.org/10.1109/ULTSYM.2016.7728645
2. C.B Scruby & L.E Drain. Laser ultrasonics, techniques and applications. NDT & E International 24, (2003).
3. Shui, Y., Royer, D., Dieulesaint, E. & Sun, Z. Resonance of surface waves on spheres. in Ultrasonics Symposium Proceedings 1,
343–346 (Publ by IEEE, 1988).
4. Leonard, K. R. & Hinders, M. K. Lamb wave tomography of pipe-like structures. Ultrasonics 43, 574–583 (2005).
5. Gao, W., Glorieux, C. & Thoen, J. Study of circumferential waves and their interaction with defects on cylindrical shells using
line-source laser ultrasonics. J. Appl. Phys. 91, 6114 (2002).
6. Valle, C., Niethammer, M., Qu, J. & Jacobs, L. J. Crack characterization using guided circumferential waves. J. Acoust. Soc. Am.
110, 1282–1290 (2001).
7. Clorennec, D. & Royer, D. Analysis of surface acoustic wave propagation on a cylinder using laser ultrasonics. Appl. Phys. Lett. 82,
4608–4610 (2003).
8. Lee, J.-H. & Lee, S.-J. Application of laser-generated guided wave for evaluation of corrosion in carbon steel pipe. NDT E Int. 42,
222–227 (2009).
9. Abid, A., Pereira, D., Fernandes, J. C. & Belanger, P. Sensitivity study of ultrasonic guided waves to cortical bone mechanical
properties with axial and circumferential propagation. Acta Acust. united with Acust. 103, 421–429 (2017).
10. Li, Z., He, C., Liu, Z. & Wu, B. Quantitative detection of lamination defect in thin-walled metallic pipe by using circumferential
Lamb waves based on wavenumber analysis method. NDT E Int. https://doi.org/10.1016/j.ndteint.2018.11.005 (2019).
11. Park, J., Lee, J., Jeong, S. G. & Cho, Y. A study on guided wave propagation in a long distance curved pipe. J. Mech. Sci. Technol.
33, 4111–4117 (2019).
12. Clorennec, D. & Royer, D. Investigation of surface acoustic wave propagation on a sphere using laser ultrasonics. Appl. Phys. Lett.
85, 2435–2437 (2004).
13. Chang, Z. & Mal, A. Scattering of Lamb waves from a rivet hole with edge cracks. Mech. Mater. 31, 197–204 (1999).
14. McKeon, J. C. P. & Hinders, M. K. Lamb wave scattering from a through hole. J. Sound Vib. 224, 843–862 (1999).
15. Grahn, T. Lamb wave scattering from a circular partly through-thickness hole in a plate. Wave Motion 37, 63–80 (2003).
16. Yeasin Bhuiyan, M., Shen, Y. & Giurgiutiu, V. Interaction of Lamb waves with rivet hole cracks from multiple directions. Proc. Inst.
Mech. Eng. Part C J. Mech. Eng. Sci. 231, 2974–2987 (2017).
17. Diligent, O. & Lowe, M. J. S. Reflection of the s0 Lamb mode from a flat bottom circular hole. J. Acoust. Soc. Am. 118, 2869–2879
(2005).
18. Veira Canle, D., Makinen, J., Gritsevich, M., Salmi, A. & Haeggstrom, E. Localization of millimeter size defects in a steel hemi-
spherical shell. in IEEE International Ultrasonics Symposium, IUS 2019-Octob, 1575–1578 (IEEE Computer Society, 2019).
19. Viktorov, I. A. Rayleigh and Lamb Waves Physical Theory and Applications (Springer, 2014).
20. Nurmalia, N., Ogi, H., Hirao, M. & Nakahata, K. Mode conversion behavior of SH guided wave in a tapered plate. NDT E Int. 45,
156–161 (2012).
21. Fong, K. L. J. A Study of Curvature Effects on Guided Elastic Waves (Imperial College, 2005).
22. Hutchins, D. A., Dewhurst, R. J. & Palmer, S. B. Directivity patterns of laser-generated ultrasound in aluminum. Cit. J. Acoust. Soc.
Am. 70, 1362 (1981).
23. Royer, D., Dieulesaint, E., Jia, X. & Shui, Y. Optical generation and detection of surface acoustic waves on a sphere. Appl. Phys.
Lett. 52, 706–708 (1988).
24. Liu, G. & Qu, J. Guided circumferential waves in a circular annulus. J. Appl. Mech. 65, 424 (1998).
25. Aindow, A. M., Dewhurst, R. J. & Palmer, S. B. Laser-generation of directional surface acoustic wave pulses in metals. Opt. Com-
mun. 42, 116–120 (1982).
26. Kim, H., Jhang, K., Shin, M. & Kim, J. A noncontact NDE method using a laser generated focused-Lamb wave with enhanced
defect-detection ability and spatial resolution. NDT E Int. 39, 312–319 (2006).
27. Liu, X. K., Yang, S. X. & Liu, Y. Q. Numerical Study for Surface-breaking Crack Detection on a Cylinder Using Laser-generated
Ultrasound. in 2018 15th International Conference on Ubiquitous Robots, UR 2018 797–802 (Institute of Electrical and Electronics
Engineers Inc., 2018). https://doi.org/10.1109/URAI.2018.8441815
28. Cès, M., Royer, D. & Prada, C. Characterization of mechanical properties of a hollow cylinder with zero group velocity Lamb
modes. J. Acoust. Soc. Am. 132, 180–185 (2012).
29. Sugino, C., Ruzzene, M. & Erturk, A. Experimental and computational investigation of guided waves in a human skull. Ultrasound
Med. Biol. 47, 787–798 (2021).
30. McKie, A. D. W. & Addison, R. C. Laser-based ultrasonic inspection of complexly contoured rocket engine components. Review
of Progress in Quantitative Nondestructive Evaluation https://doi.org/10.1007/978-1-4615-5339-7_77 (2012).
31. Veira Canle, D., Salmi, A. & Hæggström, E. Non-contact damage detection on a rotating blade by Lamb wave analysis. NDT E Int.
92, 159–166 (2017).
32. Ahmed, G. A. et al. How screw connections influence the primary stability of acetabular cups under consideration of different
bone models. J. Orthop. 21, 302–308 (2020).
33. Alshuhri, A. A., Holsgrove, T. P., Miles, A. W. & Cunningham, J. L. Development of a non-invasive diagnostic technique for
acetabular component loosening in total hip replacements. Med. Eng. Phys. 37, 739–745 (2015).
34. Alshuhri, A. A., Holsgrove, T. P., Miles, A. W. & Cunningham, J. L. Non-invasive vibrometry-based diagnostic detection of
acetabular cup loosening in total hip replacement (THR). Med. Eng. Phys. 48, 188–195 (2017).
35. Mäkinen, J., Veira Canle, D., Blomqvist, R., Salmi, A. & Haeggström, E. Simulation of Laser-excited Surface Acoustic Waves
Traveling on A Hemispherical Steel Shell. in (COMSOL, 2018).
36. Selim, H. et al. Defect reconstruction by non-destructive testing with laser induced ultrasonic detection. Ultrasonics 101, 106000
(2020).
Author contributions
D.V.C. planned the experiments together with A.S. and J.M. R.B. prepared the samples and together with DVC
executed the experiments. D.V.C. analyzed the experimental data which was supported by J.M.’s FEM simula-
tions. D.V.C. and M.G. developed the equations that allowed localizing and sizing the defect. D.V.C. wrote the
first draft of the manuscript and J.M., M.G., A.S. and E.H. contributed to finalizing it for publication.
Funding
Open access funded by University of Helsinki Library.
Scientific Reports | (2021) 11:15191 | https://doi.org/10.1038/s41598-021-94084-w 6
Vol:.(1234567890)www.nature.com/scientificreports/
Competing interests
The authors declare no competing interests.
Additional information
Supplementary Information The online version contains supplementary material available at https://doi.org/
10.1038/s41598-021-94084-w.
Correspondence and requests for materials should be addressed to D.V.C.
Reprints and permissions information is available at www.nature.com/reprints.
Publisher’s note Springer Nature remains neutral with regard to jurisdictional claims in published maps and
institutional affiliations.
Open Access This article is licensed under a Creative Commons Attribution 4.0 International
License, which permits use, sharing, adaptation, distribution and reproduction in any medium or
format, as long as you give appropriate credit to the original author(s) and the source, provide a link to the
Creative Commons licence, and indicate if changes were made. The images or other third party material in this
article are included in the article’s Creative Commons licence, unless indicated otherwise in a credit line to the
material. If material is not included in the article’s Creative Commons licence and your intended use is not
permitted by statutory regulation or exceeds the permitted use, you will need to obtain permission directly from
the copyright holder. To view a copy of this licence, visit http://creativecommons.org/licenses/by/4.0/.
© The Author(s) 2021
Scientific Reports | (2021) 11:15191 | https://doi.org/10.1038/s41598-021-94084-w 7
Vol.:(0123456789)You can also read