Disentangling the AGN and Star-Formation connection using XMM-Newton
←
→
Page content transcription
If your browser does not render page correctly, please read the page content below
Astronomy & Astrophysics manuscript no. masoura_v7                                                                                 c ESO 2018
                                              July 6, 2018

                                                    Disentangling the AGN and Star-Formation connection using
                                                                          XMM-Newton
                                                              V. A. Masoura1, 2 , G. Mountrichas1 , I. Georgantopoulos1 , A. Ruiz1 , G. Magdis3 , M. Plionis1, 2

                                                    1
                                                        National Observatory of Athens, V. Paulou & I. Metaxa, 11532, Greece e-mail: vmasoura@noa.gr
                                                    2
                                                        Section of Astrophysics, Astronomy and Mechanics, Department of Physics, Aristotle University of Thessaloniki, 54 124, Thessa-
                                                        loniki, Greece
                                                    3
                                                        Dark Cosmology Centre, Niels Bohr Institute, University of Copenhagen, Juliane Mariesvej 30, DK-2100 Copenhagen, Denmark

                                                   July 6, 2018
arXiv:1807.01723v1 [astro-ph.GA] 4 Jul 2018

                                                                                                               ABSTRACT

                                                   There is growing evidence supporting the coeval growth of galaxies and their resident Super Massive Black Hole (SMBH). Most
                                                   studies also claim a correlation between the activity of the SMBH and the star-formation of the host galaxy. It is unclear, though,
                                                   whether this correlation extends to all redshifts and X-ray luminosities. Some studies find a weaker dependence at lower luminosities
                                                   and/or a suppression of the star-formation at high-luminosities. In this work, we use data from the X-ATLAS and XMM-XXL North
                                                   fields and compile the largest X-ray sample up to date, to investigate how X-ray selected AGN affect the star-formation of their host
                                                   galaxies in a wide redshift and luminosity baseline, i.e., 0.03 < z < 3 and log LX (2 − 10 keV) = (41 − 45.5) erg s−1 . Our sample
                                                   consists of 3336 AGN. 1872 X-ray objects have spectroscopic redshifts. For the remaining sources we calculate photometric redshifts
                                                   using TPZ, a machine-learning algorithm. We estimate stellar masses (M∗ ) and Star Formation Rates (SFRs) by applying SED fitting
                                                   through the CIGALE code, using optical, near-IR and mid-IR photometry (SDSS, VISTA, WISE). 608 of our sources also have far-IR
                                                   photometry (Herschel). We use these sources to calibrate the SFR calculations of the rest of our X-ray sample. Our results show a
                                                   correlation between the X-ray Luminosity (LX ) and the SFR of the host galaxy, at all redshifts and luminosities spanned by our sample.
                                                   We also find a dependence of the specific SFR (sSFR) on redshift, while there are indications that the X-ray luminosity enhances the
                                                   sSFR even at low redshifts. We then disentangle the effects of stellar mass and redshift on the SFR and study again its dependence
                                                   on the X-ray luminosity. Towards this end, we use the Schreiber et al. formula to estimate the SFR of main sequence galaxies that
                                                   have the same stellar mass and redshift as our X-ray AGN. Our analysis reveals that the AGN enhances the star-formation of its host
                                                   galaxy, when the galaxy lies below the main sequence and quenches the star-formation of the galaxy it lives in, when the host lies
                                                   above the main sequence. Therefore, the effect of AGN on the SFR of the host galaxy, depends on the location of the galaxy relative
                                                   to the main sequence.
                                                   Key words. Galaxies: active, Galaxies: evolution, Galaxies: star formation, Infrared: galaxies, X-rays: galaxies

                                              1. Introduction                                                           rounding star-forming material, arresting further star-formation
                                                                                                                        (quenching) and revealing the now unobscured AGN. Different
                                                  Most, if not all, galaxies host a Super Massive Black Hole            physical processes have been proposed to provide this quench-
                                              (SMBH) in their centre. The mass of this SMBH is correlated               ing. These mechanisms can be broadly divided into two cate-
                                              with the properties of its bulge, parametrised by the luminos-            gories (Gabor et al. 2010). Those that heat gas which then cannot
                                              ity (Magorrian et al. 1998), or the velocity dispersion (Ferrarese        collapse to form stars (preventative feedback), e.g. virial shock
                                              & Merritt 2000). When the material surrounding the galaxy is              heating (e.g. Birnboim & Dekel 2003), galaxy interactions (e.g.
                                              enough for the black hole to be fed, the galaxy is called active          Di Matteo et al. 2005) and those that expel the gas that could be
                                              and its centre, Active Galactic Nucleus (AGN). The AGN are                used to form stars (ejective feedback, Kereš et al. 2009). Differ-
                                              among the most luminous persistent sources in the Universe.               ent mechanisms prevail at high and low redshifts (Hopkins et al.
                                              Over the past twenty years, there has been growing evidence               2010). Therefore observational constraints on the AGN luminos-
                                              supporting the coeval growth of the galaxies and their resident           ity in relation to the star-formation activity can place important
                                              SMBH (Boyle & Terlevich 1998). This, suggests some causal                 constraints on the theoretical models.
                                              connection between the AGN and the star formation properties
                                              of the host galaxy (Alexander & Hickox 2012).
                                                   Theoretical and semi-analytical models of galaxy evolution,              The most straightforward way to study the effect of AGN
                                              through mergers, assume such a connection, where AGN feed-                on the star-formation of its host galaxy is to measure the star-
                                              back (the process by which the SMBH may moderate the growth               formation rate (SFR) as a function of the X-ray luminosity, LX .
                                              of its host) plays a catalytic role (Hopkins et al. 2006; Di Matteo       X-rays detect the activity of the central SMBH, and therefore
                                              et al. 2008). A model that has received particular interest, pro-         the X-ray luminosity is often used as a proxy of the AGN power
                                              poses that AGN are triggered by mergers (Hopkins et al. 2008).            (e.g., Lusso et al. 2012). Observations at X-ray wavelengths pro-
                                              According to this model, the main phase of AGN growth co-                 vide a quite efficient way of selecting AGN over a wide luminos-
                                              incides with host activity, which is likely to obscure the AGN.           ity baseline nearly independent of obscuration. Infrared obser-
                                              However, eventually the powerful AGN pushes away the sur-                 vations provide a nearly uncontaminated view of star formation
                                                                                                                                                                    Article number, page 1 of 9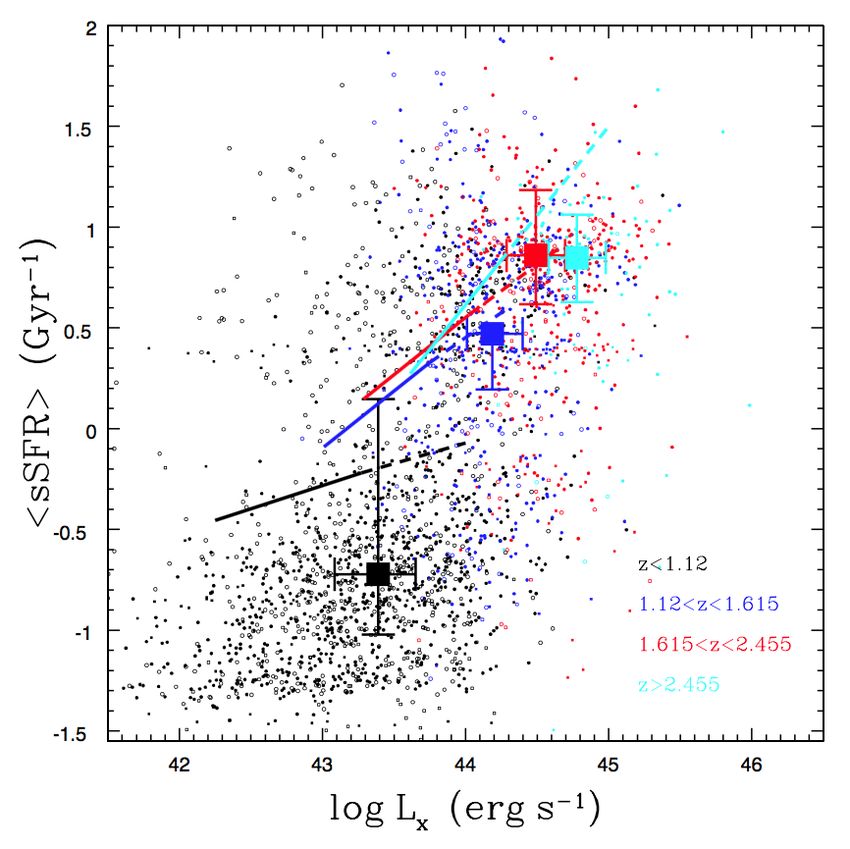
A&A proofs: manuscript no. masoura_v7

(SF), as these long wavelengths are dominated by dust emission       mid-IR and far-infrared photometry for these sources we cross-
from the host galaxy.                                                match the X-ray catalogue with the SDSS-DR13 (u, g, r, i, z;
    Several works have been done on the correlation between the      Albareti et al. 2015), the WISE (W1, W2, W3, W4; Wright et al.
AGN X-ray luminosity and the SFR. Some groups have reported          2010) and the VISTA-VIKING (J, H, K; Emerson et al. 2006;
a strong link between SF and AGN activity for high-luminosity        Dalton et al. 2006) catalogues. The crossmatch was performed
AGN, however at lower luminosities these correlations appear         using the ARCHES cross-correlation tool xmatch (Pineau et al.
relatively weak or absent (e.g. Lutz et al. 2010; Bonfield et al.    2017). This tool matches symmetrically an arbitrary number of
2011). Page et al. (2012) used data from CDFN and found a            catalogues providing a Bayesian probability of association or
positive correlation of SFR with LX , for log LX (2 − 10 keV) <      non-association. The cross-match reveals 1,031 sources with at
44 erg s−1 . However, their analysis reveals a suppression of star   least optical photometry (for more details see Mountrichas et al.
formation at higher X-ray luminosities. This quenching is in         2017).
agreement with theoretical models in which the AGN outflows
                                                                         To improve the accuracy of our star-formation rate estima-
expel the interstellar medium of the host galaxy (Di Matteo et al.
                                                                     tions, we also include, wherever available, far-IR photometry in
2005; Springel et al. 2005; Sijacki et al. 2007). This possible
                                                                     our SED fitting analysis. For that purpose, we cross-match the
suppression of the star-formation due to the AGN activity may
                                                                     1,031 sources with the Herschel Terahertz Large Area sample
also be the reason for the galaxies’ transition from the blue to
                                                                     (H-ATLAS).The H-ATLAS survey is the largest Open Time Key
the red cloud (Georgakakis et al. 2008). Harrison et al. (2012)
                                                                     Project carried out with the Herschel Space Observatory (Eales
combined sources from CDFN, CDFS and the COSMOS fields
                                                                     et al. 2010), covering an area of 600 deg2 in five far-infrared and
and their analysis revealed a dependence of the star-formation
                                                                     sub-mm bands, 100, 160, 250, 350 and 500 µm (Valiante et al.
with redshift. However, they did not detect any statistical sig-
                                                                     2016). 16 deg2 have been presented in the Science Demonstra-
nificant correlation between SFR and X-ray luminosity. Most
                                                                     tion Phase (SDP) catalogue (Rigby et al. 2011) and lie within
of these studies, though, suffer from low number statistics (see
                                                                     one of the regions observed by the Galaxy And Mass Assem-
Harrison et al. 2012). Brown et al. (2018) used 703 AGN with
                                                                     bly (GAMA) survey (Driver et al. 2011; Baldry et al. 2010). 65
log LX (2 − 10 keV) = (42 − 46) erg s−1 at 0.1 < z < 5 from the
                                                                     sources are common between our dataset and the H-ATLAS cat-
Chandra XBoötes X-ray Survey and found a dependence of the
                                                                     alogue.
star-formation of the host galaxy on X-ray luminosity. Lanzuisi
et al. (2017) used 692 AGN from the COSMOS field in the red-
shift range 0.1
Masoura et al.: The AGN and SFR connection

                                  (a)                                                                (b)

Fig. 1: Left: The redshift distribution of our 3336 X-ray sources. Right: The X-ray luminosity distribution of the 3336 AGN. Both
histograms have been normalized to the total number of sources.

                                                                   pose, we include only AGN with available at least WISE or
    46
                                                                   HERSCHEL photometry, in addition to optical photometry. We
                                                                   also exclude sources that have been optically classified as ex-
                                                                   tended and their photometric redshift (see Section 3.1), photoz,
                                                                   is photoz> 1 (Salvato et al. 2011). Moreover, we exclude AGN
    45                                                             that their SED fitting has estimated reduced χ2 , χ2red > 5 (see
                                                                   Section 3.2). This criterion is based on visual inspection of the
                                                                   SED fits. The final number of AGN are presented in Table 1. All
                                                                   our X-ray sources have log LX (2 − 10 keV) > 41.0 erg s−1 which
    44
                                                                   minimizes contamination from inactive galaxies. The distribu-
                                                                   tions of redshift and X-ray luminosity are presented in Figures
                                                                   1a and 1b, respectively, for our full X-ray sample.
                                                                       Various selection biases are introduced in our X-ray sam-
    43                                                             ple e.g., requirement for optical and mid-IR photometry, usage
                                                                   of photometric redshifts and data from wide area surveys com-
                                                                   pared to deeper fields (e.g. COSMOS, Chandra Deep Fields). It
                                                                   is not straightforward how these affect our measurements. For
    42                                                             instance, the SDSS requirement biases our sample against low
                                                                   luminosity sources, whereas the XXM-XXL allow us to include
                                                                   more high luminosity AGN in our dataset. Therefore, when pre-
         0   0.5     1      1.5         2   2.5     3      3.5     senting our measurements we also include estimations for the
                                                                   individual AGN, using different symbols/colours depending on
                                                                   available spectroscopy and/or photometry. Furthermore, we split
Fig. 2: The X-ray luminosity as a function of redshift for the     our final sample into many redshift bins to minimize any effect of
3336 X-ray AGN in our final sample. Sources in the XMM-XXL         possible incompleteness in the Lx-redshift plane (e.g. Figures 5,
field are shown in blue. AGN in the X-ATLAS field are presented    6, 7). These allow us to better assess whether and how selection
with green symbols. Sources with photoz are shown by empty         biases affect our calculations.
points and specz sources by filled points. AGN with available
                                                                        In Fig. 2 we present the X-ray luminosity as a function of
Herschel photometry are presented with squares whereas those
                                                                   redshift, for our final sample. Our dataset lacks low luminos-
without Herschel by circles.
                                                                   ity sources (log LX (2 − 10 keV) < 42.5 erg s−1 ) at z > 1. Re-
                                                                   stricting our X-ray catalogue to AGN with log LX (2 − 10 keV) >
2.3. Final Sample                                                  43.5 erg s−1 , reduces the number of sources to 2067, but our sam-
                                                                   ple is complete up to z ∼ 2.5. The effect of this incompleteness
In our analysis we use only those X-ray sources that have          is studied in Section 4.4 and is shown in Fig. 8 that presents the
the most accurate star-formation rate estimations. For that pur-   main results of this study.
                                                                                                           Article number, page 3 of 9
A&A proofs: manuscript no. masoura_v7

                                                                            Stellar attenuated
                                                                                                                            102                                                  Stellar attenuated
                                                                            Stellar unattenuated                                                                                 Stellar unattenuated
                                                                            Dust emission                                                                                        Dust emission
                        102                                                 AGN emission                                                                                         AGN emission
                                                                            Model spectrum                                                                                       Model spectrum
                                                                            Model fluxes                                                                                         Model fluxes
                                                                            Observed fluxes                                 101                                                  Observed fluxes

                        101

                                                                                                    Flux [mJy]
Flux [mJy]

                                                                                                                            100
                        100

                 10          1                                                                                       10          1
    Relative residual flux

                                                                                                        Relative residual flux
                             1                                                   (Obs-Mod)/Obs                                   1                                                    (Obs-Mod)/Obs

                             0                                                                                                   0
                             1                                                                                                   1
                                 100   101       102      103       104      105              106                                    100      101       102      103       104    105              106
                                             Observed wavelength [ m]                                                                               Observed wavelength [ m]
                                                      (a)                                                                                                   (b)

Fig. 3: SED fitting of an AGN with (left panel) and without (right panel) HERSCHEL photometry. The star-formation component
is plotted in red, the AGN component in green, the attenuated and the unattenuated stellar component described by the yellow and
the blue dashed line, respectively. The black solid line shows the best fit from CIGALE. The source lies at z = 0.986. When far-IR
photometry is included in the fitting analysis, CIGALE yields: χ2red = 2.54, log SFR = 2.49 M yr−1 and M? = 10.94 M . Without
HERSCHEL the corresponding values are: χ2red = 1.46, log SFR = 2.28 M yr−1 and M? = 11.05 M .

Table 1: The number of AGN with spectroscopic (specz) and photometric (photoz) redshifts, in the XMM-XXL and X-ATLAS
fields. In the parentheses we quote the number of X-ray sources with available Herschel photometry.

                                                                                     XMM-XXL                     X-ATLAS                   Total sources
                                                             specz sources           1849(338)                     23(3)                    1872(341)
                                                            photoz sources            1364(262)                   100(5)                    1464(267)
                                                             Total sources           3213(600)                    123(8)                    3336(608)

3. Analysis                                                                                           tometry, in addition to optical photometry (see Section 2.3).
                                                                                                      Thus, sources that their photoz has been estimated using only
3.1. Photometric Redshifts                                                                            optical photometry and therefore is less accurate (see Table 3 in
To perform an SED fitting analysis we need redshift information                                       Mountrichas et al. 2017) are excluded from our measurements.
for our X-ray sources. As mentioned in the previous Section,
2,512/5,294 AGN in the XXM-XXL field have available spec-                                             3.2. SFR and stellar mass estimations
troscopic redshifts (specz), while for the ∼ 1, 000 sources in the
X-ATLAS field we use the photoz catalogue presented in Moun-                                          In this Section, we describe the analysis followed to estimate the
trichas et al. (2017). For the remaining 2,782 X-ray sources in                                       star-formation rates and the stellar mass of our X-ray sources.
the XMM-XXL field, we estimate photometric redshifts using
TPZ, a publicly available, machine learning algorithm. The code
                                                                                                      3.2.1. SED fitting
and the technique it incorporates are described in detail in Car-
rasco Kind & Brunner (2013). In summary, the algorithm uses                                           To calculate star-formation rates and stellar masses for our X-
prediction trees and random forest techniques to generate photo-                                      ray AGN samples, we use the CIGALE code version 0.12 (Code
metric redshift Probability Density Functions (PDFs). As an em-                                       Investigating GALaxy Emission; Noll et al. 2009; Ciesla et al.
pirical technique it requires a dataset with reliable spectroscopy                                    2015). We provide CIGALE with multi-wavelength photometry
to train the algorithm before it is applied to our photometric X-                                     (see previous Section), as well as a list of possible values for
ray sample. We use the same training sample that Mountrichas                                          physical parameters, related to the star formation history, dust
et al. (2017) used to estimate photoz for the X-ray sources in                                        attenuation, nebular emission and AGN emission (Table 2). The
the X-ATLAS field and follow their analysis (see their Section                                        Fritz et al. (2006) library of templates is used to model the AGN
3 for more details). Based on their results, the estimated pho-                                       emission. The double-exponentially-decreasing (2τ-dec) model
tometric redshifts have a normalized absolute median deviation,                                       is assumed to convolve star-formation histories (Ciesla et al.
nmad ≈ 0.06, and a percentage of outliers, η = 10 − 14%, de-                                          2015). Our SFR estimations assume that all the far-IR emission
pending upon whether the sources are extended or point-like.                                          is due to dust., i.e., the AGN contribution is ignored. However,
    Although, we estimate photometric redshifts for the total of                                      this is not the case for powerful AGN (e.g. Symeonidis et al.
the 2,782 AGN, in our SED fitting analysis we include only                                            2016; Duras et al. 2017). This introduces a maximum offset of
sources that have available at least WISE or HERSCHEL pho-                                            30% to our SFR calculations (for more details see Section 3.2.3
Article number, page 4 of 9
Masoura et al.: The AGN and SFR connection
in Ciesla et al. 2015). The stellar population synthesis is mod-
4
elled using the Bruzual & Charlot (2003) template, adopting the
Salpeter template. Calzetti et al. (2000) and Dale et al. (2014)
templates are utilized for the dust extinction law and the ab- 3.5
sorbed dust reemitted in the IR. Fig. 3 presents two examples
of our SED fitting analysis. 3
2.5
3.2.2. Using Herschel photometry to calibrate SFR
estimations
2
As shown in Table 1, 608 out of the 3336 X-ray sources have ad-
ditional Herschel photometry available (PACS and SPIRE; 100, 1.5
160, 250, 350 and 500 µm). For those sources we perform an
SED fitting, following the analysis described in the previous
1
Section and estimate their SFR with and without the Herschel
bands. In the latter case, only SDSS and WISE bands are used
0.5
in the SED fitting. The comparison is shown in Fig. 4. Although
there is a small scatter in the measurements, that could be due
to statistical errors (CIGALE estimations) and/or the usage of 0
photometric redshifts for some sources, among others, we notice
a systematic offset in the measurements. SFR estimated with- -0.5
-0.5 0 0.5 1 1.5 2 2.5 3 3.5 4
out Herschel are underestimated compared to SFR calculations
including Herschel. Applying a χ2 fit we find that this offset is
best described by the following equation:
Fig. 4: Comparison of the SFR estimations with and without
log SFRnoHerschel + 0.12 ± 0.01 Herschel, for the 608 sources with available Herschel photom-
log SFRHerschel = . (1) etry. The black solid line is the 1-1 line and the blue dashed line
0.87 ± 0.03 the best-fit calibration line. Sources with photoz are shown by
The errors on the best-fit parameters represent the 1 σ uncertain- blue, empty circles and specz sources by filled circles.
ties. Based on the above equation, the corresponding uncertainty
on the calculated SFRHerschel due to the scatter is < 10%. Al-
though, in our analysis, we use this equation to correct the SFR host galaxy. SFR are estimated by CIGALE through the SED
estimations for those sources that do not have far-IR photome- fitting. LX (observed) are estimated in the hard energy band
try available, we also present separately our results for sources (2 − 10 keV) using the available flux estimations of the sources.
with and without available Herschel photometry. The inclusion Our measurements are presented in the left panel of Fig. 5. In-
of the (calibrated) non-Herschel SFR estimations significantly dividual sources are shown with small circles and squares for
increases the size of our X-ray sample without affecting nega- sources with and without Herschel photometry available, respec-
tively our measurements and alter our conclusions. tively. We also compute median LX in bins of SFR, indicated by
the filled squares (median SFR values are shown). Our results
show a dependence of the SFR on LX , in the whole redshift and
4. Results and Discussion
luminosity range, spanned by our sample.
In this Section, we use the X-ray luminosity as a proxy of the In the same Figure, we also plot the binned SFR vs. LX mea-
AGN power to study how an active supermassive black hole af- surements from Brown et al. (2018) (polygons) and Lanzuisi
fects the Star-Formation of its host galaxy. For that purpose we et al. (2017) (triangles). Brown et al. (2018) used 703 AGN with
estimate the dependence of SFR on X-ray luminosity (Section log LX (2 − 10 keV) = (42 − 46) erg s−1 at 0.1 < z < 5 from
4.1). Then, we divide the SFR of the galaxy by its stellar mass the Chandra XBoötes X-ray Survey and found a dependence of
to derive the specific SFR and study its dependence on the AGN the star-formation of the host galaxy on X-ray luminosity. Their
power (Section 4.2). Previous works have estimated the evolu- SFR measurements are consistent with our estimations. Lanzuisi
tion of SFR with M? for star-forming galaxies (e.g. Schreiber et al. (2017) used 692 AGN from the COSMOS field in the
et al. 2015). We perform a similar analysis using our X-ray redshift range 0.1A&A proofs: manuscript no. masoura_v7
(a) (b)
Fig. 5: Left: Distribution of AGN X-ray Luminosity versus SFR. Dots are individual AGN. Sources with photoz are shown by
empty points and specz sources by filled points. AGN with available Herschel photometry are presented with squares whereas those
without Herschel by circles. Big squares refer to our binned results (median SFR and LX values are shown, in bins of SFR) and the
errorbars represent the 1σ dispersion of each bin. Triangles and polygons show the results from Lanzuisi et al. (2017) and Brown
et al. (2018), respectively. The symbols are colour coded based on their redshifts z>0.4 blue, 0.4 2.5), our estima- low a fair comparison with the results of Schreiber et al. (2015)
tions (cyan point) appear lower compared to the Rovilos et al. (open squares). Although our mean SFR estimations for the X-
measurements. However, as previously mentioned, their sample ray AGN are higher compared to the SFR of star-forming galax-
spans lower redshift and X-ray luminosities compared to ours ies, with the exception of low redshifts (z< 0.7), our results are in
Article number, page 6 of 9Masoura et al.: The AGN and SFR connection
Table 2: The models and the values for their free parameters used by CIGALE for the SED fitting of our X-ray samples. τ is the
e-folding time of the main stellar population model in Myr, age is the age of the main stellar population in the galaxy in Myr (the
precision is 1 Myr), burst age is the age of the late burst in Myr (the precision is 1 Myr). β and γ are the parameters used to define
the law for the spatial behaviour of density of the torus density. The functional form of the latter is ρ(r, θ) ∝ rβ e−γ|cosθ| , where r and θ
are the radial distance and the polar distance, respectively. Θ is the opening angle and Ψ the viewing angle of the torus. Type-2 AGN
have Ψ = 0 and Type-1 AGN have Ψ = 90. The AGN fraction is measured as the AGN emission relative to infrared luminosity
(1 − 1000 µm).
Parameter Model/values
Stellar population synthesis model
Initial Mass Function Salpeter
Metallicity 0.02 (Solar)
Single Stellar Population Library Bruzual & Charlot (2003)
double-exponentially-decreasing (2τ-dec) model
τ 100, 1000, 5000, 10000
age 500, 2000, 5000, 10000, 12000
burst age 100, 200, 400
Dust extinction
Dust attenuation law Calzetti et al. (2000)
Reddening E(B-V) 0.01, 0.1, 0.3, 0.5, 0.8, 1.2
E(B-V) reduction factor between old and young stellar population 0.44
Fritz et al. (2006) model for AGN emission
Ratio between outer and inner dust torus radii 10, 60, 150
9.7 µm equatorial optical depth 0.1, 0.3, 1.0, 2.0, 6.0, 10.0
β -0.5
γ 0.0, 2.0, 6.0
Θ 100
Ψ 0.001, 10.10, 20.10, 30.10, 40.10, 50.10, 60.10, 70.10, 80.10, 89.99
AGN fraction 0.1, 0.2, 0.3, 0.5, 0.6, 0.8
Fig. 7: Mean star formation rate versus M∗ for our sample (filled
squares) and for observed star-forming galaxies (open squares;
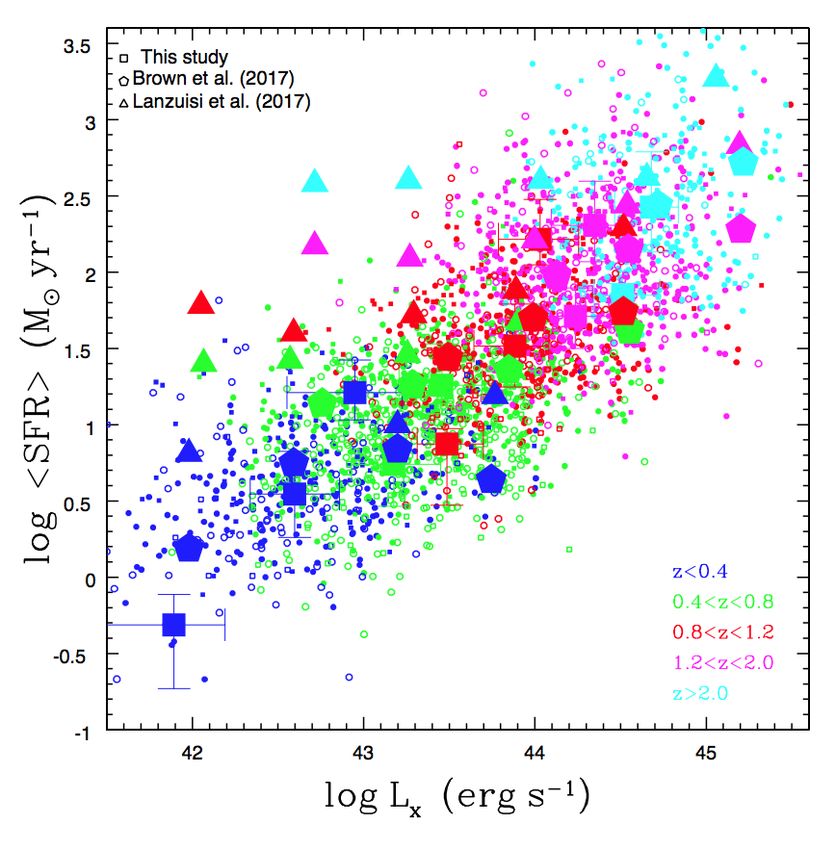
Fig. 6: Specific star-formation rate against X-ray luminosity for Schreiber et al. 2015).
our AGN sample. The black, blue, red and cyan symbols refer
to z < 1.120, 1.120 < z < 1.615, 1.615 < z < 2.455 and z >
2.455, respectively. Solid lines present the Rovilos et al. (2012)
estimations while the dashed lines show their extrapolation to very good agreement with the trends found by Schreiber et al. for
higher luminosities. the star-forming galaxies. Specifically, at low redshifts (z< 1.8)
SFR increases with M∗ for low stellar masses and then reaches
Article number, page 7 of 9A&A proofs: manuscript no. masoura_v7
(a) (b)
Fig. 8: The binned results of the normalized SFR as function of the median AGN X-ray Luminosity, in bins of normalized SFR.
Left: Filled circles present the measurements for the 3336 sources. Open squares show our estimations when we restrict our sample
to those X-ray AGN with log LX (2 − 10 keV) > 43.5 erg/s, to account for the Lx-z incompleteness of our dataset (see Fig. 2 and
text for more details). Right: Our results for the 608/3336 AGN with available Herschel photometry (filled squares). Open squares
show our measurements for the 381 sources with Herschel photometry and log LX (2 − 10 keV) > 43.5 erg/s. In both panels the
dashed line corresponds to AGN in the main sequence. Above this line, AGN have SFR enhanced compared to star-formation main
sequence galaxies of the same stellar mass and redshift. Below the dashed line, AGN have SFR that is suppressed compared to main
sequence galaxies of the same mass and redshift. Based on our results, the AGN enhances the star-formation of its host galaxy,
when the latter lies below the main sequence (below the dashed line) and quenches the star-formation of the galaxy it lives in, when
the host lies above the main sequence (above the dashed line).
a plateau for higher M? . At higher redshifts the SFR increases These measurements are presented with open symbols. For AGN
nearly linearly with M? . below the galaxy main sequence, i.e., below the dashed line,
we notice that as the AGN power (LX ) increases, the SFRnorm
increases. For AGN above the main sequence, as we move to
4.4. Disentangling the effects of M? and redshift on the SFR more powerful AGN (higher X-ray luminosities), the SFRnorm
Motivated by the results of the previous Sections, i.e., the strong decreases. Based on our results, the picture that emerges is that
dependence of SFR on M? and redshift, we disentangle the ef- AGN enhances the star-formation of its host galaxy, when the
fects of these parameters on SFR. Towards this end, we com- latter lies below the main sequence (below the dashed line in Fig.
pare the SFR of our X-ray AGN with the SFR of main sequence 8) and quenches the star-formation of the galaxy it lives in, when
galaxies with the same stellar mass and redshift. The latter is the host lies above the main sequence (above the dashed line).
estimated using equation 9 in Schreiber et al. (2015): Therefore, the effect of AGN on the SFR of the host galaxy, de-
pends on the location of the galaxy relative to the main sequence.
This trend is still detectable when we restrict our sample to the
log10 (SFRMS [M /yr]) = m − m0 + a0 r more luminous sources, i.e., log LX (2 − 10 keV) > 43.5 erg/s, to
account for the lack of faint sources at high redshifts (open sym-
−a1 max(0, m − m1 − a2 r) 2 ,
(2) bols). Based on these tests we conclude, that the observed trend
cannot be attributed to a selection bias that affects our measure-
with m0 = 0.5±0.07, a0 = 1.5±0.15, a1 = 0.3±0.08, m1 = 0.36± ments. Instead, is the result of disentangling the effect of M? and
0.3 and a2 = 2.5 ± 0.6. r and m are defined as: r ≡ log10 (1 + z) redshift from the SFR of galaxies that host X-ray AGN.
and m ≡ log10 (M∗ /109 M )
We then define the normalized SFR, as the ratio of the SFR
of X-ray AGN to the SFR of galaxies in the main sequence. Our 5. Summary and Conclusions
measurements, in bins of normalized SFR, are presented in Fig.
8. To test whether the incompleteness of our sample in the Lx-z Using data from the XMM-XXL North and X-ATLAS fields,
plane (see Section 2.3) affects our measurements, we also apply that cover more than 50 deg2 , we have composed the largest X-
a luminosity cut to our data, i.e., log LX (2−10 keV) > 43.5 erg/s. ray AGN sample in the literature to perform SED fitting anal-
Article number, page 8 of 9Masoura et al.: The AGN and SFR connection
ysis and study the effect of X-ray AGN on the star-formation serendipitous source catalogue compiled by the 10 institutes of the XMM-
rate of their host galaxies. Our sample consists of 3,336 X- Newton Survey Science Centre selected by ESA.
This work is based on observations made with XMM-Newton, an ESA science
ray sources, 608 of which have available Herschel photometry mission with instruments and contributions directly funded by ESA Member
and 1,872/3,336 have spectroscopic redshifts. We estimate star- States and NASA.
formation rates and stellar mass utilizing the CIGALE code. Us- Funding for the Sloan Digital Sky Survey IV has been provided by the Alfred
ing far-IR photometry (Herschel) wherever available we derive a P. Sloan Foundation, the U.S. Department of Energy Office of Science, and the
relation and calibrate the SFR estimations of those sources with- Participating Institutions. SDSS-IV acknowledges support and resources from
the Center for High-Performance Computing at the University of Utah. The
out Herschel observations. SDSS web site is www.sdss.org.
Our analysis reveals a dependence of the SFR of AGN host SDSS-IV is managed by the Astrophysical Research Consortium for the
galaxies with the AGN power (X-ray luminosity), at all redshift Participating Institutions of the SDSS Collaboration including the Brazilian
Participation Group, the Carnegie Institution for Science, Carnegie Mellon
and luminosity ranges spanned by our samples, i.e., 0.3 < z < 3 University, the Chilean Participation Group, the French Participation Group,
and 41 < log LX (2 − 10 keV) < 45.5 erg/s (Fig. 5). This result Harvard-Smithsonian Center for Astrophysics, Instituto de Astrofísica de
is in agreement with recent observation studies that used large Canarias, The Johns Hopkins University, Kavli Institute for the Physics
X-ray samples, i.e, Brown et al. (2018), Lanzuisi et al. (2017). and Mathematics of the Universe (IPMU) / University of Tokyo, Lawrence
However, the Lanzuisi et al. measurements appear higher com- Berkeley National Laboratory, Leibniz Institut für Astrophysik Potsdam (AIP),
Max-Planck-Institut für Astronomie (MPIA Heidelberg), Max-Planck-Institut
pared to our and Brown et al. results. Comparison of our find- für Astrophysik (MPA Garching), Max-Planck-Institut für Extraterrestrische
ings with theoretical predictions (Hickox et al. 2014) shows that Physik (MPE), National Astronomical Observatories of China, New Mexico
although our measurements show a stronger dependence of the State University, New York University, University of Notre Dame, Observatário
SFR on LX , our results are consistent with these predictions. Nacional / MCTI, The Ohio State University, Pennsylvania State University,
Shanghai Astronomical Observatory, United Kingdom Participation Group,
Furthermore, we find that the sSFR of the AGN host galaxies Universidad Nacional Autónoma de México, University of Arizona, University
increases with redshift, while there are indications that the X-ray of Colorado Boulder, University of Oxford, University of Portsmouth, Univer-
luminosity enhances the sSFR of the host galaxy. Our results are sity of Utah, University of Virginia, University of Washington, University of
Wisconsin, Vanderbilt University, and Yale University.
in agreement with the findings from Rovilos et al. (2012). Also, This publication makes use of data products from the Wide-field Infrared Survey
we find hints, that the sSFR-L x dependence holds at low redshifts Explorer, which is a joint project of the University of California, Los Angeles,
(z< 1; Fig. 6). and the Jet Propulsion Laboratory/California Institute of Technology, funded by
Following the work that has been done on star-forming the National Aeronautics and Space Administration.
The VISTA Data Flow System pipeline processing and science archive are
galaxies (Schreiber et al. 2015), we study the evolution of SFR described in Irwin et al. (2004), Hambly et al. (2008) and Cross et al. (2012).
with M? and redshift for our X-ray sources. Our results show Based on observations obtained as part of the VISTA Hemisphere Survey, ESO
that the SFR-M? evolution for the X-ray AGN shows simi- Program, 179.A-2010 (PI: McMahon). We have used data from the 3rd data
lar trends with these found for star-forming galaxies (Fig. 7). release.
Specifically, at low redshifts (z < 1.8) SFR increases with M?
for low stellar masses and then reaches a plateau for higher M? .
At higher redshifts the SFR increases nearly linearly with stellar
mass. We also find that, the mean SFR of AGN are higher to SFR References
of star-forming galaxies, at z > 0.7.
Albareti, F. D., Comparat, J., Gutiérrez, C. M., et al. 2015, MNRAS, 452, 4153
Prompted by the SFR-M? evolution with redshift we disen- Alexander, D. M. & Hickox, R. C. 2012, NewAR, 56, 93
tangle the effects of M? and redshift on the SFR. For that pur- Baldry, I. K., Robotham, A. S. G., Hill, D. T., et al. 2010, MNRAS, 404, 86
pose, we use the formula of Schreiber et al. (2015) to estimate Birnboim, Y. & Dekel, A. 2003, MNRAS, 345, 349
the SFR of main sequence galaxies that have the same stellar Bonfield, D. G. et al. 2011, MNRAS, 416, 13
Boyle, B. J. & Terlevich, R. J. 1998, MNRAS, 293, 49
mass and redshift with our X-ray AGN. We reduce the effects of Brown, A., Nayyeri, H., Cooray, A., et al. 2018, eprint arXiv:1801.02233
incompleteness of our sample on our measurements, by exclud- Bruzual, G. & Charlot, S. 2003, MNRAS, 344, 1000
ing low X-ray luminosity sources from our AGN dataset. Our Calzetti, D., Armus, L., Bohlin, R. C., et al. 2000, ApJ, 533, 682
analysis reveals that the AGN enhances the star-formation of its Carrasco Kind, M. & Brunner, R. J. 2013, MNRAS, 432, 1483
host galaxy, when the latter lies below the main sequence and Ciesla, L. et al. 2015, A&A, 576, 19
Cross, N. J. G. et al. 2012, A&A, 548, 21
quenches the star-formation of the galaxy it lives in, when the Dale, D. A., Helou, G., Magdis, G. E., et al. 2014, ApJ, 784, 83
host lies above the main sequence. Therefore, the effect of AGN Dalton, G. B., Caldwell, M., Ward, A. K., et al. 2006, SPIE, 6269
on the SFR of the host galaxy, depends on the location of the Di Matteo, T., Colberg, J., Springel, V., Hernquist, L., & Sijacki, D. 2008, ApJ,
galaxy relative to the main sequence (Fig. 8). 676, 33
Di Matteo, T., Springel, V., & Hernquist, L. 2005, Nature, 433, 604
Our study shows that discrepancies found among the results Driver, S. P., Hill, D. T., Kelvin, L. S., et al. 2011, MNRAS, 413, 971
of previous studies, regarding the effect of AGN on the host Duras, F. et al. 2017, A&A, 604, 19
galaxy star-formation, can be mitigated when large X-ray sam- Eales, S., Dunne, L., Clements, D., et al. 2010, PASP, 122, 499
ples are used in the analysis. Even more importantly, it is essen- Emerson, J., McPherson, A., & Sutherland, W. 2006, Msngr, 126, 41
tial to disentangle the effects of stellar mass and redshift on SFR Ferrarese, L. & Merritt, D. 2000, ApJ, 539, 9
Fritz, J., Franceschini, A., & Hatziminaoglou, E. 2006, MNRAS, 166, 767
when we study the role of the AGN on the star-formation of its Gabor, J. M., Davé, R., Finlator, K., & Oppenheimer, B. D. 2010, MNRAS, 407,
host galaxy. When this is taken into account then a complex rela- 749
tion between the AGN and the host galaxy is revealed. AGN can Georgakakis, A., Gerke, B. F., Nandra, K., et al. 2008, MNRAS, 391, 183
either enhance or quench the star-formation depending on how Georgakakis, A. & Nandra, K. 2011, ArXiv: 1101.4943 [arXiv:1101.4943]
powerful the AGN is. Georgakakis, A. et al. 2017, MNRAS, 469, 3232
Hambly, N. C. et al. 2008, MNRAS, 384, 637
Acknowledgements. The authors are grateful to the anonymous referee for Harrison, C. M. et al. 2012, ApJL, 760, 5
helpful comments. GM acknowledges financial support from the AHEAD Hickox, R. C., Mullaney, J. R., Alexander, D. M., et al. 2014, ApJ, 782, 11
project, which is funded by the European Union as Research and Innovation Hopkins, P. F., Hernquist, L., Cox, T. J., & Keres, D. 2008, ApJS, 175, 356
Action under Grant No: 654215. ACR acknowledges financial support by the Hopkins, P. F., Hernquist, L., Cox, T. J., et al. 2006, ApJ, 639, 700
European Space Agency (ESA) under the PRODEX program. Hopkins, P. F. et al. 2010, ApJ, 724, 915
This research has made use of data obtained from the 3XMM XMM-Newton Irwin, M. J. et al. 2004, SPIE, 5493, 411
Article number, page 9 of 9A&A proofs: manuscript no. masoura_v7 Kereš, D., Katz, N., Davé, R., Fardal, M., & Weinberg, D. H. 2009, MNRAS, 396, 2332 Lanzuisi, G. et al. 2017, A&A, 602, 13 Liu, Z., Merloni, A., Georgakakis, A., et al. 2016, MNRAS, 459, 1602 Lusso, E. et al. 2012, MNRAS, 425, 623 Lutz, D. et al. 2010, ApJ, 712, 1287 Magorrian, J. et al. 1998, AJ, 115, 2285 Menzel, M.-L., Merloni, A., Georgakakis, A., et al. 2016, MNRAS, 457, 110 Mountrichas, G., Corral, A., Masoura, V. A., et al. 2017, A&A, 608, 39 Noll, S. et al. 2009, A&A, 507, 1793 Oliver, S. J. et al. 2012, MNRAS, 424, 1614 Page, M. J. et al. 2012, nat, 485, 213 Pierre, M. et al. 2016, A&A, 592, 1 Pineau, F. X. et al. 2017, A&A, 597, 28 Ranalli, P., Georgantopoulos, I., Corral, A., et al. 2015, A&A, 577, 10 Rigby, E. E., Maddox, S. J., Dunne, L., et al. 2011, MNRAS, 415, 2336 Rovilos, E. et al. 2012, A&A, 546, 16 Salvato, M. et al. 2011, ApJ, 742, 61 Schreiber, C. et al. 2015, A&A, 575, 29 Sijacki, D., Springel, V., & Di Matteo, T. 2007, MNRAS, 380, 877 Springel, V. et al. 2005, nat, 435, 629 Sutherland, W. & Saunders, W. 1992, MNRAS, 259, 413 Symeonidis, M., Giblin, B. M., Page, M. J., et al. 2016, MNRAS, 459, 257 Valiante, E., Smith, M. W. L., Eales, S., et al. 2016, MNRAS, 462, 3146 Wright, E. L., Eisenhardt, P. R. M., Mainzer, A. K., et al. 2010, AJ, 140, 1868 Article number, page 10 of 9
You can also read