Graphene based autonomous pyroelectric system for near field energy conversion
←
→
Page content transcription
If your browser does not render page correctly, please read the page content below
www.nature.com/scientificreports
OPEN Graphene‑based autonomous
pyroelectric system for near‑field
energy conversion
Ivan Latella1* & Philippe Ben‑Abdallah2*
In the close vicinity of a hot solid, at distances smaller than the thermal wavelength, a strong
electromagnetic energy density exists because of the presence of evanescent field. Here we introduce
a many-body conversion principle to harvest this energy using graphene-based pyroelectric conversion
devices made with an active layer encapsulated between two graphene field-effect transistors which
are deposited on the source and on the cold sink. By tuning the bias voltage applied to the gates
of these transistors, the thermal state and the spontaneous polarization of the active layer can be
controlled at kHz frequencies. We demonstrate that the power density generated by these conversion
systems can reach 130 mW cm−2 using pyroelectric Ericsson cycles, a value which surpasses the current
production capacity of near-field thermophotovoltaic conversion devices by more than three orders of
magnitude with low grade heat sources (T < 500 K ) and small temperature differences ( T ∼ 100 K ).
Over 60% of energy used in industry is lost as low grade waste heat. This heat constitutes an important source of
available renewable energy. Unfortunately, few thermodynamic cycles can operate at low temperature streams
effectively1. Thermophotovoltaic2 (TPV) generation of electricity from thermal radiation emitted by hot sources
was expected to play a major role in harvesting this waste heat. However, the energy flux exchanged between the
primary source and the cell in these devices is intrinsically limited by the Stefan–Boltzmann law (i.e. the heat flux
exchanged between two blackbodies), setting so a relatively low upper b ound3 for the generated power. In the
70’s, an important step forward has been taken to improve the performances of this technology. Indeed, when
the source and the cell are separated by a subwavelength distance, the near-field e nergy4 can be transferred to
the cell by the tunneling of non-propagating photons5–8, so that the heat flux can largely exceed the limit set by
the blackbody theory. This energy transfer in the near-field regime paved the way for a novel technology, the
so-called near-field t hermophotovoltaic9–12 (NTPV) energy conversion. Although theoretically this technology
can lead to a generated power of about 1W cm−2 with heat sources at T > 500K and separation distances with
the cell of few hundred nanometers (10 W cm−2 being today the energy demand of a household in US), several
hurdles still limit today its development and massive deployment. One of the main limitations is the mismatch
between the emission frequency of evanescent modes supported by the source and the gap frequency of the
junction, the frequency below which the photon energy is dissipated as heat into the cell, reducing dramatically
its performance. So, despite its theoretical potential, only generated powers of few µW cm−2 were r eported11, 12
so far with such devices and heat sources around T = 500K.
In 2010, Fang et al.13 proposed an alternative way to harvest the near-field thermal energy by using a pyro-
electric converter. In this technology, an active layer made with a pyroelectric material undergoes a temporal
variation of its temperature in response to a periodic modulation of the separation distance between this layer
and two external thermostats (the hot source and the cold sink). With a distance of 100 nm, an operating fre-
quency of a few Hz and an electric power of 6.5mW cm−2 were predicted with a source and a sink at temperatures
T1 = 383K and T3 = 283K, respectively. Improving the performances of these converters by increasing their
operating frequency up to kHz without reducing the amplitude of the temperature modulation of the active
layer could in principle make them competitive with the NTPV technology and could even surpass it. However,
this remains today a challenging problem, since it requires working with thin active layers at smaller separation
distances from the source and the sink, distances for which the Casimir force induced by the vacuum fluctuations
limits the possibility of moving the active layer with a reasonable energy consumption (this force per unit area
is of the order of 10 N m−2 for a separation of 100 nm and it increases to 105 N m−2 at 10 nm). Here we address
these challenges by introducing a static (non-mechanical) pyroelectric converter based on G ETs14 (Fig. 1a),
1
Departament de Física de la Matèria Condensada, Universitat de Barcelona, Martí i Franquès 1, 08028 Barcelona,
Spain. 2Laboratoire Charles Fabry, UMR 8501, Institut d’Optique, CNRS, Université Paris-Sud, 11, 2, Avenue
Augustin Fresnel, 91127 Palaiseau Cedex, France. *email: ilatella@ub.edu; pba@institutoptique.fr
Scientific Reports | (2021) 11:19489 | https://doi.org/10.1038/s41598-021-98656-8 1
Vol.:(0123456789)
www.nature.com/scientificreports/
Figure 1. Graphene-based pyroelectric converter. (a) Schematic illustration of the device: a pyroelectric
membrane (active zone) is suspended between two GFETs (thermal reservoirs) held at two different
temperatures T1 (primary source) and T3 < T1 (thermal sink). A modulation of bias voltages Vg1 and Vg2 applied
to the GFET gates allows to oscillate the temperature T2 of the membrane which generates useful power due
to pyroelectric effect. The electrodes in the active zone serve to extract electric charge and apply electric field.
(b) Crystallographic structure of BaTiO3 showing that a permanent polarization P exists in the c-direction
when T is smaller than the Curie temperaure TC . (c) Heat flux received by the membrane during the heating-
cooling steps induced by the bias voltages cycling for a layer of BaTiO3 of thickness δp = 3 µm. (d) Temporal
evolution of the membrane while the bias voltages are modulated at frequency f = 0.2kHz with turn-on values
Vg1 = Vg2 = 1V. (e) Short-circuit pyroelectric current density.
whose properties can be externally controlled with an applied voltage in order to modulate at kHz frequencies the
near-field interactions between the pyroelectric membrane and both the source and the sink. Rather than using
a conversion device based on pyroelectric/graphene heterostructures15, here it is the thermal source and the sink
which are coated by graphene in order to be able to actively change their surface state. Hence, by dynamically
controlling the charge density of the graphene sheets and exploiting the tunability of surface wave coupling16
between the different elements of the converter, we demonstrate that these pyroelectric devices can generate
an electric power larger than a hundred mW cm−2 with low grade heat sources. Moreover, on the contrary to
solid-state pyroelectric converters operating at kHz f requencies17, 18, we demonstrate that our graphene-based
pyroelectric system is a self-powered or autonomous conversion device in which the power required to modu-
late the temperature is much smaller than the delivered power, opening so a new avenue for high-frequency
pyroelectric energy harvesting from stationary thermal sources.
Results
Pyroelectric conversion of near‑field energy in three‑body systems. The proposed device consists
in an active membrane made with a pyroelectric layer of thickness δp which is covered on both sides by a gold
(Au) layer, acting as electrode, and a superficial silica (SiO 2 ) layer which supports a surface wave in the infrared.
The electrodes are taken sufficiently thick (here 200 nm) in order to screen the incoming electromagnetic field
in the infrared, while the thickness of SiO2 layers is chosen small enough (here 50 nm) to limit the thermal
inertia of the active membrane. As sketched in Fig. 1a, this membrane (body 2) at temperature T2 is encapsulated
without contact between a hot source (body 1) and a cold sink (body 3) at temperatures T1 and T3, respectively.
Scientific Reports | (2021) 11:19489 | https://doi.org/10.1038/s41598-021-98656-8 2
Vol:.(1234567890)
www.nature.com/scientificreports/
These two thermal reservoirs consist in a multilayer structure made with a n-doped silicon (Si) substrate sur-
mounted by a SiO 2 layer of thickness δg = 5nm which is itself covered by a graphene sheet, the whole consti-
tuting a GFET. By applying an external bias voltage Vgi on the gate of each of these GFETs operating in cut-off
mode (i.e. no current flows from the GFET source to the drain), the superficial carrier d ensity14 ngi = Cg Vgi /e
√
on the graphene sheet and therefore its chemical potential µgi = vF πngi can be actively controlled (here e
is the electron charge, is the reduced Planck constant, vF = 106 m/s is the Fermi velocity and Cg = εg /δg is
the capacitance per unit surface of the GFET, εg being the permittivity of the dielectric layer). It follows that the
radiative coupling between the active membrane and the two thermal reservoirs can also be dynamically tuned
with the modulation of these bias voltages.
In contrast to the Fang et al. converter13, in our three-terminal device the separation distance between the
active membrane and the two reservoirs is kept fixed and equal to d = 20nm while the bias voltages Vg1 and Vg2
applied on the GFETs undergo periodic rectangular modulations at frequency f in phase opposition. According
to the theory of radiative heat transfer in many-body s ystems19, 20, the net power per unit surface received by
the active layer reads
∞ ∞
dω dω
Pr (Vgi ; T2 , t) = ϕ12 (ω) − ϕ23 (ω). (1)
0 2π 0 2π
d 2 k mn
Here ϕmn (ω) = θmn (ω) l={TE,TM} (2π) (ω, k) represents the spectral flux at frequency ω , weighted by
2 Tl
the transmission coefficient Tl mn (ω, k) which describes the coupling efficiency, in polarization l, of the mode
(ω, k) between bodies m and n, k being the wavevector parallel to the surfaces (k = |k|) and ω the energy carried
by the mode (see “Methods”). In this expression θmn (ω) = θ(ω, Tm ) − θ(ω, Tn ) denotes the difference of photon
mean energies at temperatures Tm and Tn, associated to bodies m and n, respectively. Since the gate voltages Vgi
are dynamically modulated, the temperature variation of the active membrane (pyroelectric material covered by
the electrodes and the SiO 2 layers) is driven by the energy balance equation cv δ dT2 /dt = Pr (Vgi ; T2 , t), where
cv is the volumetric heat capacity of the membrane and δ its thickness (see Supplementary Information,
Section 1).
Electric current generation and performances of the pyroelectric converter. To demonstrate the
potential of these converters, we first consider barium titanate (BaTiO3 ) ceramic layer of thickness δp = 3 µm
in the ferroelectric phase (Fig. 1b) as the pyroelectric material21 and reservoir temperatures T1 = 400K and
T3 = 300K. The cyclic modulation of the energy flux (Fig. 1c) received by the active membrane induces a time
variation of its temperature as shown in Fig. 1d. This leads to a change in the spontaneous electric dipolar
moment of pyroelectric material and modifies the density of interfacial charges on the electrodes. This variation
is characterized by the pyroelectric coefficient21 p = ∂T∂P
in the direction of the poling field, P being the electric
polarization. If the electrodes of the pyroelectric capacitor are connected to an electric circuit, the generated
current density is given by22 ip = p(T2 ) dT2 /dt , which is plotted in Fig. 1e for f = 0.2kHz and Vg1 = Vg2 = 1V
(temperature-dependent pyroelectric coefficient, specific heat23 and permittivity24 of BaTiO3 are given in
Supplementary Information, Section 2). It is noteworthy that the thermal response T2 (t) of the BaTiO3 layer
becomes periodic at the same frequency as the bias voltages after a transient delay (corresponding to the loss
of memory of initial conditions). Implementing the so-called synchronized electric charge extraction (SECE)
cycle25, which consists in extracting the electric charge stored in the active material when its temperature T2 (t)
reaches the maximum and minimum values Tmax and Tmin, respectively, the energy per unit surface generated
during a cycle reads
Tmax
p(T2 )
Wp = δp [Tmax p(Tmax ) − Tmin p(Tmin )] dT2 , (2)
Tmin ε33 (T2 )
where ε33 denotes the permittivity of the pyroelectric material in the polarization direction (see Supplementary
Information, Section 3 for details). Besides, the energy dissipated to charge the graphene capacitors during a cycle
is given by Wg = 12 Cg (Vg12 + V 2 ), so that the net power per unit surface delivered by a converter with operat-
g2
ing frequency f can be estimated as P = f (Wp − Wg ). Thus, the conversion efficiency is η = (Wp − Wg )/Win ,
where the input energy Win corresponds to the energy absorbed by the active layer during the heating stage of
Tmax
cycle, Win = δ Tmin cv (T2 ) dT2.
The ratio Wp /Wg plotted in Fig. 2a, shows that a small amount of energy is used to charge the GFETs capacitor
up to a modulation frequency of about 1.5 kHz. This ratio is approximately constant for small frequencies, the
variation amplitude of the active layer temperature having reached its upper value. Beyond this plateau, Wp /Wg
decreases while the variation amplitude of the temperature decreases as well. Since Wp /Wg > 1 at kHz frequen-
cies, the energy generated per cycle is larger than the energy used to tune the state of GFETs, demonstrating so
that these devices can be self-powered throughout the conversion process. The corresponding useful (net) power
P is shown in Fig. 2b and the conversion efficiency in Fig. 2c, the latter being rescaled with the Carnot efficiency
ηC = 1 − T3 /T1. The delivered power with this material reaches values around 10 mW cm−2 at frequencies of
fraction of kHz. To assess the potential of this technology with other pyroelectric materials we consider a simpli-
fied form for the generated energy25 Wp = δp (Tmax − Tmin )2 p2 /ε33 when the materials properties are assumed
to be independent of temperature. This expression depends on the figure of merit (FOM) p2 /ε33 characterizing
the pyroelectric performance of the material22. Parametrizing material properties with this FOM, in Fig. 2d–f
we estimate the performance of the converter for different source temperatures. The specific heat of different
pyroelectric materials is set to 2.5 × 10⁶J m−3 K−1, a value which is representative of most ferroelectric materials25
Scientific Reports | (2021) 11:19489 | https://doi.org/10.1038/s41598-021-98656-8 3
Vol.:(0123456789)
www.nature.com/scientificreports/
a 160 b c 1
δp = 5 µm 12
δp = 3 µm 0.8
120 δp = 1 µm
P (mW/cm2 )
η/ηC (%)
8 0.6
Wp /Wg
80 BaTiO3
0.4
4
40
0.2
0 0 0
0 0.5 1 1.5 0 0.5 1 1.5 0 0.5 1 1.5
f (kHz) f (kHz) f (kHz)
d 380 e 16 f
1.2
011
PMN-0.28PT
111
PMN-0.33PT
Tmax T1 = 400 K
111
PZN-0.08PT
T1 = 360 K
360 12 T1 = 330 K
P (mW/cm2 )
η/ηC (%)
0.8
Tmin
T2 (K)
340 8
0.4
320 4
f = 0.2 kHz δp = 3 µm
300 0 0
0 5 10 15 0 100 200 300 0 100 200 300
2
time (ms) p /ε33 (J m−3 K−2 ) p2 /ε33 (J m−3 K−2 )
Figure 2. Performances of the converter with SECE cycles. (a) Ratio of the energy Wp generated per cycle
to the energy Wg required to tune the gate voltages. (b) Power generated by the converter in response to
the periodically varying (rectangular) bias voltage applied on the gate of the GFETs at the frequency f with
a primary source at T1 = 400K. (c) Conversion efficiency η = (Wp − Wg )/Win normalized by the Carnot
efficiency ηC . (d) Time variation of the active layer temperature. (e) Generated power and (f) conversion
efficiency with respect to the FOM p2 /ε33. In all figures, T3 = 300K and Vg1 = Vg2 = 1V when these voltages
are switched on.
as indicated in Fig. 2e for some of them for guidance reasons. We observe that a power of a few mW cm−2 can be
obtained even for small temperature differences. Moreover, neglecting the temperature dependence in Wp and
writing Wg in terms of the carrier densities ngi in the graphene sheets, we find that
Wp 2p2 (Tmax − Tmin )2 δp εg
= , (3)
Wg e2 (n2g1 + n2g2 ) δg ε33
showing a certain flexibility for those systems to achieve Wp /Wg > 1 by an appropriate choice of thicknesses
(capacitances) in the GFETs and the active layer.
Switchability of surface modes coupling with the graphene plasmon. To give an insight into the
coupling mechanism of thermal photons in the converter, we show in Fig. 3a–d the transmission coefficients
for TM polarization (strongly dominant) of the energy carried by the electromagnetic modes (ω, k) between the
active zone and the GFETs. We also show the Planck windows where the heat transfer takes place (dashed blue
and red lines). For Vgi = 0, we see in Fig. 3a, d that the heat transfer is mainly mediated by hybridized (sym-
metric and antisymmetric) surface phonon polaritons (SPPs) supported by the SiO 2 layers on both the GFETs
and the active zone, at frequencies about 0.9 × 10¹⁴rad s−1 and 2.2 × 10¹⁴rad s−1. When the bias voltage is
switched on, the coupling of SPPs through the gap is reduced by the presence of delocalized graphene plasmon
on the GFET, whose dispersion relation is shown in dashed green lines in Fig. 3b, c. Consequently, the number
of modes participating in the heat transfer around the SPP resonances decreases significantly when the GFET is
charged. Hence, by tuning the gate voltage in the GFETs we can actively and locally (Fig. 3e) control the near-
field heat exchanges in the converter during the heating and cooling stages of the cycle (Fig. 3f).
Near‑field pyroelectric conversion in Ericson‑cycle mode. Implementing the SECE cycle as previ-
ously discussed is efficient when the temperature changes of ferroelectric materials take place close to their Curie
temperature. Unfortunatly, when we move away from this critical temperature their pyroelectric coefficient
drops sharply limiting so the electric current g eneration25. However, more efficient thermodynamic cycles can
be used to improve the performances of conversion process, such as Ericsson cycles consisting in two isothermal
and two isoelectric stages26. These cycles require the action of an external electric field E on the pyroelectric
material. By neglecting the temperature dependence of the pyroelectric coefficient in the considered working
temperature range and assuming that the heat capacity does not depend on the electric field, the energy per unit
surface generated with this cycle can be written as27
Scientific Reports | (2021) 11:19489 | https://doi.org/10.1038/s41598-021-98656-8 4
Vol:.(1234567890)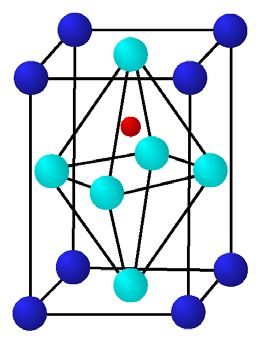
www.nature.com/scientificreports/
a c e
3 1.0 3 1.0
heating
ϕ12
0.8 0.8
Energy spectrum (a.u.)
ϕ23
ω (1014 rad/s)
2 2
0.6 0.6
0.4 0.4 cooling
1 1 ϕ12
0.2 0.2 ϕ23
12 23
TTM : Vg1 = 0 TTM : Vg2 = 4.0 V
0 0.0 0 0.0
0 40 80 120 0 40 80 120
0 1 2 3
b d ω (1014 rad/s)
3 1.0 3 1.0 f
60 heating
0.8 0.8
cooling
ω (1014 rad/s)
2 2 30
Pr (W/cm2 )
0.6 0.6
0
0.4 0.4
1 1
0.2 0.2 −30 T1 = 383 K
12
TTM : Vg1 = 1.9 V 23
TTM : Vg2 = 0 T3 = 283 K
0 0.0 0 0.0 −60
0 40 80 120 0 40 80 120 300 320 340 360 380
k (106 rad/m) k (106 rad/m) T2 (K)
Figure 3. Coupling tunability in near-field regime. (a)–(d) Transmission coefficients TTM12 and T 23 in the
TM
(ω, k) plane between the primary source at T1 = 383K and the active layer and between the active layer and the
thermal sink at T3 = 283K, respectively, for T2 = 343K. Cyan curves represent the light line ω = ck. Dashed red
and blue lines denote the difference of Planck functions ω2 θ12 and ω2 θ23 (Planck windows), respectively, where
heat transfer takes place. Resonances around the frequencies 0.9 × 10¹⁴rad/s and 2.2 × 10¹⁴rad/s correspond
to the symmetric and antisymmetric SPPs supported by the SiO2 layers, while dashed green lines repesent the
surface plasmon dispersion relation of graphene for chemical potentials µg1 = 0.33eV in (b) and µg2 = 0.48eV
in (c). The anticrossing curves in (b) and (c) show the strong coupling between the SPPs of silica and the
delocalized plasmon of graphene. (e) Spectrum of the heat exchange between the source and the active zone
(ϕ12) and between the active zone and the sink (ϕ23). (f) Radiative heat flux on the active zone for the heating
and cooling processes.
Emax
Wp = δp (Tmax − Tmin ) p(E) dE, (4)
0
where Emax is the maximum value of the applied field (see Supplementary Information, Section 4 for details).
In this case the net power P and the conversion efficiency η take the same form as previously but the input
Tmax E
energy becomes Win = δ Tmin cv (T2 ) dT2 + δp Tmax 0 max p(E) dE . Indeed in Ericsson cylces it includes also
heat absorption due to electrocaloric effect at the high temperature isotherm. Hence, high performances can be
achieved with materials showing a large electrocaloric activity27, as reported, for instance, in the thin film relaxor
ferroelectric28 0.90Pb(Mg1/3Nb2/3)O3-0.10PbTiO3 (also denoted as 0.9PMN–0.1PT) for a field Emax = 895kV/
cm. An energy density of pyroelectric conversion Wp /δp = 0.432J cm−3 has been estimated27 for this material,
with working temperatures corresponding to Tmin = 338K and Tmax = 348K. This allows us to evaluate the per-
formance of our converter under these conditions, as also considered by Fang et al.13 To enhance the generated
current we structure the pyroelectric material (0.9PMN–0.1PT) in a series of ten parallel thin films of thickness
300 nm separated by Au electrodes of thickness 50 nm, so that δp = 3 µm, and the specific heat of 0.9PMN–0.1PT
is taken a s27 3 × 10⁶J m−3 K−1. For a source and a sink at temperatures T1 = 383K and T3 = 283K, respectively,
we show in Fig. 4a the evolution of Tmax and Tmin as a function of the driving frequency f in the GFETs with
actuated voltages Vg1 = 1.9V and Vg2 = 4V (as shown in Fig. 3). The proper range of working temperatures is
achieved at f = 1.02kHz for this configuration, but other possibilities exist because of the freedom to choose
the control parameters of the device. In Fig. 4b we show a cut of the configuration space (f , Vg1 , Vg2 ) leading to
the required temperature oscillations in the active zone. The corresponding power P reaches values of about 130
mW cm−2 with energy ratios Wp /Wg ≫ 1, which are both plotted in Fig. 4c, d as a function of the frequency f
and actuated voltage Vg2, respectively. Moreover, ignoring the loses Wg , the efficiency ratio η/ηC for these con-
figurations takes a value of 3.2%. It is worthwhile to note that the power density is about 200 times larger than
the result reported by Fang et al.13.
Conclusions
We have introduced an innovative solution to harvest energy from low-grade heat sources using many-body
pyroelectric systems driven at kHz frequencies by GFETs. We have shown that these converters are very efficient
for the conversion of the low grade heat into electricity. Generated power densities up to 130 mW cm−2 have been
Scientific Reports | (2021) 11:19489 | https://doi.org/10.1038/s41598-021-98656-8 5
Vol.:(0123456789)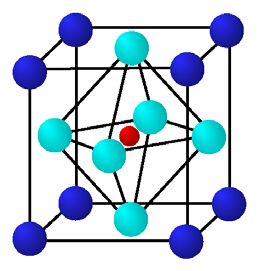
www.nature.com/scientificreports/
a b
368 348
Tmax
Tmin
Tmax
358 Tmin
Vg1 = 1.9 V
Temperature (K)
Temperature (K)
Vg2 = 4.0 V 338
348
1.2 4
3
0.8
f (kHz)
Vg1 (V)
338
328 2
0.4
1
328
1.02 kHz 0 0
0 2 4 6 8
318 Vg2 (V)
318
0 0.5 1 1.5 2 0 2 4 6 8
f (kHz) Vg2 (V)
c d
120 120
90 90
P (mW/cm2 )
P (mW/cm2 )
103 103
Wp /Wg
Wp /Wg
60 102 60 102
101 101
30 100 30 100
0 2 4 6 8 0 0.4 0.8 1.2
Vg2 (V) f (kHz)
0 0
0 2 4 6 8 0 0.4 0.8 1.2 1.6
Vg2 (V) f (kHz)
Figure 4. Performances of the converter with Ericsson cycles. (a) Maximum and minimum temperatures
of the active zone during the modulation as a function of the frequency f. The active material is the relaxor
ferroelectric 0.9PMN–0.1PT with an overall thickness δp = 3 µm. (b) Temperature of the active zone and cut of
the configuration space (f , Vg1 , Vg2 ) leading to temperature oscillations with Tmax = 348K and Tmin = 338K.
(c) Generated power as a function of the turn-on voltage Vg2. (d) Generated power as a function of the
modulation frequency f. The insets in (c) and (d) show the ratio of the energy Wp generated per cycle to the
energy Wg required to tune the gate voltages.
predicted with relaxor ferroelectrics used in Ericsson cycles with temperatures differences of 100 K between the
primary source and the cold sink. In addition, we have shown that the power generated by these autonomous
systems surpasses the current production of NTPV d evices11, 12 by several orders of magnitude. Beyond its
potential for near-field energy conversion, nanoscale solid-state cooling and nanoscale thermal management
could also benefit from this technology.
Methods
Energy transmission coefficients. In a three-body system as sketched in Fig. 1a, the radiative heat
exchange takes place, in general, through all bodies in the system, including a direct exchange between the
source and the sink when the active zone is partially transparent to electromagnetic radiation. However, under
the assumption that the electrodes in the active zone are opaque, meaning that these layers are optically thick,
there is no direct heat exchange between the source and the sink. This amounts to consider the electrodes as
semi-infinite slabs, for which the many-body energy transmission coefficients20 in this case reduce to
(1 − |ρlm |2 )(1 − |ρln |2 ) m
ew 4Im(ρl )Im(ρl )e
n −2Im(kz )dmn
Tl mn = �pw + � (5)
1 − ρ m ρ n e−2ikz dmn 2 1 − ρ m ρ n e−2Im(kz )dmn 2
l l l l
with the source-sink coupling Tl 13 = 0 , where dmn is the separation distance between bodies m and n,
kz = ω2 /c 2 − k2 is the normal component of wavevector in vacuum, ρlm is the Fresnel reflection coefficients
of body m, and �pw = h(ω − ck) and �ew = h(ck − ω) are the propagating and evanescent wave projectors,
respectively, c being the speed of light and h(x) the Heaviside step function. Here the coefficients ρl1 and ρl3
correspond to the reflection coefficient of a bilayer with n-doped Si as substrate and a superficial layer of SiO 2
covered by the graphene sheet, while the coefficient ρl2 correspond to a bilayer with Au as substrate and a super-
ficial layer of SiO 2.
Scientific Reports | (2021) 11:19489 | https://doi.org/10.1038/s41598-021-98656-8 6
Vol:.(1234567890)www.nature.com/scientificreports/
Optical properties. For the materials in the source and sink, we consider an n-type heavily doped Si sub-
strate whose dielectric properties are given by the Drude model
ωp2
ε(ω) = ε∞ − , (6)
ω(ω + iγ )
29, 30
where the high-frequency dielectric constant is ε∞ = 11.7 , the plasma frequency is given by
ωp = Ne2 /(m∗ ε0 ) and the scattering rate is obtained as γ = e/(µe m∗ ), where ε0 is the vacuum permittivity,
N is the carrier concentration, m∗ = 0.27m0 is the carrier effective mass and µe is the carrier mobility, m0 being
the free electron mass. In the present study we take the carrier concentration as N = 1020cm−3. Furthermore,
the dielectric permittivity of the Au electrodes in the active zone are also described by the Drude model (6) with
ε∞ = 1, γ = 5.32 × 10¹³s−1 and ωp = 1.37 × 10¹⁶rad s−1. The dielectric permittivity of SiO2 is tabulated in Ref.31.
The response of the graphene sheets is described in terms of a 2D frequency-dependent conductivity
σ (ω) = σD (ω) + σI (ω) with intraband and interband contributions respectively given b y32
i 2e2 kB T µ
σD (ω) = i 2
log 2 cosh ,
ω + τ π 2kB T
(7)
e2
ω
4 ω ∞ G(ξ ) − G ω
2
σI (ω) = G +i dξ ,
4 2 π 0 ( ω)2 − 4ξ 2
where G(x) = sinh(x/kB T)/[cosh(µ/kB T) + cosh(x/kB T)]. As these expressions show, the conductivity depends
explicitly on the temperature T of the graphene sheet, its chemical potential µ and the relaxation time τ for which
we have used the value33 τ = 10−13s. Since the graphene sheet lays on the surface of a medium with permittivity
ε(ω) (this medium here is SiO 2 ), the conductivity σ (ω) modifies the vaccum-medium Fresnel reflection and
transmission coefficients of the interface rl and tl , respectively, which for the two polarizations take the form32, 34
σ (ω)kz kzm
kz − kzm − µ0 σ (ω)ω ε(ω)kz − kzm + ε0 ω
rTE = , rTM = σ (ω)kz kzm
,
kz + kzm + µ0 σ (ω)ω ε(ω)kz + kzm + ε0 ω
√ (8)
2kz 2 ε(ω)kz
tTE = , tTM = ,
z kzm
kz + kzm + µ0 σ (ω)ω ε(ω)kz + kzm + σ (ω)kε0 ω
where µ0 is the vacuum permeability and kzm = ε(ω)ω2 /c 2 − k2 is the normal component of the wave vector
in the medium. The dispersion relation of graphene plasmon is given by the zeros of the denominator of Fresnel
coefficients in TM polarization.
Received: 23 June 2021; Accepted: 6 September 2021
References
1. DiSalvo, F. J. Thermoelectric cooling and power generation. Science 285, 703–706 (1999).
2. Lenert, A. et al. A nanophotonic solar thermophotovoltaic device. Nat. Nanotechnol. 9, 126–130 (2014).
3. Coutts, T. J. A review of progress in thermophotovoltaic generation of electricity. Renew. Sustain. Energy Rev. 3, 77–184 (1999).
4. Eckhardt, W. Radiation laws in the vincinity of metallic boundaries. Z. Phys. B Condens. Matter 46, 85–94 (1982).
5. Polder, D. & Van Hove, M. Theory of radiative heat transfer between closely spaced bodies. Phys. Rev. B 4, 3303 (1971).
6. Ottens, R. S. et al. Near-field radiative heat transfer between macroscopic planar surfaces. Phys. Rev. Lett. 107, 014301 (2011).
7. Song, B. et al. Radiative heat conductances between dielectric and metallic parallel plates with nanoscale gaps. Nat. Nanotechnol.
11, 509–514 (2016).
8. St-Gelais, R., Zhu, L., Fan, S. & Lipson, M. Near-field radiative heat transfer between parallel structures in the deep subwavelength
regime. Nat. Nanotechnol. 1, 515–519 (2016).
9. DiMatteo, R. S. et al. Enhanced photogeneration of carriers in a semiconductor via coupling across a nonisothermal nanoscale
vacuum gap. Appl. Phys. Lett. 79, 1894 (2001).
10. Narayanaswamy, A. & Chen, G. Surface modes for near field thermophotovoltaics. Appl. Phys. Lett. 82, 3544 (2003).
11. Fiorino, A. et al. Nanogap near-field thermophotovoltaics. Nat. Nanotechnol. 13, 806–811 (2018).
12. Bhatt, G. R. et al. Integrated near-field thermo-photovoltaics for heat recycling. Nat. Commun. 11, 2545 (2020).
13. Fang, J., Frederich, H. & Pilon, L. Harvesting nanoscale thermal radiation using pyroelectric materials. J. Heat Transf. 132, 092701
(2010).
14. Novoselov, K. et al. Electric field effect in atomically thin carbon films. Science 306, 666 (2004).
15. Han, Z. et al. The thermal-to-electrical energy conversion in (Bi0.5Na0.5)0.94Ba0.06TiO3/graphene oxide heterogeneous struc-
tures. Ceram. Int.45, 24493–24499 (2019).
16. Messina, R. & Ben-Abdallah, P. Graphene-based photovoltaic cells for near-field thermal energy conversion. Sci. Rep. 3, 1383
(2013).
17. Bhatia, B. et al. High power density pyroelectric energy conversion in nanometer-thick BaTiO 3 films. Nanoscale Microscale Ther-
mophys. Eng. 20, 137–146 (2016).
18. Pandya, S. et al. Pyroelectric energy conversion with large energy and power density in relaxor ferroelectric thin films. Nat. Mater.
17, 432–438 (2018).
19. Ben-Abdallah, P., Biehs, S.-A. & Joulain, K. Many-body radiative heat transfer theory. Phys. Rev. Lett. 107, 114301 (2011).
20. Latella, I., Ben-Abdallah, P., Biehs, S.-A., Antezza, M. & Messina, R. Radiative heat transfer and nonequilibrium Casimir–Lifshitz
force in many-body systems with planar geometry. Phys. Rev. B 95, 205404 (2017).
21. Lang, S. B., Rice, L. H. & Shaw, S. A. Pyroelectric effect in barium titanate ceramic. J. Appl. Phys. 40, 4335 (1969).
22. Bowen, C. R. et al. Pyroelectric materials and devices for energy harvesting applications. Energy Environ. Sci. 7, 3836 (2014).
Scientific Reports | (2021) 11:19489 | https://doi.org/10.1038/s41598-021-98656-8 7
Vol.:(0123456789)www.nature.com/scientificreports/
23. Davitadze, S. T. et al. Specific heat and thermal conductivity of BaTiO3 polycrystalline thin films. Appl. Phys. Lett. 80, 1631 (2002).
24. Merz, W. J. The electric and optical behavior of BaTiO 3 single-domain crystals. Phys. Rev. 76, 1221 (1949).
25. Sebald, G., Lefeuvre, E. & Guyomar, D. Pyroelectric energy conversion: optimization principles. IEEE Trans. Ultrason. Ferroelectr.
Freq. Control 55, 3 (2008).
26. Olsen, R. B., Bruno, D. A. & Briscoe, J. M. Pyroelectric conversion cycles. J. Appl. Phys. 58, 4709–4716 (1985).
27. Sebald, G., Pruvost, S. & Guyomar, D. Energy harvesting based on Ericsson pyroelectric cycles in a relaxor ferroelectric ceramic.
Smart Mater. Struct. 17, 015012 (2008).
28. Mischenko, A. S., Zhang, Q., Whatmore, R. W., Scott, J. F. & Mathur, N. D. Giant electrocaloric effect in the thin film relaxor fer-
roelectric 0.90Pb(Mg1/3Nb2/3)O 3−0.10PbTiO 3 near room temperature. Appl. Phys. Lett.89, 242912 (2006).
29. Basu, S., Lee, B. & Zhang, Z. M. Infrared radiative properties of heavily doped silicon at room temperature. J. Heat Transf. 132,
023301 (2010).
30. Fu, C. J. & Zhang, Z. M. Nanoscale radiation heat transfer for silicon at different doping levels. Int. J. Heat Mass Transf. 49, 1703
(2006).
31. Palik, E. Handbook of Optical Constants of Solids (Academic Press, London, 1998).
32. Falkovsky, L. A. Optical properties of graphene. J. Phys: Conf. Ser. 129, 012004 (2008).
33. Jablan, M., Buljan, H. & Soljačić, M. Plasmonics in graphene at infrared frequencies. Phys. Rev. B 80, 245435 (2009).
34. Stauber, T., Peres, N. M. R. & Geim, A. K. Optical conductivity of graphene in the visible region of the spectrum. Phys. Rev. B 78,
085432 (2008).
Acknowledgements
This project has received funding from the European Union’s Horizon 2020 research and innovation programme
under the Marie Sklodowska-Curie Grant Agreement No. 892718 (I.L.).
Author contributions
I.L. and P.B.-A. contributed equally to this work.
Competing interests
The authors declare no competing interests.
Additional information
Supplementary Information The online version contains supplementary material available at https://doi.org/
10.1038/s41598-021-98656-8.
Correspondence and requests for materials should be addressed to I.L. or P.B.-A.
Reprints and permissions information is available at www.nature.com/reprints.
Publisher’s note Springer Nature remains neutral with regard to jurisdictional claims in published maps and
institutional affiliations.
Open Access This article is licensed under a Creative Commons Attribution 4.0 International
License, which permits use, sharing, adaptation, distribution and reproduction in any medium or
format, as long as you give appropriate credit to the original author(s) and the source, provide a link to the
Creative Commons licence, and indicate if changes were made. The images or other third party material in this
article are included in the article’s Creative Commons licence, unless indicated otherwise in a credit line to the
material. If material is not included in the article’s Creative Commons licence and your intended use is not
permitted by statutory regulation or exceeds the permitted use, you will need to obtain permission directly from
the copyright holder. To view a copy of this licence, visit http://creativecommons.org/licenses/by/4.0/.
© The Author(s) 2021
Scientific Reports | (2021) 11:19489 | https://doi.org/10.1038/s41598-021-98656-8 8
Vol:.(1234567890)You can also read