INFRASTRUCTURE IN GREECE - FUNDING THE FUTURE - PWC

Page created by Dale Cooper
 
CONTINUE READING
INFRASTRUCTURE IN GREECE - FUNDING THE FUTURE - PWC
Infrastructure in
Greece

Funding the future

October 2020
INFRASTRUCTURE IN GREECE - FUNDING THE FUTURE - PWC
Content overview

    1        Executive          2   Infrastructure
                                                     The
             summary                investment
                                                     investment
                                                     gap in Greek
    3        Greek              4   Funding of       infrastructure
             infrastructure         Greek
             projects               infrastructure   is about
             pipeline               projects

    5        Conclusion         6   Appendices

                                                        0.8pp of
                                                           GDP
Infrastructure in Greece 2019                                    October 2020
PwC                                                                        2
INFRASTRUCTURE IN GREECE - FUNDING THE FUTURE - PWC
1
       Executive
    summary
INFRASTRUCTURE IN GREECE - FUNDING THE FUTURE - PWC
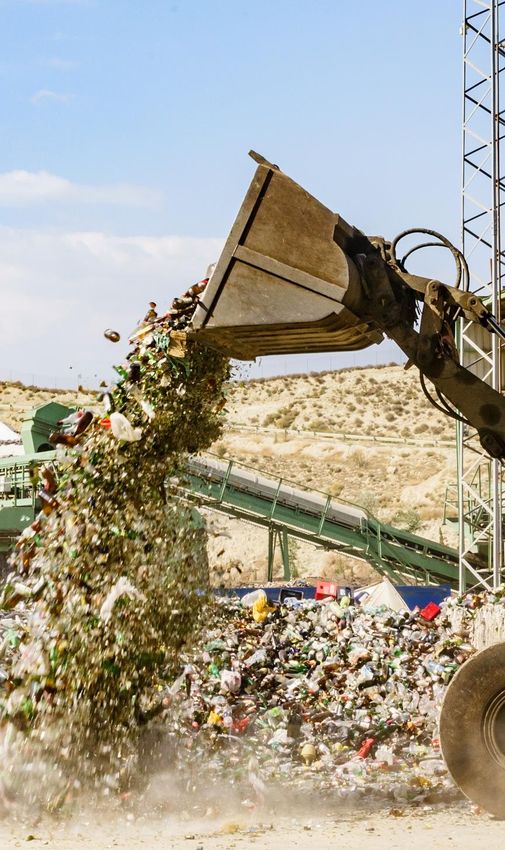
Executive Summary (1/2)

Funding the future

•     Global infrastructure needs are expected to reach around             € 43.4bn total infrastructure budget
      $ 77trln by 2040                                                     Infrastructure work in progress and upcoming projects
•     Greece ranks 37th globally and 18th among the EU countries in
      terms of infrastructure quality
•     There is an infrastructure investment gap of about 0.8pp of GDP
      (against the European average) translating into an average
      spending shortage of € 1.5bn per year                                                                Waste Management
                                                                                                    Rail
•     Infrastructure investments have an economic multiplier of 1.8x,                                         3.6%
                                                                                                      7.7%
      which boosts demand across the economy
                                                                                Urban Rail
•     The infrastructure pipeline, i.e. projects in progress or prepared
      but not yet funded, amounts to 118 projects with a budget of                        12.3%
      € 43.4bn
•     The pipeline is higher than in the past due to addition of new
      high cost projects in the preparation phase
                                                                                                                              58.4%
•     € 25.4bn of the budget refers to Energy projects, while € 8.7bn        Motorways
                                                                                         13.8%                                         Energy

      to Railways and € 6bn to Motorways. Tourist infrastructure and
      Waste management projects account for a small part of the                                  4.2%
      remaining budget taking up only about € 1.8bn and € 1.6bn
                                                                           Tourism Infrastructure
      respectively
•     The infrastructure pipeline is concentrated (58%) on energy
      interconnection and generation

                                                                           Source: Press, PwC calculations

                                                                                                                                      October 2020
PwC                                                                                                                                             4
INFRASTRUCTURE IN GREECE - FUNDING THE FUTURE - PWC
Executive Summary (2/2)

 •    The current project portfolio is heavy on energy and
      transport but short on connectivity, tourism and the          Estimated Completion year (cumulative)
      environment                                                   Number of projects
 •    Investment on tourist product upgrading, as well as
      water and waste management have a significant impact
      on the development and improvement of the life quality
 •    The majority of the infrastructure projects are behind the          Planned
      starting line, either in the maturity phase or the bidding          In progress                   63    64
                                                                                                   61
      and contracting stage                                                                   57
 •    Only 37 projects are in the construction phase, while 81
                                                                                         51
      are in the designing phase, with 54 of them not having a                                          26    27
                                                                                                   24
      start/completion date                                                                   21                          54 projects are
 •    The majority of the infrastructure projects funded by the                          20                               in early design
      NSRF are not completed yet, despite the fact that we                                                                phase with no
      are reaching the end of the current period, with the level                                                          announced
                                                                                    26                                    commencement
      of payments still at very low levels                                                                          54
                                                                                    3                                     and completion
 •    In order to accelerate the infrastructure projects in the              20
                                                                             1                                            dates yet
      following years, the private sector’s contribution could be                        31
                                                                                              36   37   37    37

      actively used, through the mechanism of unsolicited             8             23
                                                                             19
      proposals and the creation of the correct institutional         0
      framework                                                       8
                                                                                                                    0
                                                                    2020 2021 2022 2023 2024 2025 2026       2030   N/A
                                                                    Source: Press, PwC calculations

                                                                                                                            October 2020
PwC                                                                                                                                   5
INFRASTRUCTURE IN GREECE - FUNDING THE FUTURE - PWC
2
     Infrastructure
    investment
INFRASTRUCTURE IN GREECE - FUNDING THE FUTURE - PWC
Definition of infrastructure

 • “Infrastructure is the system of public works in a country, state or region, including roads, utility lines and
   public buildings”
      OECD
 • “Infrastructure is “the basic framework for delivering energy, transport, water & sanitation and information &
   communication technology (ICT) services to people affecting directly or indirectly their lives”
      World Bank

                                                                             In the study, we have included projects with
                                                                             regards to transport (airport, ports, roads &
                                                                             rail), energy (electricity, oil & gas) as well
                                                                             as water & sewage, whilst ICT and Social
                                                                             Infrastructure (e.g. Hospitals, Schools,
                                                                             Public Buildings, Sport Structures and
                                                                             Green Areas) have been excluded

                                                                             Information & Communications Technology,
                                                                             according to the World Bank, refers to
                                                                             physical telecommunications systems and
                                                                             networks (cellar, broadcast, cable, satellite,
                                                                             postal) and the services that utilize them
                                                                             (internet, voice, mail, radio, and television)

                                                                                                                 October 2020
PwC                                                                                                                        7
INFRASTRUCTURE IN GREECE - FUNDING THE FUTURE - PWC
Global Megatrends
11 Megatrends have emerged as the main challenges that will affect both
growth models and way of living in the future
                       The 11 Megatrends      Investments in Infrastructure
Megatrends are                           1. Ageing of population                                         •       Urban Transport Infrastructure
defined as the long-                                                                                             o urban rail lines
term and irreversible                    2. Urbanization                                                         o urban roads
                                                                                                         •
processes that will                      3. Diseases transmission
                                                                                                                 Waste Management Infrastructure

affect specific sectors
                                                                                                         •
as well as the realm of                  4. Technological change                                                 Transport infrastructure at
                                                                                                                 national level

public policy                            5. Sustainable economic growth                                          o road & rail network
                                                                                                                 o ports
                                                                                                                 o airports
                                         6. Global competition for resources
                                                                                                         •       Interconnection of Infrastructure
                                         7. Emergence of new economic powers                                     & Transportation Network and
                                                                                                                 integration in the new global trade
                                                                                                                 flows
                                         8. Growing pressure on ecosystems
                                                                                                             •   Energy Infrastructure
                                         9. Climate change                                                       o gas distribution & storage network
                                                                                                                 o RES
                                         10. Environmental pollution                                             o island & mainland electricity
                                                                                                                   interconnection

                                         11. Diversifying approaches to governance
                                                                                                                                           October 2020
             Source: Τhe European Environment, State and Outlook 2015, Assessment of Global Megatrends
PwC                                                                                                                                                    8
INFRASTRUCTURE IN GREECE - FUNDING THE FUTURE - PWC
Global infrastructure could require up to $ 77trln of
 investment by 2040
 In the period 2019-2040, 3.2% of global GDP                  Traditional funding sources are no longer
 needs to be invested in water infrastructure, road           enough to cover the rapid increase in
 & rail transportation, airports and ports, energy            infrastructure projects, which are expected to
                                                              reach $ 3.5trln p.a. until 2040

                                                                             Road
                                                                   31.6
                                                                             Rail
                                                                             Airports & Ports                       3.2%
                                                                   10.6
                                                                   4.6
                                                                Transport

                                                                  1.9%
                                                                                                                    76.9

                                                                                                1.1%
                                                                 45.3

                                            0.2%                                                25.8

                                            5.8
                                      Water/Waste             Transport                    Energy                   Total
                                      Management

                                             Infrastructure needs ($trln)                         % of Global GDP

                                     Source: Global Infrastructure Outlook, Oxford Economics
                                                                                                                            October 2020
PwC                                                                                                                                   9
INFRASTRUCTURE IN GREECE - FUNDING THE FUTURE - PWC
Infrastructure extent and quality
   index
   Greece ranks low relatively to its global peers

          Infrastructure index (scale:0-100*)                                                                                                          The infrastructure index captures the quality
          Greece                                                                                                                                       and extent of transport and utility infrastructure
 100                                                                                                               97
                                                                                                                   97                 91               Transport Infrastructure
                                                                                                                                       91
                 78                                                        75                                                                              I.   Road
                 78                 68                                     75                                                                                    • Quality of road network
                                     68                                                        61
                                                                                               61                                                                • Quality of road infrastructure
                                                                                                                                                           II. Rail
                                                                                                                                                                 • Railroad density
                                                        39                                                                                                       • Efficiency of train services
                                                        39
                                                                                                                                                           III. Air
                                                                                                                                                                 • Airport connectivity
                                                                                                                                                                 • Efficiency of transport services
                                                                                                                                                           IV. Sea
    0                                                                                                                                                            • Shipping connectivity***
                Total              Roads             Railroads          Air Transport    Water Trasnport         Electricity          Water                      • Efficiency of seaport services
           Infrastructure
                                                                                                                                                       Utility infrastructure
           Source: The Global Competitiveness Report 2019
          * Indices are expressed on a 0 to 100 scale and are interpreted as “progress scores”, indicating how close a country is to the
                                                                                                                                                           I.  Electricity
             ideal state                                                                                                                                         • Electricity access
                                                                                                                                                                 • Electricity quality
          Ranking in infrastructure (141 countries)                                                                                                        II. Water
                                                                                                                                                                 • Exposure to unsafe drinking water
  Best
performer
                                                                                                                                                                 • Reliability of water supply
                Singapore           Singapore             Japan              Japan             Singapore         9 countries**             Iceland
  (1st)
                                                                                                                                                      *** Για τις χώρες που περιβάλλονται από ξηρά, αυτός ο δείκτης δεν
                                                                                                                                                     *** For landlocked countries, this indicator is not included in the
Ελλάδα            37th               51st                  51st               26th               26th               33rd                   37th          περιλαμβάνεται στον υπολογισμό και η βαθμολογία των
                                                                                                                                                        computation and the Sea component score only corresponds to
                                                                                                                                                         Θαλάσσιων υποδομών αντιστοιχεί μόνο στη βαθμολογία της
                                                                                                                                                        the score of “Efficiency of seaport services”
                                                                                                                                                         «Αποδοτικότητας λιμενικών υπηρεσιών»
                                                                                                                                                                                                         Μάιος 2020
                                                                                                                                                                                                      October   2020
          ** Bahrain, Chile, Finland, Hong Kong, Iceland, South Korea, Luxembourg,                                                                                                                           10
  PwC                                                                                                                                                                                                         10
          Singapore, Taiwan
There are two statistically distinct levels of
infrastructure extent and quality, whose difference
cannot be explained by the level of GDP

                                                                Infrastructure Index 2019
                                                                                            100

   Greece ranks 37th globally and 18th among the EU                                         98                                                    Group 1
   countries in terms of infrastructure, revealing also a                                   96
   quality gap for the current level of GDP per capita                                      94                           Netherlands

                                                                                            92                     Spain
                                                                                                              Germany       France
                                                                                            90
  The differences in                In Greece, the average                                                                    Austria
                                                                                            88                              Belgium
                                                                                                               United Kingdom
  infrastructure extent and         infrastructure investment                                                 Denmark
                                                                                            86
  quality between Western           level during 2009-2019                                                        Sweden
                                                                                                                 Finland
  and Northern European             corresponded to only 14%                                84           Italy
                                                                                                                   Czech Republic
  countries, compared to the        of GDP, lowest among all                                82    Quality gap
                                                                                                                    Poland
  Central and Eastern               E.U. countries,                                         80                         Slovakia
                                                                                                                                        Hungary
  European countries, cannot        undermining country’s                                               Slovenia
                                                                                                                           Croatia
                                                                                            78       Greece
  be explained by the level of      upcoming infrastructure                                                Lithuania                                      Ireland
                                                                                            76                                   Estonia
  relative investment               quality                                                                         Latvia
                                                                                            74
  Infrastructure investments,
                                                                                            72
  measured through the Gross                                                                                                  Romania
                                                                                                                                                        Group 2
  Fixed Capital Formation                                                                   70                Bulgaria

  (GFCF), appear to have a                                                                  68
                                                                                              10%       15%        20%       25%       30%        35%     40%       45%
  different impact on
  infrastructure quality in                                                                                              Gross Fixed Capital Formation / GDP
  each group
                                                                                                  Source: World Economic Forum - The Global Competitiveness
                                                                                                  Report 2019, Fitch

Infrastructure in Greece 2019                                                                                                                               October 2020
PwC                                                                                                                                                                  11
There is a systematic investment gap of 0.8pps of GDP
       (or ca. € 1.5bn p.a.) in Greek infrastructure over the past 10 years

           Infrastructure investment*                                                                          Infrastructure in Greece has                       The erosion of infrastructure
                                                                                                               been severely affected by the                      investment from 2009 to 2019 resulted
                                                                       EU avg.(2009-2019): 1.9%                deep recession. Total value                        in a € 13bn permanent shortage**
              3.1                    € 13.2bn investment shortage between 2009-2019                            of infrastructure projects                         against the EU average
                                                                                                               has decreased by as much
                      2.6
                                                                                                               as 31% after 2009 but has                          The infrastructure investment gap is
              1.3%             2.2
                                       2.1                               2.1              2.1     2.1          rebounded since                                    between 0.8 pp of GDP (against the
                                               2.0      2.0     2.0              2.0
 Greek avg                                                                                                                                                        European average) or 1.9 pp of GDP
(2009-2019)
                                                                        1.2%                                   The current rate of                                (against Greece’s pre-crisis levels)
   1.1%              1.1%                   1.1% 1.1%                           1.1% 1.1% 1.1%
                             1.0% 1.1% 1.1%                                                                    infrastructure investment is
                                                                                                               around 1.1% of GDP, falling                        Infrastructure investments in Greece
                                                                                                               short of the historical pre                        have an economic multiplier of
                                                                                                               crisis average of 3.0% and                         around 1.8x***. The industry employs
                                                                                                               the European average of                            ca 925k people
                                                                                                               2.1% of GDP in 2019                                .
              2009   2010    2011     2012    2013     2014    2015     2016    2017 2018e 2019e

               Infrastructure industry value (€ bn)           Infrastructure industry value (% of GDP)

        Source: BMI International

              Greece’s pre-crisis rate (2000-2008):                                    Greece’s historic rate (2009-2019):                                          European rate (2009-2019):
                              3.0%                                                                    1.1%                                                                    1.9%

       BMI Infrastructure Investment incudes: Transport Infrastructure (Roads, Bridges, Railways, Airports, Ports and Waterways) and Energy & Utilities (Power Plants, Transmission Grids, Oil & Gas, Pipelines and
       Water infrastructure)
       *Infrastructure Investment data is derived from GDP by output figures from ELSTAT. Specifically, it measures the output of the Infrastructure industry over the reported 12-month period in nominal values. As it is
       derived from GDP data, it is a measure of value added within the industry , hence it does not measure the nominal value of all inputs used in the infrastructure industry
       ** Infrastructure gap= (European Average-Greek Average) * Years(2009-2019)*Average Greek GDP(2009-2019)
       ***for every Euro spent on infrastructure, GDP is further increased by € 0.8 (IMF Working paper “The welfare multiplier of Public Infrastructure Investment, 2016)                                 October 2020
       PwC                                                                                                                                                                                                             12
There is need for more investment in infrastructure

 • There is a large need for further infrastructure   • The quality of infrastructure in
   investment globally until 2040, estimated at         Greece is substantially inferior than
   $ 3.5trln per annum or 3.2% of global GDP            the level of wealth would predict

 • The average annual level of infrastructure         • The need for infrastructure
   investment in Greece between 2009 and 2019           investments in Greece in terms of
   stands at € 2.2bn, 61% lower than the historical     both capacity expansion and
   average of 2000-2008                                 quality improvement is evident

 • In Greece, there is a systematic infrastructure
   investment gap of 0.8pps of GDP (ca. € 1.5bn
   p.a.) or about € 13bn in total, over the past 10
   years

                                                                                                October 2020
PwC                                                                                                      13
3        Greek
    infrastructure
            projects
        pipeline
Between 2014 and 2019, 40
infrastructure projects were
completed totaling € 8.9bn

Budget of completed projects
(2014-2019)

                                              Motorway Projects
                                              Water & Sewage
                            7%                Energy Projects
                                              Energy Interconnection Projects
  79%                      6%
                   2%      4%                 Rail Projects
                        2%
                                              Tourist product upgrading

Source: Press, PwC calculations

Number of completed projects                                                    During 2019, 5 projects were completed with a total
                                        14                                      budget of € 566m. In more detail:

                                                     10                         • in the railway sector, the construction of the new line
                                                                                  in the section Tithorea-Domokos was completed
                                   5                               5            • in tourist product upgrading, the construction of the
                  4                                                               new terminal at Ioannina airport was completed
    2                                                                           • in the waste management sector, two waste
                                                                                  management projects were completed in Serres and
  2014          2015           2016    2017        2018           2019            Epirus
Source: Press, PwC calculations                                                 • in the energy sector, the gas compression station in
   Infrastructure in Greece 2019                                                  Kipoi was completed                            October 2020
   PwC                                                                                                                                    15
The average construction duration of
infrastructure projects in Greece is
about 5.3 years

Average construction duration
(in years)
                                                                            6.1
                                                             5.8

                                               4.5
                                    3.9
                       3.6
     2.7

     Energy     Rail Projects      Water &   Energy     Tourist product   Motorway
Interconnection                    Sewage    Projects     upgrading       Projects
    Projects

 From the projects that have been already completed since
 2014:
 • Motorways have the longest construction duration at 6.1
   years
 • The long construction duration of tourist upgrading projects
   is mainly attributed to delays in the execution of the projects
 • Energy interconnection projects are completed faster mainly
   because of the smaller scale of the projects completed so
   far
   Infrastructure in Greece 2019                                                     October 2020
   PwC                                                                                        16
32
Infrastructure projects pipeline amount to € 43.4bn

Most of energy and rail projects are in progress, 3 waste                                 Rail, energy and motorways require higher investment
management projects are about to be delivered, while                                      per project, compared to tourist infrastructure and waste
tourist product projects are still in initial development                                 management projects
stage

Pipeline budget* breakdown                           Estimated Completion year (cumulative)                                             14% of the pipeline budget
                                                     Number of projects                                                                 represents projects that
                         Planned                                                            63       64                                 have already commenced
                                                            Planned                  61
                           81 projects                                          57
                                                            In Progress 51                                                              7% of the projects, with a
86%                                                                                  24     26       27                                 remaining budget of around
                                                                                21                                 54 projects are in
                                                                        20                                                              €0.3bn, are estimated to be
                                                                                                                   early design
                               In Progress                                                                                              delivered in 2020
                                                                  26                                               phase with no
                     14%                                     20                                               54
                               37 projects                         3                                               announced            The commencement/
                                                                                36   37     37       37
                                                      8                 31                                         commencement         completion dates of 54
                                                             19   23
                                                                                                                   and completion       projects in early planning
                                                      8
                                                                                                              0    dates yet            phase, with a € 13.5bn
                                                    2020 2021 2022 2023 2024 2025 2026              2030     N/A                        budget, are unknown
Source: Press, PwC calculations                           Source: Press, PwC calculations
                                                                                                                                                      October 2020
PwC                                                                                                                                                            17
      * Infrastructure projects backlog and total budget of upcoming projects
Higher infrastructure pipeline
mainly due to the addition of
new high projects in the
preparation phase

 Evolution of 6-year infrastructure pipeline
 (2014-2019)

                                                                           € 43bn

                                                                                          In 2017, the infrastructure
                                                            € 25bn
                 € 21bn            € 21bn
                                                                             86.1%
                                                                          (81 projects)
                                                                                          pipeline was reduced due
 € 20bn
                                             € 19bn
   42.1%         40.4%         37.1%                       66.1%                          to the completion of
                                             40.5%
(46 projects) (48 projects) (34 projects) (37 projects) (51 projects_
                                                                                          mainly large motorway
   57.9%         59.6%         62.9%         59.5%
                                                             33.9%
                                                                                          projects. In 2019 there
(24 projects) (30 projects) (35 projects) (38 projects_                      13.9%
                                                          (37 projects_
                                                                          (37 projects)   was an increase of the
   2014           2015             2016       2017           2018            2019         pipeline due to
       Planned projects               Projects in progress                                announcement of new
Source: PwC calculations                                                                  projects
   Infrastructure in Greece 2019                                                                                   October 2020
   PwC                                                                                                                      18
Energy projects account for 58% of
the total budget

     Total remaining budget*
Waste Management

                      3.6%
            Rail                                                            • Waste management and water
                   7.7%
                                                     Energy                   supply get very little attention
                                             58.4%

 Urban Rail 12.3%                                                           • The share of rail projects stands
                                                                              at 7.7%
                     13.8%

       Motorways              4.2%

                   Tourist product upgrading

 * Infrastructure backlog and total budget of upcoming projects
  Source: Press, PwC calculations

Subsector & project budget                                                                                                        • There are 20 Energy projects
            Transportation                                            Energy                                Water & Waste          and take up more than half of
                                     44
  € 5.3bn
                                                              € 8.2bn
                                                                              € 9.0bn                       Management             the pipeline budget (58%)
                                                 € 7.4bn
Urban Rail                       € 6.4bn
    24                                                                                                                            • 20% of the remaining
                                                                                                              18
                                                                                                                                    budget covers rail projects
    Rail
                      5                                                                                     € 1.4bn
                                                                                                                           7       (24 projects), while 14% (26
  € 3.3bn                                                                                  € 0.8bn
                                                   11                                                                              projects) motorways
                                                                  6                                                     € 0.0bn
                   € 1.4bn                                                                     2
                                                                                 1
    Rail           Airports       Transit         Energy        Oil and      Solar/Wind   Hydroelectric      Waste      Water &
                              Transport, Ports                Natural Gas                                  Management   Sewage

Source: Press, PwC calculations                                             Remaining Budget              Number of projects
                                                                                                                                                        October 2020
    PwC                                                                                                                                                          19
Energy projects amount
to ca. € 25.4 bn

Estimated Completion year (cumulative)                        Number of
Number of projects                                          projects with no
                                                     16
                                           15                 announced
                                      14
                                 13                        commencement/c
                                                            ompletion dates
                        10                 8         9
                                 6    7
                  7
                         5
           4                                                      4
   2                             7    7    7         7
           4      5      5
   2
  2020 2021 2022 2023 2024 2025 2026                2030         N/A

        Planned              In Progress
  Source: Press, PwC calculations

 • 60% of the number of                         • 54% of the remaining
   energy projects are                            budget is earmarked for
   interconnections (TAP,                         energy interconnections
   IGB, EuroAsia, Ariadne,                        and the rest for
   EastMed), while the                            electricity generation
   remaining 40% refers to
                                                • More than half of the
   electricity generation
                                                  total energy projects
   (Wind and solar parks,
                                                  have not yet started
   Power plants)

 Infrastructure in Greece 2019                                                 October 2020
 PwC                                                                                    20
32
   Electricity interconnection projects account for 32% of the
   budget while electricity generation projects for 27%
  Energy projects                                    Electricity generation sources
  Remaining budget 2019 (€ mn)                       % of remaining budget 2019
                          25,368                                                                      • Natural gas and electricity
                                                                                                        interconnectors take up about
TAP, IGB, EastMed          7,216                                                                        54% of the remaining
                                                                                                        budget
         Electricity                                                                    Natural Gas
   Interconnectors
                           5,547                                                11.8%                 • About 84% of the total
                                               Wind/Solar 76.0%                                         remaining budget of scheduled
         Electricity                                                               5.5% Lignite
                                                                           2.4%                         electricity generation projects
        generation                                                                4.2%
                          11,656                                                                        refers to renewable energy
             LNGs                                                                      Hydro
                                                                                      Hybrid
             Other                                                                                    • The average cost per new MW
                       569       380
                                                                                                        installed is about € 1mn.
                 Remaining Budget(€ bn)

      PwC                                                                                                                           21
             Source: Press, PwC calculations          Source: Press, PwC calculations
Bulgaria                  Bulgaria

                                                                                                          Energy projects
                                                                                                          geographical
Albania

                                                                                                          distribution
                                                                                                          •   East-Med pipeline, with a total length of 1,900 km,
                                                                                                              will directly connect the energy sources of the
                                                                                                              Eastern Mediterranean with Greece’s mainland via
                                                                                                              Cyprus and Crete, with a capacity of 10 bn m³ per
                                                                                                              year
                                                                                                          • Trans-Adriatic Pipeline of 878 km in total will supply
                                                                                                            Europe with natural gas from Azerbaijan through
                                                                                                            Greece, Albania and Italy, with a capacity of 20 bn m³
                                                                                                            per annum
                                                                                                          • Ptolemaida V Power Plant: New single lignite power
                                                                                                            plant of 660 MW and 140 MW for district heating
                                                                                                            (PPC)
                                                                                                          • Attica – Crete and Peloponnese – Crete
                                                                                          Cyprus
                                                                                                            Interconnectors: Underwater electric cables
                                                                                                            connecting Crete with mainland with a capacity of
                                        Electricity                      Kavala storage facility            1,000 MW and 400MW respectively
          TAP                           Interconnectors                  (Underground Storage facility)
                                                                                                          • IGB: Natural gas pipeline of 182km length will
          Electricity
          Interconnectors           Natural Gas Station                                                     connect the Greek and Bulgarian existing networks,
                                                                         Siteia and Rethymno Hybrid
          of Cyclades                                                    Stations                           with daily transport capacity of 13,7 mn m³ and
                                                                                                            approximately 3-5 bn m³ per year
                                    Ptolemaida V Power
          IGB                                                            Elpedison gas-fired              • Alexandroupoli Independent Natural Gas System:
                                    Plant (lignite fired)
                                                                         electricity power plant
          Development of                                                                                    New offshore LNG with 28 km length of subsea and
          distribution of natural   Amfilohia Hydro-                                                        onshore pipeline (4 km onshore and 24 km offshore),
          gas network               pumped storage                       Volton gas-fired                   with storage capacity of 170k m³ and pumping
                                                                         electricity power plant
                                    Mytilineos gas-fired                                                    capacity of 6,1bcm per year
          East-Med                  electricity power plant

          GEK Terna gas-fired       Copelouzos gas-fired                                                                                               October 2020
PwC       electricity power plant   electricity power plant                                                                                                     22
Rail projects amount to € 8.7bn

Estimated Completion year (cumulative)                             Number of
Number of projects                                               projects with no
                                                                   announced
                                                                commencement/
                                                    13          completion dates
                                            11                         11
                                                    3
                                     9      1
                                     1
                          5
                  4                         10      10
                                     8
    1             4       5
    1
  2020        2021       2022       2023   2024    2025               N/A

        Planned       In progress
 Source: Press, PwC calculations

• 32% of the rail projects account to      • The percentage of electrified lines in
  urban rail interconnections (Attiko        Greece is only 30% compared to the
  Metro, Tram, Metro Thessaloniki),          European average of 58%
  while the remaining 68% to regional        (International Union of Railways,
  rail projects                              2018). However, Greece is making
• Less than half of the rail projects        progress in rail electrification by
  have already started with further Attiko   converting and adding about 753 km
  Metro and Thessaloniki Metro               of electrified lines to the national
  extensions and some Ergose upgrades network
  in planning
• In 2020, the Kiato-Rododafni section
  was completed, while the extension of
  tram to Piraeus is expected to be
  delivered within this year                                                          October 2020
 PwC                                                                                           23
32
Urban rail are the main part of the total rail investment and
account for 62% of the remaining rail budget

    Rail projects and Urban Rail projects     Urban Rail projects                                   • 38% of the remaining budget accounts
    Remaining budget breakdown (€ bn)         Remaining budget breakdown (€ bn)                       to rail projects, while the remaining 62%
                             8.7                                                                      to urban rail
                                                              0.2%                                  • Attiko Metro’s new lines and extensions
                                                                                                      are the largest urban rail projects, with
        Rail Projects       3.3                                                                       a total budget of € 3.6bn taking up
                                                     31.8%
                                                                                                      about 68% of the remaining budget of
                                                                                                      the urban rail projects
                                                                                                    • The average investment in railway
                                                                       68.0%                          projects is estimated at € 7.8mn/km,
Urban Rail Projects         5.3
                                                                               Attiko Metro
                                                                                                      while the respective investment in
                                                                                                      urban railways stands at € 93.2mn/km
                                                                               Metro Thessaloniki
                                                                               Athens Tram

    Source: Press, PwC calculations         Source: Press, PwC calculations                                                        October 2020
  PwC                                                                                                                                       24
Attica                                    Rail projects
                                                                                                geographical
                                                                                                distribution
                                                                                                •   The completion of the Thessaloniki metro and
                                                                                                    its extension to Kalamaria (14.3 km) will serve
                                                                                                    about 300 thousand passengers per day
                                                                                                •   The new Metro Line 4 in Athens with 33km
                                                                                                    length (31 new stations) is expected to serve
                                                                                                    around 500k passengers daily, especially at
                                                                                                    densely populated areas (Kipseli, Pagrati,
                                                                                                    Zografou)
                                                                                                •   The extension of the Athens metro to Piraeus
                                                                                                    (3 new stations) that connects Athens
                                                                                                    International Airport with the port of Piraeus
                                                                                                    will increase the current capacity to about 120
                                                                                                    thousand passengers per day
                                                                                                •   Tram extension from N. Faliro to Piraeus
                                                                                                    (5.3km) will have a daily capacity of 100k
      Thessaloniki             ERGOSE                  ERGOSE                Kryoneri train
                                                                                                    passengers
      Metro                    Rhododafni              Upgrade of Athens     station            •   Construction of double rail tracks and upgrading
                                                       Train Station
      ERGOSE                                                                                        of signaling and electrification of the main OSE
                               ERGOSE                  ERGOSE Volos          Neos                   network to improve customer service and time
      Palaiofarsalos
                               Polikastro                                    Panteleiomonas         of travel rendering rail an efficient alternative for
      ERGOSE Loutraki-                                 Attiko Metro Line 4   train station
                               Upgrade of the                                                       long distance travel
      Isthmos
                               network in Sepolia                            Western Attica
                                                                                                •   The construction and electrification of the Kiato
      Athens Tram                                                            suburban railway
                               Connection of the       Attiko Metro,                                to Patras will connect Athens to Patras and
      Extension N. Faliro to                                                 upgrade
                               Port of Kavala          Extension of Line 3                          Northern Peloponnese again after a long time
      Piraeus                                          to Piraeus
      ERGOSE                   Thessaloniki-Kavala-    Suburban railway
      Promachonas              Xanthi                  extension to Rafina
      ERGOSE                   Connection of           Suburban railway
      Mouries                  OLTH                    extension to Laurio                                                                October 2020
PwC                                                                                                                                                25
Motorways investment pipeline is
about € 6bn
                                                                 Number of
                                                               projects with no
   Estimated Completion year (cumulative)                        announced
   Number of projects                                         commencement/
                                                              completion dates
                                                     14
                                      13      13
                              12
                                                                     12

                                       8      8      9
                              8

                 1     1      4        5      5      5

        0       1      1
                                                                    N/A
    2020       2021   2022   2023     2024   2025   2026

            Planned     In progress
   Source: Press, PwC calculations

• After the completion of many               of which only 9% has already
  large motorway projects in 2017,           been constructed
  the only major road projects in •          The average cost of motorway
  the pipeline are the Crete                 construction in Greece is
  Northern highway, the southern             € 4.7mn per km
  and northern parts of E65 and
                                   •         Most of the motorway projects
  the Patras-Pyrgos link
                                             are still in the designing phase
• The total motorway kilometers of
  planned and in progress projects
  in Greece amount to 1,184 km,

                                                                                  October 2020
  PwC                                                                                      26
Motorway projects
Egnatia
Odos
                                                                                                   geographical
                                                                                                   distribution
                                                                                                   •   Egnatia Odos vertical Axes will connect the
                                                                                                       main part of Egnatia Odos with Bulgaria and
                                                                                                       Serres with Drama and Kavala
                                                                                                   •   Ionia Odos side Axis, with a length of
                                                                                                       48.5km will connect Aktio to Amvrakia
                                                                                                   •   The Central Greece Motorway (part of the E65
                                                                                                       Motorway) is under construction with a total
                                                                                                       length of 17 5km and will connect Lamia,
                                                                                                       Karditsa and Trikala to Egnatia Odos
                                                                                                   •   The Patras-Pyrgos Motorway is a physical
                                                                                                       extension of Olympia Odos with a total length
                                                                                                       of 75 km and will establish a better
                                                                                                       connection between the two cities
                                                                                                   •   Crete Northern highway is one of the largest
     Katerini Ring            Underwater            Pontokomi Kozani      Delta-Kardista               projects that was announced in 2018, with a
     Road                     tunnels               road network          connection
                                                                                                       total length of 300km
     Vertical axes of         Kalo Nero – Tsakona   Lefkada-Aktio         OLTH-P.A.TH.E.
     Egnatia Odos             road axis             connection            connection               •   The total motorway construction cost in
                                                                                                       Greece in 2016 was € 3.4bn, while the rest of
     Crete Northern           Motorway Ε65          Larissa-Magnisia      Thessaloniki Ring
     Highway                                        coastal road          Road
                                                                                                       the EU averaged € 6.6bn (Overview of
                                                                                                       transport infrastructure expenditures and
     Vertical axis of Ionia   Patras-Pyrgos         Circumvention of      Attiki Odos extensions       costs, EC, 2019)
     Odos Aktio-Amvrakia      Motorway              Pythagorio – Samos

     Thessaloniki – Doirani   Circumvention         Larissa-Trikala new   Southern circumvention
     Road Axis                of Chalkida           road section          of Mytilene

     Kalamata-Methoni         Circumvention         Thermi-Galatista      Connection of Rhodes
     road axis                of Lagkadia           connection            airport

   PwC                                                                                                                                          27
For the upgrading of the tourist
product around € 1.8bn have been
scheduled
                                                          Number of
Estimated Completion year (cumulative)                  projects with no
                                                          announced
Number of projects                                     commencement/c
                                                        ompletion dates

                                                               15

                                          8      8
                           7       7
                   6                      1      1
                           1       1
            4
   2               6       6       6      7      7
            4
   2
  2020    2021    2022    2023    2024   2025   2026          N/A

       Planned      In progress
Source: Press, PwC calculations

• 65% of the tourist infrastructure projects are not even fully
  planned except from the new dock at the Port of Thessaloniki
  which is scheduled to be completed by 2023
• There is no information on the construction of the key marinas
  (Katakolo & Zakynthos, Glyfada hub, Patra hub, Chios hub, Crete
  hub, Pylos hub and Aretsou Kalamarias hub) except for the
  marina of Symi which was delivered in 2018
• The average budget for tourist infrastructure amounts to
  €78.7mn per project

                                                                           October 2020
PwC                                                                                 28
Tourist
                                                                                 infrastructure
                                                                                 geographical
                                                                                 distribution
                                                                                 •   Greece is a significant global tourist destination,
                                                                                     attracting 34mn arrivals in 2019, and € 18bn in
                                                                                     tourist receipts
                                                                                 •   Despite being a global tourist attraction, the tourist
                                                                                     infrastructure quality in Greece is of low quality
                                                                                 •   For Greece to remain a top global tourist
                                                                                     destination it is necessary to:
                                                                                     o complete the upgrade of the 14 regional
                                                                                       airports acquired by the Slentel-Fraport joint
                                                                                       venture and upgrade the second wave of
                                                                                       airport privatizations as well as the
                                                                                       construction of the new airport in Kasteli
                                                                                     o upgrade vital ports to serve as transit
                                                                                       terminals and facilitate interconnection with
                                                                                       neighbor countries
                                                                                     o modernise key marina hubs (Alimos,
                                                                                       Kalamaria, Chios, Crete, Glyfada, Zakynthos &
      Regional Airports (Joint venture      Athens International Airport Small
                                            expansion
                                                                                       Katakolo, Patra, Pylos and Rhodes & Kos) to
      Slentel-Fraport)
                                                                                       meet the increasing demand in marine tourism
      Marinas Upgrade                       Athens International Airport Large
                                            expansion
      Ports Upgrade                         Kasteli Airport

      Marina of Nafplio                     Cruise dock expansion in OLP

      Metropolitan Water Airport (Port of   Upgrade of OLTH                                                                     October 2020
PwC   Thessaloniki)                                                                                                                        29
Waste management projects
need about € 1.6bn
                                                        Number of
Estimated Completion year (cumulative)                 projects with
Number of projects                                    no announced
                                                      commenceme
                                                      nt/completion
                                       13     13
                                                          dates
                                                            12
                                       5      5

                  7           7
                  1           1

       3                               8      8
                  6           6
       3

      2020       2021        2022     2023   2024          N/A

       Planned          In progress

Source: Press, PwC calculations

• During 2019, 2 PPP waste management projects were completed in
  Serres and Epirus
• Also, 3 waste management projects are expected to be completed
  in 2020 (Voiotia, Alexandroupoli and the center of sewage treatment
  in Koropi-Paiania)
• The average budget of waste management projects amounts to
  € 62.4mn per project

                                                                        October 2020
PwC                                                                              30
Waste Management
                                                                                (Alexandroupoli)

                                                                                                                                          Waste
                            Rainwater drainage (Lachanagora
                            Thessaloniki, Kalamaria)

                                                                                                                                          management
                                                                                                                                          projects
    Waste Management (Kerkyra)
                                                                                                     Floodplain projects
                                                                                                     (Aspropyrgos, Menidi)
    Waste Management
    Aetoloakarnania
                                                                                                         Floodplain projects (Eschatia,
                                                                                                         Erasinos, Rafina. Nea Makri,     geographical
                                                                                                                                          distribution
                                                                                                         Agios Georgios torrents)
    Waste Management (Voiotia)

                                                                                                                          Waste
    Waste Management (Achaia)                                                                                             Management
                                                                                                                          (Rhodes)

    Waste Management (Ilia)
                                                                                                                                          Municipal waste treatment
    Waste Management
                                                                                                                                          2018
                                                                                                   Waste
    (Peloponnisos)
                                                                                                   Management
                                          Centers of Sewage Treatment (Koropi-                     (Amari)                     Switzerland                    48%                            31%                    22%  0%
    Water Pipeline Aegina                                                                                                          Sweden                                                         30%                16% 1%
                                          Paiania, Rafina - Artemida& Marathonas)
                                                                                                                                    Finland                        57%                              29%              13% 1%
                                                                                                                                 Germany                32%                             50%                         18%  1%
                                                                                                                                   Belgium                                                  35%                 20%       1%

•    The new National Waste Management Plan (NWMP) 2020-2030 was voted to manage all of the waste                                 Denmark                                                     32%                   18%    1%
                                                                                                                               Netherlands                   43%                       27%                     29%         1%
     generated in Greece, which sums up to 31 mn tonnes per year. Furthermore, it emphasises on recycling and
                                                                                                                                     Austria              39%                         26%                     33%          2%
     separation at source. More specifically, it provides for the universal separate collection of bio-waste for the total
                                                                                                                              Luxembourg                     44%                        28%                   22%         6%
     of the country by the end of 2022, a year earlier than the community directive. At the same time, it provides for     United Kingdom                    41%                       27%               17%         15%
     the acceleration of the attempts for the separate collection of 4 streams for recycling and also for the priority of            France              35%                     25%               19%              21%
     the support of the recyclable material collection network. Moreover, it sets high recycling targets, in the frame of               Italy      21%                    32%                 23%               24%
     community responsibilities                                                                                                       EU 27            27%                  31%                   17%           24%
•    Another major aim of the new NWMP is the recovery and the use of the Non Dangerous Industrial Waste                          Lithuania      14%               27%                  32%                     27%
     (NDIW) from the waste management units. The adoption of cyclical economy principles is advocated for the                        Poland         24%                   26%          8%                 42%

     utilization NDIW as secondary raw material and/or alternative fuels                                                           Czechia        17%               27%          7%                     49%
                                                                                                                                   Hungary       13%               29%           8%                     49%
•    The main targets of the new NWMP 2020-2030 are:                                                                               Portugal       19%          13%         17%                          51%
     o Decrease of the landfill percentage to 10% until 2030                                                                          Spain                  18%           18%                          51%
     o Put a stop on the uncontrollable waste disposal and the rehabilitation of illegal landfills by 2022                        Slovakia                   27%           10%                      55%
     o Increase of recycling to 55% by 2025 and to 60% by 2030                                                                     Bulgaria                  30%          2%                       61%

     o Separate the collection of organic waste (brown bins) and development of the required infrastructure throughout              Croatia         25%         3%                            72%

       the country by 2022                                                                                                         Greece*        15% 4%                                    80%

     o Total coverage of the country until 2030 with 43 Waste Management Units and 43 -46 Bio-waste Management                     Cyprus*        15% 2%                                    82%

       Units                                                                                                                           Malta    7%                                    93%

      o Four power generation units with energy recovery form the residues of the Waste Management Units                                               Total Incinerated                Composted
                                                                                                                                                       Recycled                         Landfilled
        PwC                                                                                                                                     Source: Eurostat, *(2017 Data)                                            31
The current project portfolio is heavy on energy and
 transport and short on non electricity connectivity and
 tourism
                                                      • The energy sector accounts for almost 58% of the pipeline
      • The value of 118 infrastructure projects in     of all projects, while the transport sector accounts for about
        progress or planned is standing at € 43.4bn     34% of the remaining budget. The smooth evolution of
                                                        those investments will have a very positive impact in
      • Projects in progress account for 14% of the
        estimated investment                            economy

      • For 46% of the projects, commencement and     • Investments in tourism product upgrade (4%), as well as in
        completion dates are not known                  waste management and water supply (4%) are important
                                                        for tourism growth and the upgrade of life quality

                                                                                                                    October 2020
PwC                                                                                                                          32
32
In total, 37 infrastructure projects are already in progress, while the
majority of the projects are in the process of planning and maturing, with
52 still in early stages

Projects per phase                                                       Projects per phase
Total Budget                                                             Number of projects
                                                                                                                       60% of the total budget is
                                                                                                                       accounted for projects that are
                                          Phase B                                                            Phase B   still in the planning and
                                € 6.9bn                                                                 29             maturity phase, 14% refers to
                                 (14%)                                                                                 projects that are in the bidding
                                                                    Phase A 52                                         and contracting phase, while
        € 30.4bn
Phase A                                                                                                                26% of the total budget refers
         (60%)
                                 € 13.2bn                                                                              to projects already in progress
                                  (26%)
                                               Phase C                                                                 In absolute numbers, from the
                                                                                                       37              total of infrastructure projects
                                                                                                        Phase C
                                                                                                                       52 are in early phases, 29 in
                                                                                                                       Phase B and 37 in progress

Source: PwC Analysis                                                    Source: PwC Analysis

             Phase A: Refers to projects that are in the process of planning, designing and maturing                                      October 2020
 PwC         Phase B: Refers to projects that are in the process of bidding and contracting                                                        33
             Phase C: Refers to projects that are already in construction
The majority of airport and urban rail projects
are in the construction phase, while most of the
road and port projects as well as energy and
waste management projects are behind the
starting line

Projects by subsector and phase
Number of projects                                                                                                           Over 50% of the projects in
                Transportation                                         Energy                             Water and          airports and the urban rail
                                                                                                           waste
                                                                                                         management
                                                                                                                             network are in construction, while
                                                                                                                             projects in roads and ports are
                              17%                                                                                   14%
                                                                                                                             still in early stages
   20%
                                                                   33%
                 50%          17%          48%          45%
                                                                                                        50%                  In energy, renewable energy
                                                                                                                    43%      projects lag behind significantly
                                                                   17%
                                                                               100%        100%
                 17%
                                                        18%                                                                  The largest percentage of water
   80%                                                                                                  22%
                              67%          34%                                                                               and waste management projects
                                                                   50%
                                                                                                                    43%
                                                                                                                             are either in phase A or phase B,
                                                        36%
                 33%
                                                                                                        28%                  with a small number of projects
                                           18%
                                                                                                                             already underway
  Airports     Railways      Urban      Roads, Ports   Energy    Oil and    Solar/ Wind Hydroelectric   Waste      Water &
                            Railways                            Natural Gas                           Management   Sewage

    Phase A            Phase B         Phase C

Source: PwC Analysis
    Infrastructure in Greece 2019                                                                                                                     October 2020
    PwC                                                                                                                                                        34
32
The majority of infrastructure projects that are fund by the NSRF have not
been completed yet, with the level of payments still at very low levels

      NSRF Funding (2014-2019)                                             NSRF Funding (2014-2019) by theme*
      € bn
             9.9                        9.7
             0.1                        0.1

                                                                                            34%                         31%

             9.8                        9.6
                                                                    2.8
                                                                    0.1
                                                                                                           34%
                                                                    2.7
                                                                                 Sustainable Transportation:
        Total Budget                 Subsidies                  Payments         Includes motorway, rail and port projects etc.
                                                                                 Low Emission Economy:
           Completed projects:
                                                                                 Includes urban railway and energy network projects as well as energy
           Refers to projects that have been completed until 2018                upgrading of public buildingσ
           Active projects:                                                      Environment protection:
           Refers to projects that have not been completed until 2019            Includes waste management projects, water supply and sewage networks
                                                                                 as well as the preservation and restoration of the cultural heritage
      Source: Ministry of Development and Investments                      *Based on the total budget of the projects

                                                                            Source: Ministry of Development and Investments
PwC                                                                                                                                     35
Infrastructure projects in Greece could be accelerated

    32
                                  significantly, if the private sector’s contribution could
                                  be actively used, through the mechanism of unsolicited
                                  proposals
                                  Approval stages of unsolicited proposals

                                                         Presentation of the                                          Submitting of a
                                                         USPs                                                         completed

                                      Private sector
Unsolicited proposals                                                                                                 proposal
(USP) is a proposal made by
a private party to undertake a
project, submitted at the                                                            Completion of detailed studies

initiative of the private firm,
rather than in response to a                                 Preliminary                                                     In-depth
                                                                                                                                                         Bidding
                                      Public Sector                                                                                                      process
request from the government                                  assessment                                                      analysis
                                                                                                                                                       preparation

                                                                     Declaration of “public
                                                                                                                                        Approval or
                                                                       interest”; additional                                                                         Call for public
                                                                                                                                        rejection of
                                                                     information or studies                                                                              tender
                                                                                                                                         proposal
                                                                            requested

                                  Projects assignation mechanisms through unsolicited proposals

                                  1                    Bonus Mechanism                                                2     Automatic promotion to the 2nd phase
                                  •                    Bonus offering to the private firm that
                                                       proposed the USP during the proposal                           •      The private firm that submitted the proposal is
                                                       assessment                                                            directly promoted to either the binding offer
                                  •                    The bonus is not significant so that the                              stage or the final selection stage
                                                       competition is increased

                                  3                    Right to Match                                                 4     Direct Negotiations
                                                                                                                      •      In outstanding occasions, direct negotiations
                                  •                    The firm that submitted the unsolicited                               with the firm that submitted the USP are
                                                       proposal can match a more competitive offer                           justified, for example in the case of a
                                                       to win the tender                                                     strategical advantage (e.g. property
                                                                                                                             ownership)                        February 2018
  PwC                                                                                                                                                                          36
Appendix I– Infrastructure projects* in Greece

               15   Energy projects

               21   Rail projects
               11   Motorway projects

               15   Tourist infrastructure projects

               25   Waste management projects
                                      * Some projects have been grouped together and thus projects depicted at the
                                      tables do not add up to 118 projects

 PwC
PwC
Infrastructure pipeline for the energy sector reaches € 25.4bn of
investments (1/2)

                                                             Total Budget Remaining Budget                Completion
No Power Generation                          Capacity (MW)                                   Start Date
                                                                (€ mn)         (€ mn)                       Date*

1 Ptolemaida 5 Power Plant (lignite fired)       660            1,400           600            2015         2022

2 Mytilineos gas-fired power plant               665            300             120            2019         2021

3 Elpedison gas-fired power plant                826            400             400            2021         2023

4 Copelouzos Group gas-fired power plant         660            350             350             N/A          N/A

5 Volton power plant                             660            350             350             N/A         2024

6 Amfilochia Hydro-pumped storage                680            502             502             N/A          N/A

7 Hybrid Stations in Siteia and Rethymno         139            280             280             N/A          N/A

8 Renewable Energy sources (Wind, Solar)        8,500           9,000          9,000           2020         2030

   Total Budget                                                12,582         11,602

      *Commissioning date
                                                                                                             October 2020
      Source: Press, PwC calculations
PwC                                                                                                                    38
Infrastructure pipeline for the energy sector reaches € 25.4bn of
investments (2/2)
                                                                          Total Budget   Remaining Budget                  Completion
No Interconnection Projects                               Capacity (MW)                                      Start Date
                                                                             (€ mn)           (€ mn)                         Date*

1 TAP (Trans - Adriatic Pipeline)                             N/A            1,500             120             2016           2020

  Electricity Interconnectors (Ariadne Interconnection,                                                     2018 | 2014 | 2020 | 2024 |
2 Cyclades, Maritsa East (BG) - Nea Santa (GR),Aegean        4,652           6,141            5,547          2020 | N/A | 2022 | 2026 |
  Project, EuroAfrica Inteconnector)                                                                            N/A          2023

3 Alexandroupoli LNG                                          N/A             380              380             2020           2022

4 Kavala storage facility (Undeground Storage facility)       N/A             400              400              N/A           N/A

5 IGB (GR-BG Natural Gas pipeline)                            N/A             240              96              2019           2021

  Development of natural gas distribution network in
6 the regions of Macedonia, Thrace, Western Greece,           N/A             270              169             2020           2023
  Epirus and Sterea Ellada

7 East-Med Pipeline                                           N/A            7,000            7,000            2022           2025

      Total Budget                                                          15,931           13,712

      *Commissioning date
                                                                                                                               October 2020
      Source: Press, PwC calculations
PwC                                                                                                                                     39
Rail projects amount to € 8.7bn, with 62% coming from urban rail
 projects
                                                                                                                                                               Completion
No Upcoming Projects                                           Details                          Total Budget (€ mn)   Remaining Budget (€ mn)   Start Date
                                                                                                                                                                 Date

                                     Extension of Line 3 to Piraeus, New Line 4, Line 4
1    Attiko Metro                                                                                      4,050                   3,630            2012|N/A         2022|N/A
                                     Extension to Perissos and Lykovrisi
                                     Main line & Extensions to Kalamaria and Western                                                            2006|N/A|       2023|N/A|
2    Thessaloniki Metro                                                                                2,660                   1,698
                                     suburbs                                                                                                      2014            2023
3    Athens Tram                     Extension to Piraeus                                               62                      13                2013             2020
     Total                                                                                             6,772                   5,341

                                                                                                                                                               Completion
No Upcoming Projects                                           Details                          Total Budget (€ mn)   Remaining Budget (€ mn)   Start Date
                                                                                                                                                                 Date

1    Ergose Palaiofarsalos           Palaiofarsalos - Kalambaka (electrification of railways)           54                      54                 N/A             N/A
2    Ergose Volos                    Volos – Larissa (electrification of railways)                      66                      66                2020             2023
3    Ergose Polikastro               Polikastro - Idomeni                                              113                      24                2007             2021
                                     Connection of the Port of Kavala to the existing
4    Ergose Port of Kavala                                                                             250                     250                 N/A             N/A
                                     Thessaloniki-Alexandroupoli line
5    Ergose Central Macedonia        Upgrade of the network in Central Macedonia                        35                      14                2019             2021
6    Ergose Athens                   Upgrade of Athens Train Station                                    44                      44                2020             2024
7    Ergose Promachonas              Upgrade of existing line Thessaloniki-Promachonas                 150                     150                2022             2025
                                     Rhododafni-Psathopyrgos, Psathopyrgos-Patras and
8    Ergose Patras                                                                                    1,913                    785                2006             2023
                                     electrification of railways
9    Ergose Xanthi                   Thessaloniki-Kavala-Xanthi new line                              1,000                    1,000               N/A             N/A
10 Ergose Sepolia                    Ergose: Upgrade of the network in Sepolia                          67                      67                2020             2024

11 Ergose Loutraki                   Upgrade of the existing line Isthmos-Loutraki                      6                       3                 2019             2021

12 Ergose Mouries                    Upgrade of the existing line Thessaloniki-Mouries                  65                      65                 N/A             N/A
                                     Connection of the 6th dock of OLTH to the railroad
13 Ergose OLTH                                                                                          22                      22                 N/A             N/A
                                     network
14 Ergose Neos Panteleimon           Construction of a new station in Neos Panteleimon                  1                       1                 2021             2025
15 Ergose Kryoneri                   Construction of a new station in Kryoneri                          7                       7                  N/A             N/A
16 Western Attica suburban railway   Upgrade of suburban railway in Western Attica                      98                      98                 N/A             N/A
   Athens Suburban Railway:          Extension of Athens Suburban Railway from Koropi to
17                                                                                                     380                     380                 N/A             N/A
   Extension to Laurio               Laurio
   Athens Suburban Railway:          Extension of Athens Suburban Railway from Athens
18                                                                                                     300                     300                 N/A             N/A
   Extension to Port of Rafina       International Airport to Port of Rafina                                                                             Σεπτέμβριος 2020
   Total                                                                                              4,571                    3,330                                  40
    PwC
Source: Press, PwC calculations
Motorways investment pipeline is about € 6bn
                                                                                                            Remaining                                    Average
                                                                                             Total Budget                                Estimated
Νο    Upcoming Projects                             Details                      Total Klm                   Budget       Start Date                   investment/
                                                                                                (€ mn)                                 Completion Date
                                                                                                              (€ mn)                                       km
                                  Chania - Chersonissos, Chersonissos -
1     Crete Northern Highway                                                       275          1,415         1,415          N/A              N/A             5.2
                                  Neapoli & Neapoli - Agios Nikolaos
      E65 Motorway (Lamia-
2                                 Lamia - Xyniada & Trikala - Egnatia              175           706           307           2008            2024             4.0
      Egnatia)

3     Egnatia Odos                Vertical axes*                                   296          1.046         1.012          2011            2021             3.5

4     Ionia Odos                  Aktion-Amvrakia Vertical Axis                     49           160           75            2010            2023             3.3
                                  Ring road of Katerini, Thessaloniki-Doirani,
                                  Circumvention of Chalkida, Circumvention of
                                  Lagkadia, Kalamata-Rizomylos-Pylos-
                                  Methoni, Kalo Nero - Tsakona, Pontokomi                                                2013|2011|N/A| 2023|2023|N/A|N/
                                  Kozani road network, Lefkada-Aktio, Coastal                                           N/A|N/A|N/A|202 A|N/A|N/A|2023|2
5     Regional roads              road axis Larissa-Magnisia, Pythagorio-          292          1,116         1,055     0|2020|2020|N/A 023|2023|N/A|202      3.8
                                  Samos circumvention, Larissa-Trikala,                                                 |2020|2020|2020 3|2023|2023|N/A|
                                  Thermi-Galatista, Karditsa-Delta, Southern                                              |N/A|N/A|N/A       N/A|N/A
                                  Circumvention of Mytilene, Drama-Amfipoli,
                                  Connection of the city of Rhodes to Rhodes
                                  airport
      Underwater tunnel           Underwater connection of Salamina and
6                                                                                   5            450           450           N/A              N/A            91.8
      Salaminas                   Perama
                                  Underwater connection of Lefkada and
7     Underwater tunnel Lefkada                                                     3            50            50            N/A              N/A            16.7
                                  Etoloakarnania

8     Patras-Pyrgos Motorway      Patras-Pyrgos                                     75           300           300           N/A             2023             4.0
                                  Connection of the 6th dock of OLTH to
9     Connection of OLTH                                                            2            32            32            2020            2023            15.3
                                  P.A.TH.E.
10    Thessaloniki Ring road      Thessaloniki Internal Ring road flyover           14           300           300           2022            2026            21.4
                                  Extensions of Attiki Odos to Kymis Avenue,
11    Attiki Odos extensions                                                       Ν/Α          1,000         1,000          N/A              N/A            N/A
                                  Ilioupoli and Rafina
      Total Budget                                                                 1,184        6,575         5,997                                           4.7
Source: Press, PwC calculations                                                                                                                     October 2020
     PwC                                                                                                                                                     41
For the upgrading of the tourist product around € 1.8bn have been
scheduled
                                                                        Remaining Budget
 No     Projects                                  Total Budget (€ mn)                      Start Date   Completion Date
                                                                             (€ mn)
  1    Kasteli Airport in Heraklion                      500                  500            2020            2025

  2    Regional Aiports                                  415                  166            2017            2021

  3    OLTH, new dock                                    170                  170            2020            2023

  4    Igoumenitsa Port upgrade                          135                   32            2008            2021

  5    Macedonia Airport upgrade                         180                   17            2005            2020

  6    Athens International Airport expansion            700                  700             N/A            N/A

  7    Key marinas                                       42                    42             N/A            N/A

  8    Luxury marines (Mykonos, Argostoli)                9                    9              N/A            N/A

  9    Upgrading/ Maintenance of Regional Ports           4                    4             2020            N/A

 10 Layrio Mega Yacht                                     4                    4              N/A            N/A

 11 New cruiseship dock in OLP                           103                  103            2020            2022
       Athens International Airport Small
 12                                                      18                    5             2018            2020
       expansion
 13 Construction of a new marina in Nafplio               9                    9              N/A            N/A

 14 Upgrading of Marina of Alimos                        50                    50            2020            2022
       Port of Thessaloniki- Metropolitan Water
 15                                                      0.4                  0.4             N/A            N/A
       Airport
         Total Budget                                   2,340                1,811

Source: Press, PwC calculations
                                                                                                              October 2020
 PwC                                                                                                                   42
Waste management projects need about € 1.6bn (1/2)
                                                                                     Remaining
  No      Projects                                            Total Budget (€ mn)                   Start Date   Completion Date
                                                                                    Budget (€ mn)
   1    Center of Sewage Treatment (Koropi - Paiania)                125                 26           2013            2020

   2    Waste management (Aetoloakarnania)                           28                  28            N/A            N/A

   3    Waste management (Ilia)                                      39                  16           2019            2021

   4    Waste management (Peloponissos)                              168                168           2020            2021

   5    Waste management (Alexandroupoli)                            58                  14           2019            2020

   6    Water Pipeline Aegina                                        22                  9            2018            2021

   7    Waste management (Voiotia)                                   16                  4            2017            2020
        Connection of Pallini and Gerakas Sewage Systems to
   8                                                                 72                  72            N/A            N/A
        Psyttaleia
   9    Center of Sewage Treatment (Marathonas)                      120                120            N/A            N/A

  10    Waste management (Achaia)                                    35                  35            N/A            N/A

  11    Waste management (Kerkyra)                                   55                  55            N/A            N/A

  12    Waste management (Rhodes)                                    38                  38            N/A            N/A

  13    Sewage system in Rafina, Pikermi, Spata, Artemida            300                300            N/A            2023

  14    Floodplain project in Eschatia                               46                  46           2020            2023

  15    Waste management project in Amari Rethymno                   32                  13           2019            2021

  16    Rainwater drainage in Lachanagora of Thessaloniki            33                  33            N/A            2023

Source: Press, PwC calculations

                                                                                                                      October 2020
 PwC                                                                                                                           43
Waste management projects need about € 1.6bn (2/2)
                                                                                     Remaining
  No      Projects                                            Total Budget (€ mn)                   Start Date   Completion Date
                                                                                    Budget (€ mn)
  17    Floodplain project in Aspropyrgos                            10                  10           2020            2023
  18    Floodplain project of Erasinos torrent (Markopoulo)          19                  10           2020            2023

  19    Floodplain project of Kanapitsa torrent (Menidi)             11                  15           2020            2023

  20    Rainwater drainage in Kalamaria                              12                  12            N/A            N/A
  21    Floodplain project in Loutraki                               22                  22            N/A            N/A
  22    Floodplain project of Rafina torrent                         105                105            N/A            N/A
  23    Floodplain project of Nea Makri torrent                      48                  48            N/A            N/A
        Floodplain project of Agios Georgios torrent
  24                                                                 13                  13            N/A            N/A
        (Markopoulo)
  25    Floodplain projects of motorway concessions                  350                350            N/A            N/A
         Total Budget                                               1,776               1,560

Source: Press, PwC calculations

                                                                                                                      October 2020
 PwC                                                                                                                           44
www.pwc.gr

 At PwC, our purpose is to build trust in society and solve important problems. We’re a
 network of firms in 157 countries with more than 250,000 people who are committed to
 delivering quality in assurance, advisory and tax services. Find out more and tell us
 what matters to you by visiting us at www.pwc.com.

 This publication has been prepared for general guidance on matters of interest only,
 and does not constitute professional advice. You should not act upon the information
 contained in this publication without obtaining specific professional advice. No
 representation or warranty (express or implied) is given as to the accuracy or
 completeness of the information contained in this publication, and, to the extent
 permitted by law, PwC does not accept or assume any liability, responsibility or duty of
 care for any consequences of you or anyone else acting, or refraining to act, in reliance
 on the information contained in this publication or for any decision based on it.

 ©2020.  PricewaterhouseCoopers Business Solutions SA. All rights reserved. PwC refers
 to the Greece member firm, and may sometimes refer to the PwC network. Each member
 firm is a separate legal entity. Please see www.pwc.com/structure for further details.

PwC
You can also read