Quarterly Economic Review - Third quarter 2021
←
→
Page content transcription
If your browser does not render page correctly, please read the page content below
CBUAE Classification: Public

                         Quarterly
                         Economic
                         Review
                         Third quarter 2021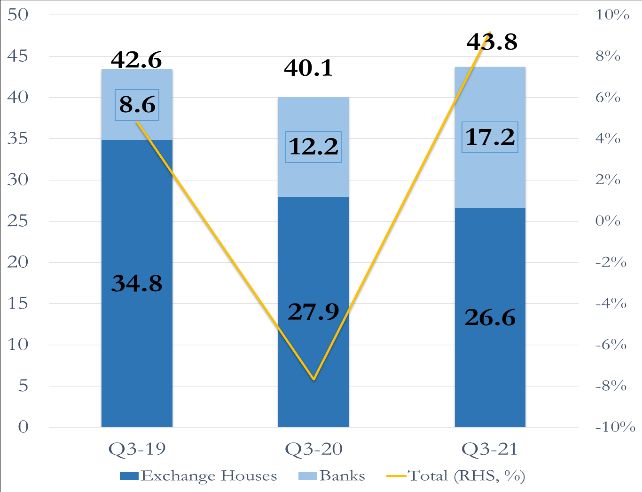
Table of content

Executive Summary..............................................................................................   5

Chapter 1
International Economic Developments.................................................................              6

Chapter 2

Domestic Economic Developments.......................................................................             10

Chapter 3

Banking and Financial Developments.....................................................................           15

Chapter 4

Interest Rates and Money Supply…........................................................................          19

                                                                 2
Figures
Figure 1.2.a. Y-o-Y Average Headline Consumer Inflation in Selected Economies
Figure 1.2.b. Y-o-Y Average Consumer Price Inflation in GCC Countries
Figure 1.3.a. Crude Brent and Natural Gas Prices
Figure 1.4. Policy Rates in Selected Advanced Economies
Figure 2.1.a. UAE PMI
Figure 2.1.b. Average UAE Crude Oil Production
Figure 2.2.a. Average Dubai Residential Unit Sale Prices
Figure 2.2.b. Abu Dhabi Residential Prices
Figure 2.3. Headline, Tradable and Non-Tradable Inflations
Figure 2.4.1. Y-o-Y Nominal and Real Effective Exchange Rates Appreciation/Depreciation
Figure 2.4.2. Outward Personal Remittances Settled Through Banks and Exchange Houses, Q1 2019-2021
Figure 4.1.a. EIBOR Rates in the UAE and LIBOR Rates in Selected Advanced Economies
Figure 4.1.b. Spread of 3-month EIBOR vs. 3-month USD LIBOR
Figure 4.1.c. 10-year Interest Rate Swaps
Figure 4.1.d. Spread 10-year AED Swap vs. USD Swap
Figure 4.2. Q-o-Q Change in Monetary aggregates in 2021 Q3
Tables
Table.1.1.a. Y-o-Y Real GDP Growth Rates in Selected Countries
Table 2.1. Annual Real GDP Growth Rates in the UAE
Table 3.1.1. Total Deposits at UAE Banks
Table 3.1.2.a. Assets and Credit at UAE Banks
Table 3.1.2.b. Bank Lending by Economic Activity
Table 3.1.3. Financial Soundness Indicators
Table 3.2.1. UAE – Securities Markets
Table 3.2.2. UAE – Sovereign Credit Default Swaps (CDS)
Table 4.2.1. Money supply in the UAE
Boxes
Box 1: The surge in US inflation and its impact on policy rates in the US and the UAE
3List of Abbreviations
ADX Abu Dhabi Securities Exchange
AED United Arab Emirates Dirham
BIS Bank for International Settlements
CAR Capital Adequacy Ratio
CBUAE The Central Bank of the UAE
CDs Certificates of Deposit
CET Common Equity Capital
CPI Consumer Price Index
DFM Dubai Financial Market
ECB European Central Bank
EIBOR Emirates Inter-Bank Offer Rate
EMDEs Emerging Markets and Developing Economies
FCSC Federal Competiveness and Statistics Center
Fed The US Federal Reserve
GCC Gulf Cooperation Council
GDP Gross Domestic Product
GREs Government Related Entities
IMF International Monetary Fund
LTD Loan-to-Deposit
LIBOR London Inter-Bank Offer Rate
M1 Monetary Aggregate 1
M2 Monetary Aggregate 2
M3 Monetary Aggregate 3
M-o-M Month-on-Month
MENA Middle East and North Africa
NEER Nominal Effective Exchange Rate
NBFI Non-Banking Financial Institutions
OPEC Organization of Petroleum Exporting Countries
PMI Purchasing Managers’ Index
Q-o-Q Quarter-on-Quarter
REER Real Effective Exchange Rate
SCA Securities and Commodities Authority
TESS Targeted Economic Support Scheme
UAE United Arab Emirates
UK United Kingdome
USA/US United States of America
USD United States Dollar
VAT Value Added Tax
Y-o-Y Year-on-Year
4Executive Summary
Global economic growth momentum was maintained in the third quarter of 2021. The IMF forecasts
5.9% growth for the year, as downward revision for developed economies was offset by upward revision
for Emerging and Developing Economies.
Economic activity in the UAE continued its upward trend in the third quarter. For 2021, CBUAE
maintains real total GDP growth to reach 2.1%, with the real non-hydrocarbon GDP projected to
increase by 3.8%. For 2022, CBUAE forecasts real total GDP to grow at a stronger pace by 4.2% and
non-hydrocarbon real GDP to increase by 3.9%. However, economic projections are susceptible to
uncertainties amidst COVID-19 repercussions. .
Headline CPI inflation rate in the UAE turned positive during the third quarter, for the first time since
Q4 2018, at 0.6% Y-o-Y, as tradable and non-tradable inflation remained at 1.5% and 0.1%,
respectively. Inflation for the year is expected to remain roughly flat. Y-o-Y residential real estate sales
prices in Abu Dhabi rose for a third consecutive quarter, following five years of decline, while declining
in Dubai at a marginal pace. Both, the Dirham effective nominal and real rates depreciated Y-o-Y, due
to lower inflation compared to main trading partners and in line with the USD trend.
Total bank deposits increased on both yearly and quarterly basis. Gross credit contracted on a yearly
basis, but the pace of decrease eased with a moderate growth during the quarter. Overall, the financial
soundness indicators remained adequate during this period, on the back of the gradual recovery of the
economy. CBUAE reaffirmed during the quarter its continued commitment to supporting the economic
recovery through the Targeted Economic Support Scheme and confirmed that withdrawal of the
emergency measures introduced in response to the pandemic will be gradual and appropriately timed.1
Finally, the 3-month USD LIBOR declined during the third quarter of the year. Monetary aggregates
M1 and M3 increased Q-o-Q by 1.4% and 0.8%, respectively, due to an increase in resident deposits,
including government deposits at CBUAE and commercial banks. Meanwhile, M2 declined by 0.2%
Q-o-Q owing to the decline in quasi-monetary deposits.
1CBUAE Press Release (23 September 2021): “CBUAE committed to supporting continued economic recovery and confirms withdrawal of
support measures will be gradual and well-timed” and the press release of 18 December , available on line : -
https://www.centralbank.ae/sites/default/files/2021-
12/CBUAE%20extends%20several%20measures%20of%20the%20Targeted%20Economic%20Support%20Scheme%20to%20facilitate%20p
ost-COVID%20recovery%20of%20the%20UAE%20economy-EN.pdf
5CBUAE Classification: Public
Chapter 1. International Economic Developments
The IMF maintained its yearly growth forecast of the global economy in Q3 2021 at 5.9%, with the
downward revision for advanced economies mostly due to persistent supply disruptions and labour
shortages offset by higher growth in Emerging Market and Developing Economies despite the
pandemic. Meanwhile, inflation has risen rapidly in most economies due to higher energy prices and
continued supply constraints
1.1 Economic Growth EMDEs are estimated to grow by 6.4% in
2021(IMF WEO, October 2021 issue). This
In its October 2021 issue of the World
owes much to growth in large economies like
Economic Outlook (WEO), the IMF projected
China and India.
the global growth for 2021 at 5.9% (5.2%
growth in Advanced Economies and 6.4% China’s Y-o-Y growth, albeit it scaled back
growth in Emerging Market and Developing from the previous quarter amid real estate
Economies (EMDEs)). problems which resurfaced with Ever Grande
Group’s debt crisis, energy shortages and
In the United States, Y-o-Y real GDP growth
ongoing supply chain delays, remained at 4.9%.
fell from 12.2% in Q2 to 4.9% in Q3.
Meanwhile, the Indian government expected
Nonetheless, the healthy positive growth was
growth to reach 10.5% in the current fiscal year
maintained despite supply chain constraints and
(the government's financial year runs from 1
labor shortages. This was largely due to
April 2021 to 31 March 2022), owing mainly to
continued progress on vaccinations and a faster
the reopening of contact intensive activities,
reopening of economic activity, in addition to
and the rebound in construction and exports.
the USD 1.9 trillion fiscal stimulus brought in
by the Biden administration.
Table.1: Y-o-Y Real GDP Growth Rates in
In the Eurozone, Y-o-Y real GDP growth is
Selected Countries (%)
estimated to have grown by 3.7% in Q3 2021,
down from 14.2% in Q2. The slowdown was 2021
2019 2020
due to peaking demand in the 2nd quarter, Q1 Q2 Q3
USA 2.6 -2.3 0.5 12.2 4.9
mostly for consumption purposes in tandem
with persistent supply chain disruptions. UK 1.2 -7.3 -6.1 23.6 6.6
Growth was nonetheless maintained thanks to France 0.9 -4.2 1.5 18.8 3.3
Germany 0.2 -2.3 -3.1 9.8 2.5
positive developments in the labor market and
China 5.8 6.5 18.3 7.9 4.9
an easing of the pandemic related restrictions
Japan -1.4 -1.1 -1.3 7.6 1.4
such as travel requirements and social
India 3.3 0.4 1.6 20.1 8.4
distancing.
Source: National Statistical Authorities
In the UK, Y-o-Y real GDP growth is estimated
to have grown by 6.6% in the third quarter
1.2 Inflation
slowing from a record 23.6% in the previous
quarter, which was due to base effects as output
Headline inflation has risen rapidly in advanced
shrunk in 2020 and Q1 2021. Nonetheless, economies as well as in emerging and
Y-o-Y was maintained in Q3 thanks to further developing economies since the beginning of
easing of the previous restrictions, the 2021, triggered by higher energy prices and
continued fiscal support, and the fast recovery some specific supply-side factors.
in contact intensive sectors.
In the US, Y-o-Y average CPI inflation
accelerated to 5.3% in Q3 20212, as restrictions
2
By October 2021, Y-o-Y US Headline CPI inflation reached
6.2%.
6CBUAE Classification: Public
were relaxed, and demand accelerated in the 1.3 Commodity Prices
face of a slower supply response due to The price of Brent crude firmed up from USD
persistent disruptions and labor shortages. 73.1 per barrel at the end of June 2021 to USD
74.4 per barrel at the end of September 2021,
In the Eurozone, headline Y-o-Y inflation and increased from an average of USD 68.8 per
reached 2.9%, i.e., above the 2% ECB’s target, barrel in Q2 2021 to USD 73.5 per barrel in Q3
mainly due to persistent supply bottlenecks. 2021. Higher prices are mostly a result of
energy supply concerns and continued global
EMDEs were especially affected by supply oil stock drawdowns. In tandem with that,
shortages and imported inflation due to prices increased after the October 4
currency depreciation. announcement by OPEC+ that the group would
keep current production targets unchanged.
Figure 1.2.a: Y-o-Y Average Headline Crude oil inventories in the U.S. decreased
Inflation in Selected Economies (%) because of Hurricane Ida’s impact on crude oil
production in the Gulf of Mexico.
7
6
Natural gas prices increased on average from
5 USD 2.94/MMBtu in Q2 to USD 4.36/MMBtu.
4 The rising prices in recent months reflect U.S.
3 natural gas inventory levels that are below the
2 five-year average and continuing demand for
1
natural gas for power generation.
0
Gold had a muted performance throughout the
-1
US Japan UK Euroarea Germany France India China third quarter, with prices declining slightly
Q1 2020 Q2 2020 Q3 2020 Q4 2020 Q1 2021 Q2 2021 Q3 2021
from an average of USD 1,815 per ounce in Q2
Source: Bloomberg 2021 to USD 1,795 per ounce in Q3 2021,
primarily due to outflows from gold-backed
In the GCC, inflation remained tame in the exchange-traded funds (gold ETFs) driven by a
UAE, Saudi Arabia and Bahrain, while Y-o-Y pick-up in USD real yields.
average CPI inflation increased from 1.8% in
Q2 2021 to 2.9% in Q3 in Qatar, and from 1.5%
to 2.2% in Oman. This rise is due mainly to
faster increase in prices of energy, transport, Figure 1.3: Brent Crude and Natural Gas
and food and beverages. Prices
80 6
Figure 1.2.b: Y-o-Y Average Consumer 70
5
Price Inflation in GCC Countries (%) 60
4
50
40 3
6.0
30
2
20
4.0
1
10
2.0 0 0
Nov-2020
May-2020
Jun-2020
May-2021
Jun-2021
Apr-2020
Jul-2020
Aug-2020
Apr-2021
Jul-2021
Aug-2021
Dec-2020
Sep-2020
Oct-2020
Feb-2021
Mar-2021
Sep-2021
Jan-2021
0.0
-2.0 Crude Brent Price-Dollars per Barrel
Natural Gas Spot Price-Dollars per Metric Million Btu (RHS)
-4.0
UAE KSA BAHRAIN KUWAIT OMAN QATAR
Source: US Energy Information Administration (EIA)
Q1 2020 Q2 2020 Q3 2020 Q4 2020
Q1 2021 Q2 2021 Q3 2021
Source: Bloomberg
7CBUAE Classification: Public
1.4 Monetary policy Monetary Easing (QQE) with Yield Curve
With policy rates in the US, UK and the Control, aiming to achieve its 2% inflation
Eurozone already at or near zero, the monetary target
authorities kept them unchanged in Q3 2021.
Figure 1.4: Policy Rates in Selected
In the US, the Federal Open Market Committee Advanced Economies (%)
(FOMC) announced at its September 2021 1.80
meeting that it will continue to put on hold any 1.60
increase in the Federal Funds Rate and that “it 1.40
would continue to increase its holdings of 1.20
treasury securities by at least USD 80 billion 1.00
per month and of agency mortgage-backed 0.80
securities by at least USD 40 billion per month
0.60
until substantial further progress has been made
0.40
toward its maximum employment and price
0.20
stability goals.”3 Due to the recent surge in
0.00
inflation, nonetheless, Fed officials noted that it
-0.20
could be appropriate to start reducing the pace
Jul-20
Aug-20
Nov-20
Jul-21
Aug-21
Feb-20
Feb-21
Jan-20
Mar-20
Jun-20
Sep-20
Jan-21
Mar-21
Jun-21
Sep-21
Oct-20
Dec-20
May-20
May-21
Apr-20
Apr-21
of asset purchases by the end of this year,
Euro Area US UK
provided that the economic recovery evolves as Japan Australia Korea
anticipated.
Source: BIS
The ECB also left its policy rates at their current
levels (0.00% on refinancing operations, 0.25%
on the marginal lending facility, and -0.50% on
the deposit facility), while it continued to
conduct net asset purchases under the Pandemic
Emergency Purchase Programme (PEPP) with
a total envelope of EUR 1,850 billion and its
purchases under the Asset Purchase Programme
(APP) at a monthly pace of EUR 20 billion. The
program is expected to run for as long as
necessary to reinforce the accommodative
impact of its policy rates, and to end shortly
before it starts raising the key ECB interest
rates.
Bank of England’s Monetary Policy Committee
(MPC) kept its policy rate at 0.1%, during the
third quarter, while maintaining its target stock
of asset purchases at GBP 895 billion (USD 1.2
trillion). The Committee judged that the
existing stance of monetary policy remained
appropriate.
The Bank of Japan expects short- and long-term
policy interest rates to remain at their present or
lower level (-0.1%), and announced that it will
continue Quantitative and Qualitative
3
Press Release available here:
https://www.federalreserve.gov/newsevents/pressreleases/m
onetary20210922a.htm
8CBUAE Classification: Public
Box 1: The surge in US inflation and its impact on policy rates in the
US and the UAE
In recent years, inflation in the US and other about 1.0% in March 2020 to 2.7% in
developed economies remained below the 2% November 20216.
target. However, a surge has been observed in
The expected increase in the Federal Funds
recent months, with the Personal Consumption
Rate would lead to an increase in CBUAE’s
Expenditures Index (PCE), the Fed’s preferred
Base Rate applicable to the Overnight Deposit
gauge, increasing Y-o-Y by 4.4% in September,
Facility (ODF), which provides an effective
and the headline Consumer Price Index (CPI)
interest rate floor for overnight money market
increasing by 5.4% in September and 6.2% in
rates in the UAE. The Central Bank will be
October 2021. The surge was mostly due to
high increase in energy costs and food prices. monitoring economic and financial
developments and the liquidity situation of
For decision–making purposes, the important banks operating in the UAE to support the
question is whether the surge in US inflation is financing needs of the private sector.
temporary or rather lasting, in which case the
CBUAE reaffirmed in Q3 2021 its continued
Fed will be expected to increase its policy rate
commitment to supporting the economic
(the Federal Funds Rate) sooner than
recovery through the Targeted Economic
previously announced.
Support Scheme (TESS) and confirmed that
The FOMC meeting concluded on 3 November withdrawal of emergency measures introduced
that inflation is “largely reflecting factors that in response to the pandemic will be gradual and
are expected to be transitory.”4 This means that appropriately timed. 7
inflation is expected to moderate with the
easing of supply constraints, and therefore it is
expected to decrease to the 2% target or
moderately above it. As a result, the statement
emphasized that it will be appropriate to
maintain the Federal Funds Rate in the current
range of 0-0.25% “until labor market conditions
have reached levels consistent with the
Committee's assessments of maximum
employment and inflation has risen to 2 percent
and is on track to moderately exceed 2 percent
for some time.”5
Given high uncertainties and rising risks of
further increase in prices, however, there were
already signs of increasing inflation
expectations, with the 10-Year Breakeven
Inflation Rate showing an expected annual
inflation for the coming 5 years rising from
4
See Fed’s Press Release dated 3 November 2021, available
online: 7 CBUAE Press Release (23 September 2021): “CBUAE
https://www.federalreserve.gov/newsevents/pressreleases/m committed to supporting continued economic recovery and
onetary20211103a.htm confirms withdrawal of support measures will be gradual and
well-timed” and the press release of 18 December , available
5 on line : -https://www.centralbank.ae/sites/default/files/2021-
See the Fed’s Press Release dated 3 November 2021, supra.
12/CBUAE%20extends%20several%20measures%20of%20the%
20Targeted%20Economic%20Support%20Scheme%20to%20fac
6
See the Federal Reserve Bank of St Louis’ estimates available ilitate%20post-
online: https://fred.stlouisfed.org/series/T10YIE COVID%20recovery%20of%20the%20UAE%20economy-EN.pdf
9CBUAE Classification: Public
Chapter 2: Domestic Economic Developments
Economic activity in the UAE continued its upward trend in the third quarter. Total real GDP growth
in 2021 is projected at 2.1% and at 4.2% for the following year. Headline CPI inflation rate turned
positive during the quarter, for the first time since Q4 2018, thanks to higher energy prices and
strong consumer demand. Inflation is expected to remain roughly flat in 2021. The Dirham
depreciated Y-o-Y in both nominal and real terms.
2.1 Economic Activity and Growth during 2020, owing mostly to the resumption of
international travel.
The non-oil sector continued its upward trend
in Q3 2021, as a result of the pick up in local Figure 2.1.a. UAE PMI (0-100 Index (> 50 =
and global demand, while the country improvement since previous month))
continued to be a leader in containing the
spread of the coronavirus. The UAE kept its top
position globally since the beginning of the
pandemic in the number of tests and in the
distribution of the vaccine per capita, with 83.7
million tests and 20.0 million vaccines rolled
out by the end of September 2021. This
corresponded to over 846 tests performed and
202 vaccines administered per 100 people, with
83% of the population being vaccinated fully Source: IHS Markit
and 94% at least with one doze .
Residential real estate market kept improving, Meanwhile, the Oxford Stringency Index9 went
with prices in Abu Dhabi registering Y-o-Y down from 61 at the end of June 2021 to 42 at
gains for the third consecutive quarter in more the end of September, affirming the relative
than five years, while declining in Dubai at a reopening of the economy compared to its
marginal pace. GCC regional peers with an average of 44. Such
reopening is expected to benefit the UAE, given
Employment and average salary remained its role as a regional trade, transportation and
roughly flat during the quarter, while they were tourism hub, and in light of the start of the
higher than the last pre-crisis month – February EXPO 2020.
2020, as proxied by CBUAE’s Wage Protection
System (WPS) data8. CBUAE weighted these developments in its
assessment and forecasts 3.8% real non-oil
The average UAE PMI increased by 6.6% Y-o- GDP growth for the year 2021.
Y in Q3, moving further up in the expansion
zone to 53.3 in September. The improvement The UAE’s oil production increased by 9.3%
reflects the better sentiment boosted by the Y-o-Y and by 4.3% Q-o-Q, in line with the
wide vaccination program and the Dubai World agreement by OPEC+. Real oil GDP growth
EXPO starting at the end of the quarter. projection has been kept to -2.0% in 2021,
corresponding to an average oil production of
Tourism and hospitality data in Dubai in the 2.72 mb/d for the year as a whole.
first nine months of 2021 showed a recovery in
hotel occupancy to 62%, up from 51% recorded
8 9
Including employees under the Ministry of Human Resources A measure, produced by the University of Oxford, between 0
and Emiratization, Jebel Ali Free Zone Authority and some and 100, indicating the level of closure, due to restrictions,
employed by licensed financial institutions, where the labour aiming to reduce the spread of COVID-19.
related authority is not participating in the WPS.
10CBUAE Classification: Public
Figure 2.1.b. Average UAE Crude Oil employment and better business sentiment, as
Production (in mb/d) Dubai World EXPO will continue to take place
in Q1 2022. Furthermore, being a major
tourism, transit and trade hub in the region, the
UAE is expected to benefit from the removal of
travel restrictions and events such the FIFA
World Cup which is planned to take place in
Qatar in Q4 2022.
Real oil GDP growth projection for 2022 has
not been changed and remains at 5.0%,
reflecting the expected increase in demand with
majority of the world economies being
vaccinated.
Both, non-oil and oil GDP projections for 2022
are subject to upside risks, if global economies,
Source: OPEC
trade and travel reach the full recovery point
faster than expected, while downside risks are
CBUAE projects overall real GDP to grow by
related to uncertainties around new variants and
2.1% during this year10,11, based on the non-
vaccination rates globally.
hydrocarbon economy’s performance and
UAE’s realized oil production in the first 10 Table 2.1. Annual Real GDP Growth Rates
months of the year, OPEC+ announcements in the UAE (%)
and the anticipated output schedule. 2019 2020 2021F 2022F
Overall GDP 3.4 -6.1 2.1 4.2
For 2022, CBUAE kept its projections at 4.2% Non-oil GDP 3.8 -6.2 3.8 3.9
overall real GDP growth, with the non-oil real Oil GDP 2.6 -6.0 -2.0 5.0
GDP expected to increase by 3.9%, owing to
Source: FCSC for 2019 and 2020 and CBUAE
the continued increase in public spending, projections for 2021 and 2022.
positive outlook for credit growth, higher
10
Forecasts subject to revision, due to the high uncertainty growth of the quarterly credit, UAE real estate sales prices, PMI
around COVID-19. and employment. The real oil GDP growth is
11
CBUAE forecasts the real non-oil GDP using univariate model estimated/projected based on hydrocarbon output and
where the quarterly real non-oil GDP Y-o-Y growth is explained considering other value adding activities in the sector. The
by the lagged Y-o-Y growth of the fiscal spending, and the Y-o-Y contribution of the real non-oil GDP is approximately 70% of
the total GDP.
11CBUAE Classification: Public
2.2 Developments in the Residential Real Abu Dhabi Residential Market
Estate Market
According to the REIDIN house price index,
In Q3 2021, residential real estate prices the average price per square meter in the Abu
marked a third quarter of Y-o-Y increase in Dhabi housing market increased for a third
Abu Dhabi, while rising Q-o-Q as well. In consecutive quarter. Average Abu Dhabi
Dubai sales prices Y-o-Y growth almost residential prices registered a growth of 2.2%
flatened, with a significant pick up Q-o-Q. Y-o-Y in Q3 2021, same as in the previous
quarter. 15
Dubai Residential Market
Figure 2.2.b. Abu Dhabi Residential Prices
According to recent data from Dubai Land
Department (DLD),12 residential property Dirhams per SQM
prices in the Emirate declined on average by
0.6% Y-o-Y in Q3 2021, while rents dropped
by 0.5% Y-o-Y. The implied rental yield13,14
moved to 6.8% in Q3 2021, down from 7.2% in
the previous quarter, as a result of decline in
rents and rise in sales prices during the quarter.
Figure 2.2.a. Average Dubai Residential Unit
Sale Prices
Source: REIDIN
Dirhams
The increase in rents by 1.2% Q-o-Q, in parallel
with the rise in sales prices Q-o-Q by 0.9%,
resulted in increasing rental yield to 6.6%,
compared to 6.5% in the second quarter of the
year. However, rents in Abu Dhabi declined in
the third quarter of 2021 by 4.2% Y-o-Y.
Source: DLD
12 sale prices. Annual rent and average Dubai residential unit sale
Data from DLD remain subject to revisions.
13
The rental yield measures the rate of income return over the prices are provided by DLD.
15
cost associated with an investment (the property price). REIDIN Residential Price Index in Abu Dhabi covers 7 areas
14
CBUAE calculates the implied rental yield in Dubai, by and 5 districts.
dividing the annual rent by the average Dubai residential unit
12CBUAE Classification: Public
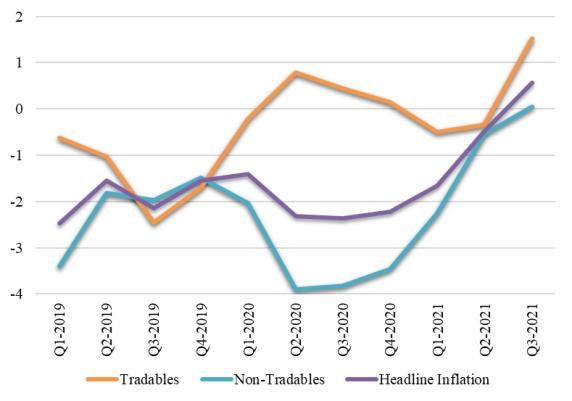
2.3 Inflation The continued drop in the housing component
prices (34% weight in the consumer basket) by
Headline CPI inflation turned positive in the
4.1% Y-o-Y was the main driver of the
third quarter of 2021 for the first time since Q4
moderate inflation of non-tradeables during Q3.
2018, with the headline consumer price index
Prices of all other non-tradeables were
increasing by 0.6% Y-o-Y, compared to a drop
increasing, except for miscellaneous goods and
by 0.5% in the previous quarter. This was the
services where they were falling.
result of a marginal increase by 0.05% in the
price of non-tradables, i.e., goods and services CBUAE projects the average CPI inflation for
that are not traded across borders, therefore 2021 to remain roughly flat, being negative in
their prices are mainly determined by domestic the first nine months of the year at -0.5%, in
supply and demand conditions16. Meanwhile, view of the still recovering real estate market
tradables17 prices rose by 1.5%. and private consumption, and the uncertain
economic environment. CBUAE expects the
Tradables prices, accounting for 34% of the
inflation to be in positive territory in the last
CPI consumption basket, picked up in Q3 due
quarter of 2021.
to the rise in prices in most categories except
food and soft drinks, and miscellaneous goods Figure 2.3. Headline, Tradable and Non-
and services. The spike by more than 6% in oil Tradable Inflation (Y-o-Y, %) in the UAE
prices during the quarter put pressure on the
prices of the transportation category,
registering an inflation of 11.9%, the highest
among the components of the tradeables basket.
Source: FCSC and CBUAE calculations
16 17
As per CBUAE calculations, non-tradables includes the As per CBUAE calculations, tradables include the following
following categories of goods and services: housing; medical categories of goods and services: food and soft drinks;
care; transportation; communications; recreation and culture; beverages and tobacco; textiles, clothing and footwear; furniture
education; restaurants and hotels; and miscellaneous goods and and household goods; transportation; and miscellaneous goods
services. and services.
13CBUAE Classification: Public
2.4 Exchange Rates and Outward Personal 2.4.2 Outward Personal Remittances
Remittances In Q3 2021, outward personal remittances
increased by 9.2% or AED 3.7 billion Y-o-Y.
2.4.1 Exchange Rate
There was a rise of outward remittances
The average Nominal Effective Exchange Rate through banks by AED 5.0 billion or 29.2%,
(NEER) of the Dirham, which takes into while transfers through exchange houses
account the bilateral exchange rates of the dropped by AED 1.3 billion or 5.1%.
UAE’s trading partners, depreciated by 1.5%
Y-o-Y, after a depreciation of 5.4% in the
previous quarter in line with the trends of the Figure 2.4.2. Outward Personal Remittances
USD. Settled Through Banks and Exchange
Houses, Q3 2019-2021
Billions of Dirhams
Figure 2.4.1. Y-o-Y Nominal and Real
Effective Exchange Rates
Appreciation/Depreciation (%)
Source: BIS
Source: CBUAE
In real terms, the Dirham Real Effective
Exchange Rate (REER), which takes into The top five countries for outward personal
account the inflation differential between the remittances during the second quarter were
UAE and its trading partners, depreciated by India, Pakistan, the US, the UK and the
4.0% Y-o-Y in the third quarter, due to the Philippines, accounting for 26.0% and 12.3%,
lower inflation in the UAE during the period respectively for the first two, while the last
compared to the inflation rates prevailing in the three accounted for 6.6% each, of the total.
trading partners.
14CBUAE Classification: Public
Chapter 3. Banking and Financial Developments
Domestic credit contracted Y-o-Y, albeit at a decreasing pace, with a moderate growth in credit during
the quarter. Meanwhile, bank deposits continued to rise; and overall, the financial soundness
indicators remained healthy, positioning the banking system towards further supporting the UAE
economic recovery.
Table 3.1.1. Total Deposits at UAE Banks
3.1 Banking Structure Billions of Dirhams
The number of licensed commercial banks Item Mar-21 Jun-21 Sep-21
remained unchanged at 58 in the third quarter Bank Deposits 1,881 1,909 1,942
of 2021. The total of 58 banks comprises of
(Y-o-Y change %) -0.2% 2.3% 1.8%
21 national banks and 37 foreign banks
(including 10 wholesale banks). Moreover, (Q-o-Q change %) 1.6% 1.5% 1.8%
national bank branches fell by 1 compared Resident Deposits 1,678 1,683 1,699
with the previous quarter to reach 521 at the (Y-o-Y change %) -0.3% 1.0% -1.0%
end of Q3 2021. Meanwhile, the number of (Q-o-Q change %) 2.6% 0.3% 1.0%
banks’ staff fell by 1,138 Y-o-Y (-3.4%) but
Government Sector 277 282 297
rose by 130 Q-o-Q (0.4%) to reach 32,753
(Y-o-Y change %) -3.5% -2.6% -11.0%
employees at the end of September 2021.
(Q-o-Q change %) 8.7% 1.6% 5.5%
3.1.1 Bank Deposits
GREs 246 227 220
Resident deposits (87.5% of total deposits) (Y-o-Y change %) -3.4% -5.5% -10.3%
declined by 1.0% Y-o-Y in the third quarter (Q-o-Q change %) -5.3% -7.7% -3.1%
of 2021, owing mainly to a decline in
Private Sector 1,117 1,134 1,146
government deposits. Private sector deposits
(Y-o-Y change %) 1.5% 3.8% 4.7%
increased by 4.7% Y-o-Y (AED 51 billion),
while non-resident deposits (12.5% of total (Q-o-Q change %) 3.8% 1.5% 1.1%
deposits) increased by 27.1% Y-o-Y (AED NBFI 37 41 36
52 billion). (Y-o-Y change %) -6.3% -8.8% -15.2%
(Q-o-Q change %) -14.4% 8.6% -12.1%
About 77.9% of the deposits at the end of Q3
Non-Resident Deposits 204 226 243
2021 are at conventional banks and the
(Y-o-Y change %) 0.5% 12.6% 27.1%
remaining 22.1% at Islamic banks. Also, the
share of national and foreign banks’ deposits (Q-o-Q change %) -6.1% 10.9% 7.8%
represented 88.2% and 11.8%, respectively. Source: CBUAE
Note: Data as of end of period. September data are preliminary.
Banks’ Assets and Credit
Total assets slightly fell in the third quarter by
0.2% Y-o-Y while gross bank credit decreased
by 1.6% Y-o-Y amid contraction in the
corporate loan portfolio compared to a year ago.
Nonetheless, Q-o-Q credit growth rebounded in
Q3 2021, in particular for domestic private
sector credit. Domestic credit decreased by 0.6%
compared to a year ago driven mainly by a Y-o-
Y reduction in lending to the corporate and
government sectors, while domestic quarterly
credit growth recovered moderately by 0.4%
Q-o-Q.
15CBUAE Classification: Public
Table 3.1.2.a. Assets and Credit at UAE share in gross credit. Meanwhile, total assets of
Banks Islamic banks declined by 3.5% Y-o-Y while
Billions of Dirhams assets of conventional banks increased by 0.6%.
Looking at the type of banks at the end of
Item Mar-21 Jun-21 Sep-21
September 2021 the share of Islamic banks was
Total Assets 3,176 3,209 3,247 18.4% in total assets and 21.7% in total gross
(Y-o-Y change %) -0.4% 0.6% -0.2% financing of the banking system.
(Q-o-Q change %) 1.5% 1.0% 1.2%
Table 3.1.2.b. Domestic Credit by Economic
Gross Credit 1,754 1,769 1,777
Activity
(Y-o-Y change %) -1.4% -1.2% -1.6% Billions of Dirhams
(Q-o-Q change %) -0.8% 0.9% 0.4% Economic Activity Jun-21 Sep-21
Domestic Credit 1,590 1,596 1,602 Total 1,596 1,602
(Q-o-Q change %) 0.4% 0.4%
(Y-o-Y change %) -0.4% -1.9% -0.6%
(Y-o-Y change %) -1.9% -0.6%
(Q-o-Q change %) -0.3% 0.4% 0.4%
Of which:
Government 253 246 245 Mining and Quarrying 15.3 15.2
(Y-o-Y change %) 0.2% -2.7% -4.0% (Q-o-Q change %) 4.2% -0.4%
(Q-o-Q change %) 10.2% -2.7% -0.2% (Y-o-Y change %) 33.4% 19.4%
Manufacturing 75 77
GREs 215 224 223
(Q-o-Q change %) 2.4% 2.7%
(Y-o-Y change %) -2.1% 2.5% 2.3% (Y-o-Y change %) -6.3% 0.2%
(Q-o-Q change %) 7.0% 3.9% -0.4% Electricity, Gas and Water 28.9 28.7
Private Sector 1,106 1,113 1,119 (Q-o-Q change %) 3.2% -0.7%
(Y-o-Y change %) 8.3% 10.3%
(Y-o-Y change %) -0.2% -2.3% -0.2%
Construction and Real Estate 324 328
(Q-o-Q change %) -3.8% 0.6% 0.6%
(Q-o-Q change %) 0.3% 1.2%
NBFI 16 14 15 (Y-o-Y change %) -0.9% 0.3%
(Y-o-Y change %) -2.4% -20.6% -12.0% Trade 137.4 136.5
(Q-o-Q change %) -1.5% -0.7%
(Q-o-Q change %) 1.9% -16.7% 8.9%
(Y-o-Y change %) -12.6% -8.0%
Foreign Credit 165 174 174 Transport, Storage and
83 81
Communication
(Y-o-Y change %) -9.6% 5.9% -9.6%
(Q-o-Q change %) -1.9% -3.1%
(Q-o-Q change %) -4.8% 5.5% 0.3% (Y-o-Y change %) -1.0% 1.9%
Source: CBUAE All Others 932 937
Note: Data as of end of period. September data are
preliminary. (Q-o-Q change %) 0.6% 0.4%
(Y-o-Y change %) -0.9% -0.3%
In lending to domestic economy, the highest Source: CBUAE
increase was in Mining and Quarrying by Note: Data as of end of period. September data are preliminary.
19.4% Y-o-Y (AED 2.5 billion), followed by With regard to bank lending to Micro, Small and
Electricity, Gas and Water by 10.3% Y-o-Y Medium Enterprises (MSMEs), it increased by
(AED 2.7 billion), and by Construction and AED 1.3 billion to reach AED 93.9 billion at the
Real Estate by 0.3% Y-o-Y (AED 1.0 billion). end of the third quarter, 1.4% Y-o-Y higher than
Lending in all other activities declined the level at the end of Q3 2020.
resulting in the total domestic credit falling by
0.6% Y-o-Y.
Total assets of national banks marginally
increased by 0.01% Y-o-Y, while total assets
of foreign banks fell by 1.4%. Foreign banks
had a 12.4% share in total assets and a 9.6%
16CBUAE Classification: Public
3.1.2 Financial Soundness Indicators 3.2 Financial developments
The Advances to Stable Resources Ratio 3.2.1 Share Prices
(ASRR) of the banking system increased from
The Abu Dhabi Securities Exchange (ADX)
77.7% at the end of June 2021 to 77.9% at the
share price index increased by 12.6% Q-o-Q and
end of September 2021, which indicates that
by 70.4% Y-o-Y, while the Dubai Financial
the structural funding of the banking sector
Market (DFM) index rose by 1.2% Q-o-Q and by
remained sound. Eligible Liquid Assets18, as a
25.2% Y-o-Y.
percent of total liabilities19 rose to 18.4%, well
above the 10% minimum regulatory The sharp increase in ADX general share price
requirement, constituting an adequate index and market capitalization was due to
liquidity buffer of the banking system. strong demand, positive market sentiment, and
the ADX One Strategy which aims to boost
Total liquid assets at banks at the end of the
market liquidity and further improve market
third quarter of 2021 stood at AED 485.2
efficiency.
billion, increasing by 8.2% Y-o-Y (AED 36.9
billion higher compared to the end of Table 3.2.1. UAE – Securities Markets
September 2020).
Jun-21 Sep-21
Overall, the UAE banking system remained Q-o-Q 15.6% 12.6%
Share Price Index
well capitalized, with an average Capital Y-o-Y 59.5% 70.4%
Adequacy Ratio (CAR) at 17.7%, Tier 1 AED bn 1169 1381
Capital Ratio at 16.5%, and Common Equity Abu Market
Q-o-Q 35.7% 18.2%
Dhabi Capitalization
Tier 1 Ratio (CET 1) at 14.7%.20 Y-o-Y 136.3% 101.9%
AED bn 30.1 33.4
Table 3.1.3. UAE Financial Soundness Turnover (Traded
Q-o-Q 39.3% 12.6%
Indicators Value)
Y-o-Y 692.4% 320.3%
Mar-21 Jun-21 Sep-21 Q-o-Q 10.2% 1.2%
Share Price Index
Total Banking System Y-o-Y 43.8% 25.2%
Advances to AED bn 388 391
77.5% 77.7% 77.9%
Stable ResourcesRatio Market
Q-o-Q 8.8% 1.0%
(ASRR) Dubai Capitalization
Eligible LiquidAssets 18.8% 18.3% 18.4% Y-o-Y 32.3% 23.4%
Ratio (ELAR)
AED bn 4.7 3.6
Capital Adequacy Ratio 17.9% 17.5% 17.7% Turnover (Traded
(CAR) Q-o-Q 9.9% -22.8%
Value)
Tier 1 Capital Ratio 16.7% 16.3% 16.5% Y-o-Y -25.3% -52.7%
Common Equity Tier 14.7% 14.5% 14.7% Source: SCA
1(CET 1) Ratio
Source: CBUAE
Note: Data as of end of period. September data are
3.2.2 Credit Default Swaps (CDS)
preliminary.
CDS, a type of insurance against default by the
Loans to Deposits (LTD) ratio for the whole debtor, decreased generally worldwide during the
banking system decreased to 91.5% at the end third quarter of 2021 compared to 2020 levels
of the third quarter, slightly below the 92.7% with improving economic conditions. The
at the end of the previous quarter, due to the government of Abu Dhabi CDS premium fell by
higher growth in deposits compared to loans 1.0 basis points (bps) to 41.9 bps, remaining the
during the period. lowest CDS premium in the Middle East and
19Balance sheet total assets less (capital and reserves + all
18
In the ELAR, the eligible liquid assets include
required reserves, mandated by the Central Bank, provisions except staff benefit provisions + refinancing +
certificates of deposits, m-bills held by banks at the subordinated borrowing/deposits).
20
Central Bank, in addition to zero-risk weighted The minimum regulatory requirement for CAR is 13%
government bonds and public sector debt and cash at (10.5% minimum adequacy and 2.5% capital conservation
banks buffer), 8.5% for Tier 1, and 7% for CET 1.
17CBUAE Classification: Public
Africa region, while for the Emirate of Dubai,
the premium decreased by 3.1 bps to 90.4 bps.
Table 3.2.2. UAE – Sovereign Credit
Default Swaps (CDS) (in bps)
2021
Q1 Q2 Q3
Abu Dhabi 44.7 42.9 41.9
Dubai 107.8 93.5 90.4
Source: Bloomberg
Note: All data are quarterly averages
18CBUAE Classification: Public
Chapter 4. Interest Rates and Money Supply
LIBOR rates continued to fall during the third quarter of the year, leading to an increase in the
spread between the EIBOR and the USD LIBOR. Monetary aggregates M1 and M3 increased thanks
to a rise in resident private sector deposits, while M2 declined due to a fall in quasi-monetary deposits.
4.1 Interest rates Figure 4.1.b. Spread of 3-month EIBOR vs.
3-month USD LIBOR (bps)
4.1.a Short-term interest rate
The Fed kept its policy rate in Q3 in the range of
0.00-0.25% and maintained its monthly purchases
at USD 120 billion (USD 80 billion in treasuries
and USD 40 billion in asset-backed securities,
albeit it announced later faster tapering to start in
January 2021.
The 3-month USD LIBOR decreased,
nonetheless, from 0.19% in the last week of Q2
to 0.13% in the last week of Q3.
Source: Bloomberg
Meanwhile, the 3-month EIBOR rose from
Note: Based on weekly data
0.33% to 0.45%, %, owing to a pickup in
demand for credit compared to the previous 4.1.b Long-term swap rates
quarter.
The 10-year swap rate on the Dirham declined
The above developments resulted in the spread from 1.9% in the last week of June to a trough
of 3-month EIBOR vis-à-vis 3-month USD of 1.7% in July before increasing to 2.1% in the
LIBOR increasing from 18.3 bps in the last last week of September, while the spread of the
week of June to 31.8 bps at the last week of 10-year swap rate on the Dirham vs. that on the
September. USD increased from 47.7% bps at the end of Q2
Figure 4.1.a: EIBOR Rates in the UAE and to 58.9 bps at the end of Q3 2021.
LIBOR Rates (%) Figure 4.1.c 10-year Interest Swap Rates (%)
Source: Bloomberg Source: Bloomberg
Note: Based on weekly data Note: Based on weekly data
19CBUAE Classification: Public
Figure 4.1.d Spread 10-year AED Swap vs. On a Y-o-Y basis, M2 increased by 1.2 %, as the
USD Swap (bps) increase in M1 by 17.7% was partially offset by
the drop in quasi-monetary deposits by 9.2%.
M323 grew slightly on a quarterly basis by 0.8%
(AED 14.3 billion) to reach AED 1,786.9
billion, driven by the rise in the government
deposits at commercial banks and CBUAE
(16.8% of M3) by AED 16.9 billion, reaching
AED 301.0 billion, compensating for the drop
in M2.
Source: Bloomberg However, M3 decreased by 1.0% Y-o-Y, as
Note: Based on weekly data government deposits registered a more
significant loss (of 10.7%) than the rise in M2,
during this period.
4.2 Money supply
The monetary aggregate M121 rose by 1.3%
Q-o-Q (AED 9.0 billion) to reach AED 668.5 Figure 4.2: Q-o-Q Change in Monetary
billion, driven by an increase in monetary Aggregates in 2021 Q3
deposits (86.5% of M1) by 2.1% (AED 11.6
billion), reaching AED 575.3 billion, while Billions of Dirhams
currency in circulation (13.9% of M1) declined
by 2.7% (AED 2.6 billion).
M1 rose by 17.7% Y-o-Y due to an increase in
monetary deposits by 22.1%, while currency in
circulation declined by 3.6%.
Table 4.2.1. Money Supply in the UAE
Billions of Dirhams
M1 M2 M3 Source: CBUAE
20-Sep 568.0 1468.7 1805.7
20-Dec 600.0 1478.5 1769.3
21-Jun 659.5 1488.5 1772.6
21-Sep 668.5 1485.9 1786.9
Source: CBUAE
Monetary aggregate M222 decreased by 0.2%
(AED 2.6 billion) Q-o-Q to reach AED 1,485.9
billion, owing to the decline in quasi-monetary
deposits (55.0% of M2) by 1.4% (AED 11.6
billion) to reach AED 817.4 billion. The latter
dropped as term deposits were not attractive for
savers due to the low interest rates.
21 23
Currency in Circulation outside banks + Monetary Deposits M2 + Government Deposits at commercial banks and
22 CBUAE
M1 + Quasi Monetary Deposits
20CBUAE Classification: Public
Head Office
Central Bank of the UAE
King Abdullah Bin Abdul-Aziz Al Saud Street
P. O. Box 854
Abu Dhabi
United Arab Emirates
Dubai Branch Sharjah Branch Ras Al Khaimah Branch
26th Street King Abdul Aziz Street Al Muntasir Road
Bur Dubai Sharjah Industrial Area P. O. Box 5000
P. O. Box 448 P. O. Box 645 Ras Al Khaimah
Dubai Sharjah United Arab Emirates
United Arab Emirates United Arab Emirates
Fujairah Branch Al Ain Branch
Hamid Bin Abdullah Road Ali Bin Abi Talib
P. O. Box 768 Street
Fujairah P. O. Box 1414
United Arab Emirates Al Ain
United Arab Emirates
For further information, contact
Toll Free: 800 CBUAE (800 22823)
Telephone: +9712-6652220
Fax: +9712-6652504
Email: communications@cbuae.gov.ae
P. O. Box: 854
Abu Dhabi, United Arab Emirates
21You can also read