Test-retest repeatability of ultrasonographic shear wave elastography in a rat liver fibrosis model: toward a quantitative biomarker for ...
←
→
Page content transcription
If your browser does not render page correctly, please read the page content below
Test-retest repeatability of ultrasonographic
shear wave elastography in a rat liver
fibrosis model: toward a quantitative
biomarker for preclinical trials
                                                                                                          ORIGINAL ARTICLE
Youngbin Shin1,2, Jimi Huh1,3, Su Jung Ham4, Young Chul Cho4, Yoonseok Choi4,
                                                                                                          https://doi.org/10.14366/usg.19088
Dong-Cheol Woo4, Jeongjin Lee2, Kyung Won Kim1,4                                                          pISSN: 2288-5919 • eISSN: 2288-5943
                                                                                                          Ultrasonography 2021;40:126-135
1
 Department of Radiology and Research Institute of Radiology, Asan Medical Center,
University of Ulsan College of Medicine, Seoul; 2School of Computer Science and
Engineering, Soongsil University, Seoul; 3Department of Radiology, Ajou University Hospital,
Ajou University School of Medicine and Graduate School of Medicine, Suwon; 4Bioimaging
Center, Asan Institute for Life Sciences, Asan Medical Center, Seoul, Korea                               Received: December 16, 2019
                                                                                                          Revised: April 20, 2020
                                                                                                          Accepted: April 23, 2020
                                                                                                          Correspondence to:
                                                                                                          Jimi Huh, MD, PhD, Department of
Purpose: This study evaluated the test-retest repeatability and measurement variability of                Radiology, Ajou University Hospital,
                                                                                                          Ajou University School of Medicine
ultrasonographic shear wave elastography (SWE) for liver stiffness in a rat liver fibrosis model.
                                                                                                          and Graduate School of Medicine, 164
Methods: In 31 Sprague-Dawley rats divided into three groups (high-dose, low-dose, and                    World cup-ro, Yeongtong-gu, Suwon
control), liver fibrosis was induced by intraperitoneal administration of thioacetamide for 8             16499, Korea
                                                                                                          Tel. +82-31-219-4369
weeks. A dedicated radiographer performed SWE to measure liver stiffness in kilopascals
                                                                                                          Fax. +82-31-219-5862
in two sessions at a 3-day interval. We calculated correlations between liver stiffness and               E-mail: jimihuh.rad@gmail.com
histopathologic results, measurement variability in each session using coefficients of variation
(CoVs) and interquartile/median (IQR/M), and test-retest repeatability between both sessions
using the repeatability coefficient.
                                                                                                          This is an Open Access article distributed under the
Results: Different levels of liver fibrosis in each group were successfully induced in the animal         terms of the Creative Commons Attribution Non-
                                                                                                          Commercial License (http://creativecommons.org/
model. The mean liver stiffness values were 8.88±1.48 kPa in the control group, 11.62±1.70                licenses/by-nc/4.0/) which permits unrestricted non-
                                                                                                          commercial use, distribution, and reproduction in
kPa in the low-dose group, and 11.91±1.73 kPa in the high-dose group. The correlation between             any medium, provided the original work is properly
                                                                                                          cited.
collagen areas and liver stiffness values was moderate (r=0.6). In all groups, the second session
yielded lower CoVs (i.e., more reliable results) for liver stiffness than the first session, suggesting   Copyright © 2021 Korean Society of
                                                                                                          Ultrasound in Medicine (KSUM)
a training effect for the operator. The mean IQR/M values were also lower in the second session
than in the first session, which had four outliers (0.21 vs. 0.12, P
Repeatability of elastography for preclinical trials

                          Introduction                                                       Materials and Methods
Liver shear wave elastography (SWE) is a rapidly developing                 Animal Model
ultrasonographic technique that evaluates liver stiffness through           All experiments conducted as part of this study were approved by
shear wave speed measurements in liver tissue of patients with liver        our institutional animal care and use committee. A drug-induced
fibrosis or cirrhosis [1-3]. Liver SWE has been increasingly used as a      chronic liver injury model was adopted to generate liver fibrosis.
quantitative biomarker for evaluating new drugs or treatments, such         All Sprague-Dawley rats (male, 8 weeks old, weighing 270-280 g)
as anti-viral agents and anti-fibrotic agents [4]. In the clinical field,   were obtained from Orient Bio (Seoul, Korea) and maintained under
the physics and manufacturing techniques, measurement variability,          specific-pathogen-free conditions.
quality criteria, and procedures for performing elastography have              Thioacetamide (TAA; Sigma-Aldrich Co., St. Louis, MO, USA),
been extensively investigated, and have now become standardized             which is a hepatotoxic agent that causes centrilobular necrosis,
through the emergence of an international consensus [5-7]. As               was used to model drug-induced liver injury [4]. To minimize any
such, the World Federation for Ultrasound in Medicine and Biology           potential selection bias on the part of the researcher, 34 rats were
(WFUMB) issued guidelines on the use of SWE for the assessment of           randomly assigned to three groups using a computerized random
liver diseases in 2015 and 2018 [8,9].                                      number generator (https://randomizer.org). The assignment resulted
   In preclinical trials, the use of liver elastography has also become     in eight rats in the control group, 11 rats in the low-dose group, and
increasingly common as part of accelerated drug development                 15 rats in the high-dose group.
efforts for anti-fibrotic agents for chronic liver disease and anti-           Intermittent intraperitoneal injections of TAA or saline were
viral agents for chronic hepatitis [4]. Non-invasive monitoring tools       administered 3 times per week for 8 weeks. The doses administered
in mouse or rat models are very useful for assessing the treatment          were 200 mg/kg of TAA in the high-dose group, 150 mg/kg of TAA
response to new drug candidates. In this regard, ultrasonographic           in the low-dose group, and 500 μL of saline in the control group
SWE in preclinical trials might be a very powerful tool, as long as         [18-20]. The TAA dose was determined by a preliminary experiment
its technical feasibility is validated and repeatability is ensured.        (results not shown) using 11 rats administered 0 (n=1), 100 (n=3),
Currently, clinical ultrasonographic machines are readily available for     150 (n=2), 200 (n=3), and 250 mg/kg (n=2) of TAA. A dose of
SWE in a rat liver fibrosis model, thereby facilitating the use of SWE      100 mg/kg did not induce liver fibrosis consistently, and a dose of
in preclinical trials. In contrast, other liver elastographic techniques    250 mg/kg resulted in death of all rats during the TAA medication
such as magnetic resonance elastography (MRE) are very rarely used          period. Based on those results, doses of 150 mg/kg and 200 mg/kg
in preclinical models, because MRE requires a customized animal             were selected for this experiment.
coil and electromechanical driver [10].                                        After 8 weeks of TAA medication, SWE examinations were
   With regard to technical feasibility, several prior studies have         performed in two measurement sessions at a 3-day interval to
investigated SWE techniques in rat liver fibrosis models and                evaluate the test-retest repeatability of the entire process of liver
reported that SWE biomarkers reflected pathologic processes and             stiffness measurements, including animal preparation, anesthesia,
outcomes [11,12]. However, the methods slightly differed across             and SWE examinations.
studies, and a standardized method of performing SWE has not
been established in rat liver models. In addition, only sparse reports      Histopathologic Evaluation as Reference Standards
have been published on the repeatability of SWE in rat models               After the second SWE examination, the animals were euthanized
[13], even though the repeatability of SWE in phantom studies and           in a carbon dioxide chamber. We performed en bloc resection of
clinical studies has been thoroughly established [14-17]. Before            the liver and then sliced it cross-sectionally at 5-mm intervals. The
using SWE as a quantitative biomarker for new drug development or           excised tissues were then fixed in 10% formalin and embedded
for assessing treatment response, the repeatability of measurements         in paraffin blocks. Hematoxylin and eosin (H&E) staining was
must be ensured.                                                            performed for a microscopic evaluation of the liver parenchyma. We
   From this perspective, we performed an animal study to                   requested the Experimental Animal Histopathology Laboratory in
establish a standardized operating procedure (SOP) to perform               our institution to conduct a histopathologic examination of the liver.
ultrasonographic SWE and evaluated the test-retest repeatability of         Liver fibrosis was analyzed based on the presence of portal fibrosis
SWE in a rat liver fibrosis model.                                          (fibrous portal expansion), periportal fibrosis (periportal fibrosis
                                                                            with short septa extending into the lobules or porto-portal septa),
                                                                            septal fibrosis (fibrous septa reaching the adjacent portal tracts and

e-ultrasonography.org                                  Ultrasonography 40(1), January 2021                                                  127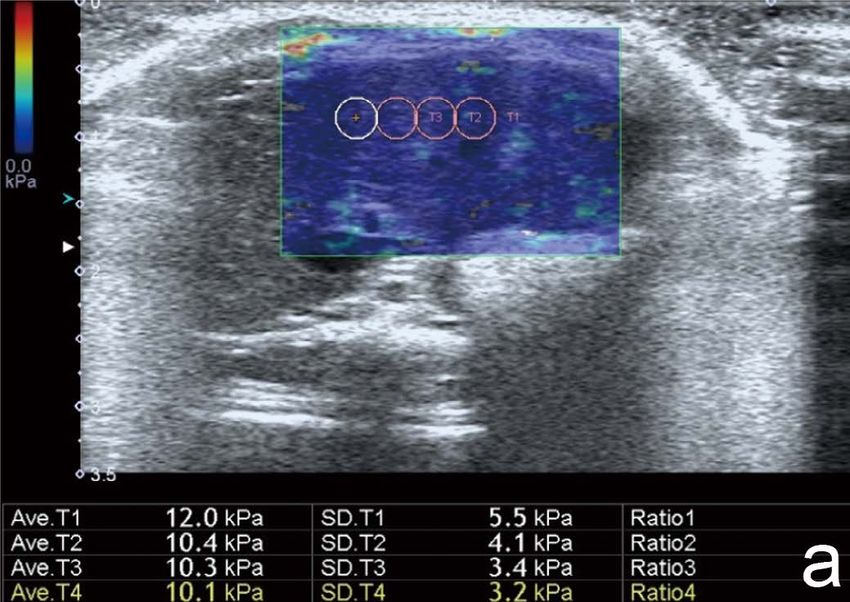
Youngbin Shin, et al.
terminal hepatic venule), or cirrhosis (diffuse nodular formation). During the preliminary experiments, the SOPs were established
Liver inflammation was assessed based on the presence of mainly based on the WFUMB guidelines [8,9], and the operator
inflammatory cells (neutrophils and lymphocytes) in the lobules. Liver received training in the SOPs. The SOPs are presented in detail in
steatosis was evaluated based on the presence of lipid accumulation Supplementary Data 1.
in the hepatocyte vacuoles. The rats were fasted for 4 hours before testing. Under anesthesia
The Masson trichrome stain was performed to evaluate the extent with isoflurane, each rat was positioned in the supine position
of liver fibrosis using a commercially available kit (Sigma-Aldrich with both anterior limbs abducted. After shaving the upper
Korea, Seoul, Korea), which stains collagen blue. The area of collagen abdomen, the transducer was gently applied with a large amount
was quantified with ImageJ software (National Institutes of Health, of sonographic gel warmed to 37ºC to achieve a good acoustic
Bethesda, MD, USA) using the following steps: (1) five representative window, while avoiding stiffness artifacts radiating from the contact
hotspots were determined at a lower magnification (×40), (2) those area, hand motion, and pressure. Measurements were taken
areas were captured and digitized for morphometric analysis, and (3) through a subcostal approach at the location of the best acoustic
areas of collagen were selected using the colorimetric threshold of window of the left hepatic lobe. If possible, the transducer was held
the blue color [21,22]. If ImageJ did not automatically select areas perpendicular to the liver capsule. The operator measured the liver
of collagen, we adjusted the areas manually using the H&E stain stiffness at a depth of approximately 1 cm from the probe surface in
as a reference [23]. The area of collagen as a percentage (area of all animals.
blue pixels/area of selected rectangle) from the five hotspots was In each SWE examination, liver stiffness measurements in
averaged and used for statistical analysis. kilopascals (kPa) were made eight times in the same location by
placing a sampling box (i.e., a field of view), where a color map
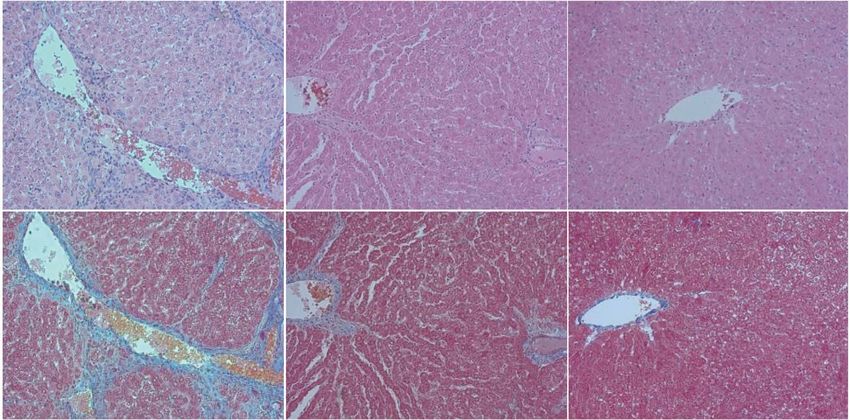
Shear Wave Elastography was displayed. For each measurement, the radiographer drew
Two-dimensional SWE was acquired with an Aplio 500 Platinum several (generally three or four) regions of interest (ROIs) with a
ultrasound machine (Canon Medical Systems Corp., Tokyo, Japan) diameter of 0.3 cm away from the large vessel and bile duct. Then,
using a linear probe (14L5 transducer, 5.0-14.0 MHz). SWE was the radiographer and supervising radiologist chose an ROI that was
performed by a single operator (Y.C.C.), a radiographer with 2 years placed in the area of greatest shear wave uniformity, demonstrating
of experience in SWE, TE, and liver Doppler ultrasonography in our a relatively homogeneous color on the liver stiffness map and
clinical unit and 3 years of experience in animal ultrasonographic speed map (Fig. 1). Of the eight measurement values, we selected
imaging at our animal imaging center. A supervising radiologist the median value from each SWE examination as the liver stiffness
(J.H.) with 2 years of experience in SWE and 10 years of experience value.
in abdominal ultrasonography checked the measurement process. During measurements of liver stiffness, we did not consider the
Ave.T1 12.0 kPa SD.T1 5.5 kPa Ratio1 Ave.T1 1.96 m/s SD.T1 0.42 m/s Ratio1
Ave.T2 10.4 kPa SD.T2 4.1 kPa Ratio2 Ave.T2 1.84 m/s SD.T2 0.33 m/s Ratio2
Ave.T3 10.3 kPa SD.T3 3.4 kPa Ratio3 Ave.T3 1.84 m/s SD.T3 0.30 m/s Ratio3
Ave.T4 10.1 kPa SD.T4 3.2 kPa Ratio4 Ave.T4 1.83 m/s SD.T4 0.26 m/s Ratio4
A B
Fig. 1. Measurement of shear wave elastography.
Regions of interest were positioned in an area of homogeneous color on an elasticity map (A) and a speed map (B). A. Liver stiffness map
shows the distribution of stiffness (kPa) in the liver. B. Speed map shows the distribution of shear wave velocities in the liver.
128 Ultrasonography 40(1), January 2021 e-ultrasonography.org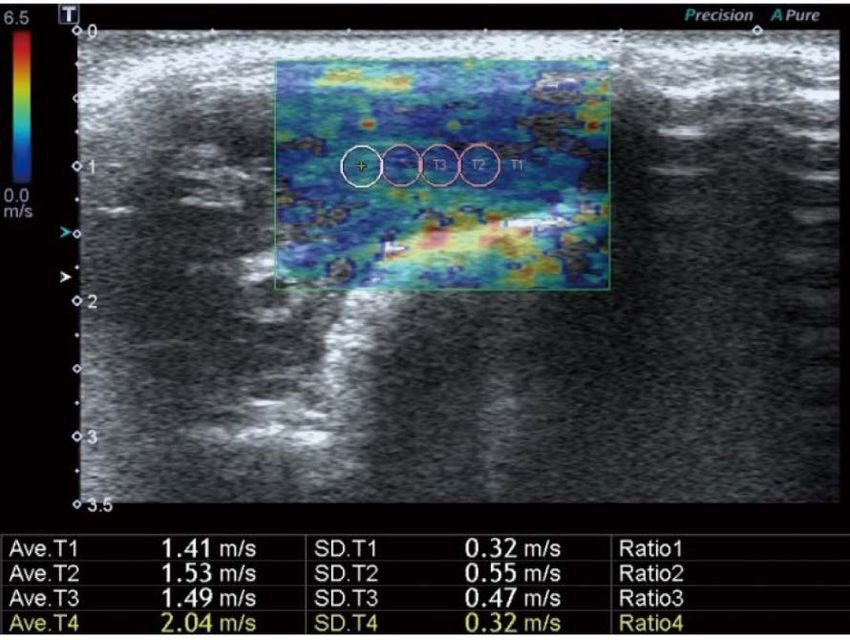
Repeatability of elastography for preclinical trials

interquartile/median (IQR/M) value as a quality check criterion. After     or toxic death were not seen in any of the surviving rats.
finishing our experiment, we manually calculated the IQR/M values             All rats in the control group showed normal histologic
of the eight measurements in each SWE examination.                         findings without fibrosis, inflammation, or steatosis. Based on
                                                                           the histopathologic results, liver fibrosis with abundant collagen
Statistical Analysis                                                       deposits was successfully induced in all rats in both the low-
The mean values and standard deviation (SD) were determined                dose and high-dose groups (Fig. 2A). The areas of collagen were
for all SWE examinations for each group in each measurement                most extensive in the liver histopathologic specimens of the high-
session. Repeated-measures analysis of variance (RMANOVA) was              dose group (24.86%±4.55%), followed by the low-dose group
used to compare the mean values of liver stiffness (kPa) between           (16.01%±3.25%) and the control group (6.27%±2.10%), as
measurement sessions and across groups. Other quantitative values          presented in Fig. 2B. Post-hoc multiple comparison analysis revealed
were compared using the Student t-test, Fisher exact test, or one-         that all pairs were significantly different (P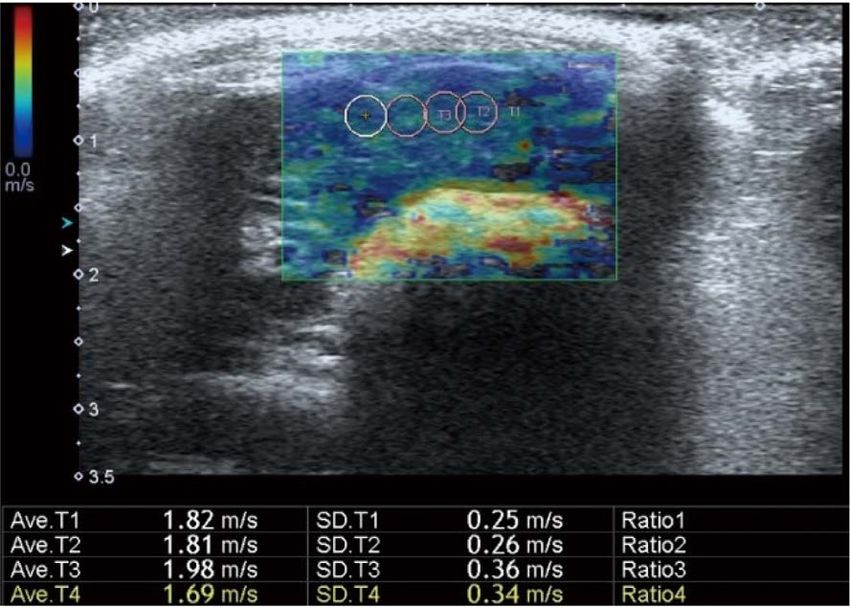
Youngbin Shin, et al.

                                 High-dose group                       Low-dose group                                    Control

  H&E

  MT

  A

                    35

                    30

                    25
Collagen area (%)

                    20

                    15
                                                                              Fig. 2. Histopathology of the liver parenchyma.
                    10                                                        A. In hematoxylin and eosin (H&E) stain (×200), liver inflammation is
                                                                              assessed based on the presence of inflammation cells in the hepatic
                     5                                                        lobules. In Masson's trichrome (MT) stain (×200), liver fibrosis is
                                                                              analyzed based on the presence of collagen deposition with blue
                     0                                                        color. B. The graph shows the collagen area was the highest in the
                         High dose (n=14) Low dose (n=9)   Control (n=8)
                                                                              high-dose group, followed by low-dose group and control group.
                                             Group                            *P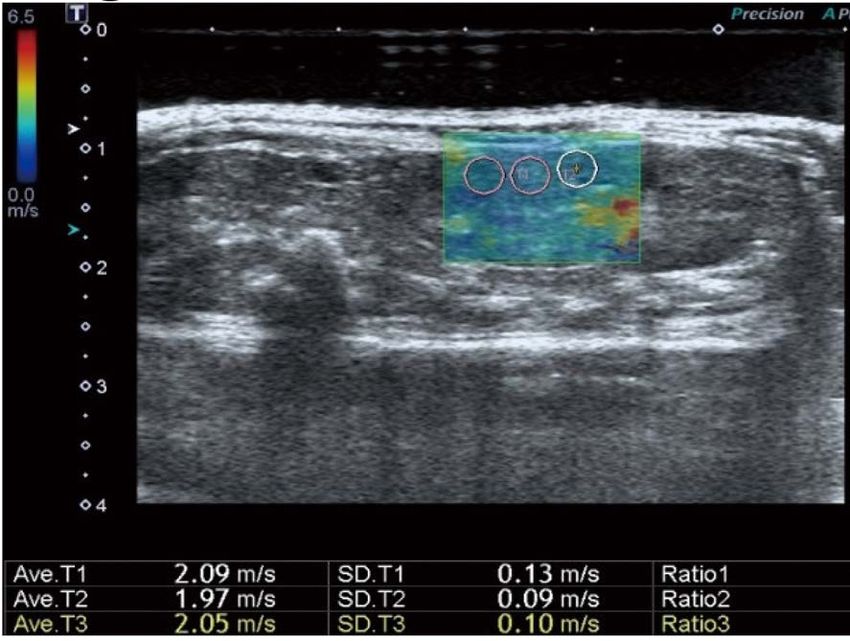
Repeatability of elastography for preclinical trials

    Table 1. Liver stiffness measurements and variability between sessions
                                                                           First session                       Second session                             P-value
            Liver stiffness values in each group, mean±SD (kPa)
                    Control group (n=8)                                     9.03±2.02                              8.72±0.75                                0.690a)
                    Low-dose group (n=9)                                   11.97±2.03                            11.26±1.32                                 0.392a)
                    High-dose group (n=14)                                 12.24±2.17                            11.58±1.12                                 0.321a)
            CoV of liver stiffness values in each group
                    Control group (n=8)                                         0.22                                  0.08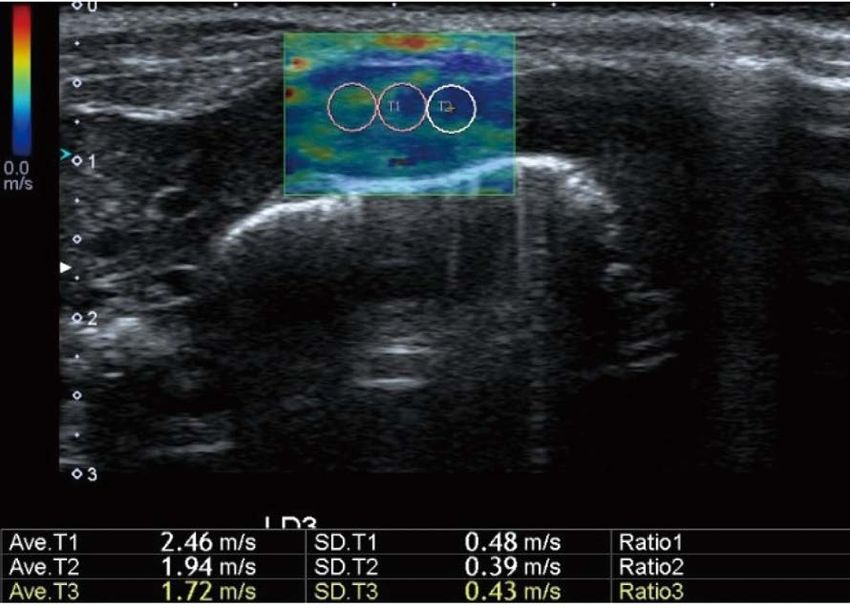
Youngbin Shin, et al.

                        18                                                           Group
                                                                                     Control
                                                                                     Low-dose
                        16                                                           High-dose

                        14
Liver stiffness (kPa)

                        12

                                                                                                       Fig. 4. Liver stiffness of each measurement session.
                        10                                                                             A. Box and whiskers plots show liver stiffness
                                                                                                       measured in the first and second sessions. The
                                                                                                       interquartile ranges were higher in the first session
                        8                                                                              than in the second session in all groups. The outliers in
                                                                                                       the first measurement session are presented as round
                                                                                                       dots. *P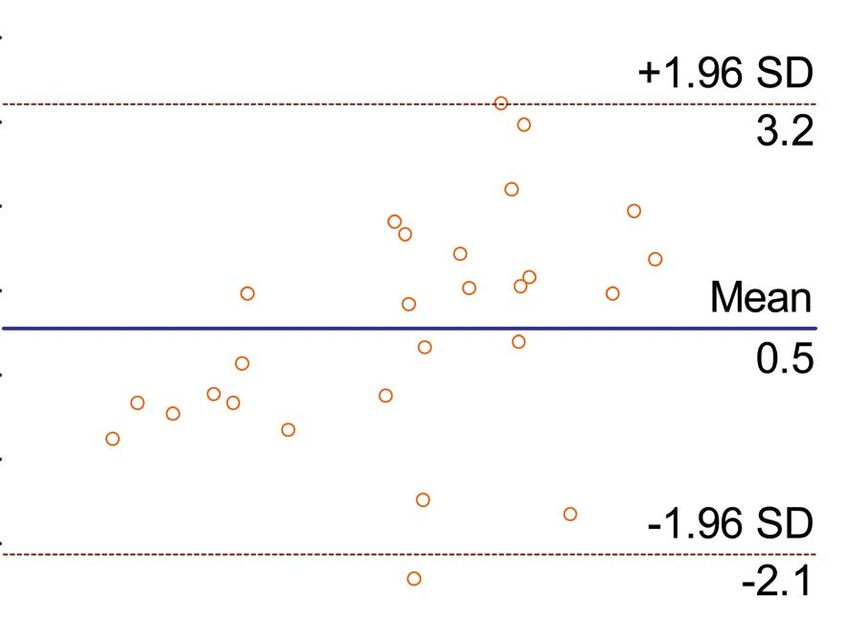
Repeatability of elastography for preclinical trials

                                        4                                                          measurement process, including animal preparation, anesthesia, and
Difference between 1st and 2nd (kPa)

                                                                                    +1.96 SD       SWE examination. If we had evaluated same-day repeatability while
                                        3                                                  3.2     maintaining anesthesia, we could not have evaluated the impact
                                        2                                                          of animal preparation and anesthesia. Third, the severity of liver
                                                                                                   fibrosis may change during a 3-day period. However, we believe that
                                        1                                               Mean       such changes were likely very minimal, because we discontinued
                                                                                           0.5     administration of TAA during the 3-day interval. In addition, we
                                        0
                                                                                                   believe that a 3-day interval is appropriate to minimize futile
                                       -1                                                          animal loss. In studies where experiments are conducted at 1-day
                                                                                    -1.96 SD       or 2-day intervals, the rats might be distressed due to repeated
                                       -2
                                                                                         -2.1      anesthesia in such a short time. Lastly, our study only evaluated
                                       -3                                                          intra-reader variability with an experienced radiographer. However,
                                            6         8        10       12        14          16   we have provided data on inter-reader variability obtained from our
                                                Mean value of 1st and 2nd measurement (kPa)        preliminary experiment in Supplementary Data 2.
     Fig. 5. Bland-Altman plot to evaluate the repeatability of liver                                 In conclusion, in a preclinical trial with an animal liver fibrosis
     stiffness measurements. SD, standard deviation.                                               model, the feasibility of using ultrasonographic SWE to evaluate
                                                                                                   histopathologic liver fibrosis in a non-invasive and repeatable
     measurement session to minimize intra-operator variability.                                   manner was confirmed. The operator’s experience and training
        In our experiment, the areas of collagen observed in                                       in how to adhere to the SOPs might contribute to reducing the
     histopathologic examinations were significantly different between                             variability of liver stiffness measurements on SWE.
     the high-dose group (24.86%±4.55%) and the low-dose group
     (16.01%±3.25%), whereas liver stiffness measurements were not                                 ORCID: Youngbin Shin: https://orcid.org/0000-0003-2753-9586; Jimi Huh: https://
                                                                                                   orcid.org/0000-0002-8832-6165; Su Jung Ham: https://orcid.org/0000-0003-1455-
     significantly different between the high-dose group and low-dose
                                                                                                   9262; Young Chul Cho: https://orcid.org/0000-0001-5469-5467; Yoonseok Choi:
     group. We postulate that quantitative histologic measurements                                 https://orcid.org/0000-0001-9291-1714; Dong-Cheol Woo: https://orcid.org/0000-
     of collagen area might be more sensitive than SWE as a way                                    0001-8202-015X; Jeongjin Lee: https://orcid.org/0000-0002-4151-6922; Kyung Won
     to quantify liver fibrosis. The histologic measurements used five                             Kim: https://orcid.org/0000-0002-1532-5970
     representative hotspots with substantial areas of Masson trichrome
     staining, whereas SWE measurements were made in areas with                                    Author Contributions
     shear wave uniformity. Discrepancies between histologically                                   Conceptualization: Huh J, Kim KW. Data acquisition: Ham SJ, Cho
     observed liver fibrosis and liver stiffness measurements have                                 YC, Choi Y. Data analysis or interpretation: Shin Y, Woo DC, Lee J.
     been also reported in prior research. Georges et al. [33] reported                            Drafting of the manuscript: Shin Y, Huh J, Kim KW. Critical revision of
     that the liver stiffness increased marginally in the late treatment                           the manuscript: Choi Y, Woo DC, Lee J. Approval of the final version
     period starting on the 11th day after the start of fibrosis-inducing                          of the manuscript: all authors.
     treatment, while the amount of liver fibrosis grew substantially.
     Indeed, the degree of correlation between areas of collagen and                               Conflict of Interest
     liver stiffness on SWE was moderate (r=0.6) in our study, similarly to                        No potential conflict of interest relevant to this article was reported.
     prior animal studies [34,35]. Wang et al. [34] reported a correlation
     of r2=0.43 (equivalent to r=0.65) and attributed the discrepancies                            Acknowledgments
     to differences in the liver locations where the histologic analysis and                       This study was supported by a grant from the National Research
     SWE were performed.                                                                           Foundation of Korea (2019R1I1A1A01060744). We thank the
        There are several limitations in our study. First, we did not measure                      Experimental Animal Histopathology Laboratory core facility
     long-term repeatability, because the liver fibrosis may change in the                         (pathologist: Dr. Woo Chan Son) at Asan Medical Center for assisting
     long term. Second, our test-retest repeatability results at a 3-day                           with the histopathologic analysis.
     interval might be underestimated compared to those of same-day
     repeatability. The reason why we chose a 3-day interval between the                           Supplementary Material
     two measurement sessions was that we aimed to include the entire                              Supplementary Data 1. Standard operating procedure (English-

     e-ultrasonography.org                                                      Ultrasonography 40(1), January 2021                                                        133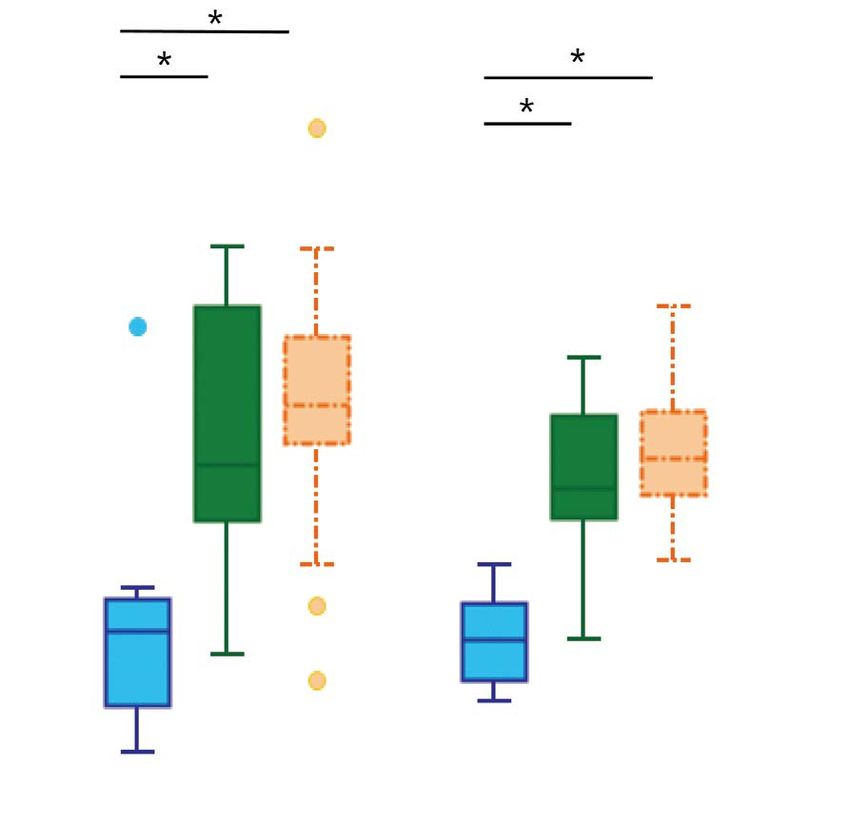
Youngbin Shin, et al.

translated version) (https://doi.org/10.14366/usg.19088).                           et al. Viscoelasticity measurement in rat livers using shear-wave US
                                                                                    elastography. Ultrasound Med Biol 2018;44:2018-2024.
Supplementary Data 2. Shear wave elastography (SWE) results of                13.   Li J, Liu H, Zhang C, Yang S, Wang Y, Chen W, et al. Native T1
the preliminary study (https://doi.org/10.14366/usg.19088).                         mapping compared to ultrasound elastography for staging
                                                                                    and monitoring liver fibrosis: an animal study of repeatability,
                                                                                    reproducibility, and accuracy. Eur Radiol 2020;30:337-345.
                            References                                        14.   Hollerieth K, Gassmann B, Wagenpfeil S, Kemmner S, Heemann
                                                                                    U, Stock KF. Does standoff material affect acoustic radiation
 1. Sugimoto K, Moriyasu F, Oshiro H, Takeuchi H, Yoshimasu Y, Kasai Y,             force impulse elastography? A preclinical study of a modified
    et al. Clinical utilization of shear wave dispersion imaging in diffuse         elastography phantom. Ultrasonography 2018;37:140-148.
    liver disease. Ultrasonography 2020;39:3-10.                              15.   Yoo J, Lee JM, Joo I, Lee DH, Yoon JH, Kang HJ, et al. Reproducibility
 2. Hong EK, Choi YH, Cheon JE, Kim WS, Kim IO, Kang SY. Accurate                   of ultrasound attenuation imaging for the noninvasive evaluation
    measurements of liver stiffness using shear wave elastography                   of hepatic steatosis. Ultrasonography 2020;39:121-129.
    in children and young adults and the role of the stability index.         16.   Yoo J, Lee JM, Joo I, Yoon JH. Assessment of liver fibrosis using
    Ultrasonography 2018;37:226-232.                                                2-dimensional shear wave elastography: a prospective study of
 3. Jeong WK, Lim HK, Lee HK, Jo JM, Kim Y. Principles and clinical                 intra- and inter-observer repeatability and comparison with point
    application of ultrasound elastography for diffuse liver disease.               shear wave elastography. Ultrasonography 2020;39:52-59.
    Ultrasonography 2014;33:149-160.                                          17.   Ryu H, Ahn SJ, Yoon JH, Lee JM. Inter-platform reproducibility
 4. Chen YW, Tsai MY, Pan HB, Tseng HH, Hung YT, Chou CP.                           of liver stiffness measured with two different point shear
    Gadoxetic acid-enhanced MRI and sonoelastography: non-invasive                  wave elastography techniques and 2-dimensional shear wave
    assessments of chemoprevention of liver fibrosis in thioacetamide-              elastography using the comb-push technique. Ultrasonography
    induced rats with Sho-Saiko-To. PLoS One 2014;9:e114756.                        2019;38:345-354.
 5. You MW, Kim KW, Pyo J, Huh J, Kim HJ, Lee SJ, et al. A meta-              18.   Park SY, Shin HW, Lee KB, Lee MJ, Jang JJ. Differential
    analysis for the diagnostic performance of transient elastography               expression of matrix metalloproteinases and tissue inhibitors of
    for clinically significant portal hypertension. Ultrasound Med Biol             metalloproteinases in thioacetamide-induced chronic liver injury. J
    2017;43:59-68.                                                                  Korean Med Sci 2010;25:570-576.
 6. Kim DW, Suh CH, Kim KW, Pyo J, Park C, Jung SC. Technical                 19.   Kim YO, Popov Y, Schuppan D. Optimized mouse models for liver
    performance of two-dimensional shear wave elastography for                      fibrosis. Methods Mol Biol 2017;1559:279-296.
    measuring liver stiffness: a systematic review and meta-analysis.         20.   Liedtke C, Luedde T, Sauerbruch T, Scholten D, Streetz K, Tacke F, et
    Korean J Radiol 2019;20:880-893.                                                al. Experimental liver fibrosis research: update on animal models,
 7. Suh CH, Kim KW, Park SH, Lee SS, Kim HS, Tirumani SH, et al.                    legal issues and translational aspects. Fibrogenesis Tissue Repair
    Shear wave elastography as a quantitative biomarker of clinically               2013;6:19.
    significant portal hypertension: a systematic review and meta-            21.   Collins TJ. ImageJ for microscopy. Biotechniques 2007;43(1
    analysis. AJR Am J Roentgenol 2018;210:W185-W195.                               Suppl):25-30.
 8. Ferraioli G, Filice C, Castera L, Choi BI, Sporea I, Wilson SR, et        22.   Chen P, Kakan X, Wang S, Dong W, Jia A, Cai C, et al. Deletion of
    al. WFUMB guidelines and recommendations for clinical use                       clock gene Per2 exacerbates cholestatic liver injury and fibrosis in
    of ultrasound elastography: Part 3: liver. Ultrasound Med Biol                  mice. Exp Toxicol Pathol 2013;65:427-432.
    2015;41:1161-1179.                                                        23.   Ham SJ, Choi Y, Lee SI, Kim J, Kim YI, Chung JW, et al. Enhanced
 9. Ferraioli G, Wong VW, Castera L, Berzigotti A, Sporea I, Dietrich               efficacy of radiofrequency ablation for hepatocellular carcinoma
    CF, et al. Liver ultrasound elastography: an update to the World                using a novel vascular disrupting agent, CKD-516. Hepatol Int
    Federation for Ultrasound in Medicine and Biology guidelines and                2017;11:446-451.
    recommendations. Ultrasound Med Biol 2018;44:2419-2440.                   24.   Lim S, Kim SH, Kim Y, Cho YS, Kim TY, Jeong WK, et al. Coefficient
10. Bayly PV, Garbow JR. Pre-clinical MR elastography: principles,                  of variance as quality criterion for evaluation of advanced hepatic
    techniques, and applications. J Magn Reson 2018;291:73-83.                      dibrosis using 2D shear-wave elastography. J Ultrasound Med
11. Huh J, Ham SJ, Cho YC, Park B, Kim B, Woo CW, et al. Gadoxetate-                2018;37:355-362.
    enhanced dynamic contrast-enhanced MRI for evaluation of liver            25.   Park JE, Han K, Sung YS, Chung MS, Koo HJ, Yoon HM, et al.
    function and liver fibrosis in preclinical trials. BMC Med Imaging              Selection and reporting of statistical methods to assess reliability of
    2019;19:89.                                                                     a diagnostic test: conformity to recommended methods in a peer-
12. Sugimoto K, Moriyasu F, Oshiro H, Takeuchi H, Yoshimasu Y, Kasai Y,             reviewed journal. Korean J Radiol 2017;18:888-897.

134                                                     Ultrasonography 40(1), January 2021                                      e-ultrasonography.org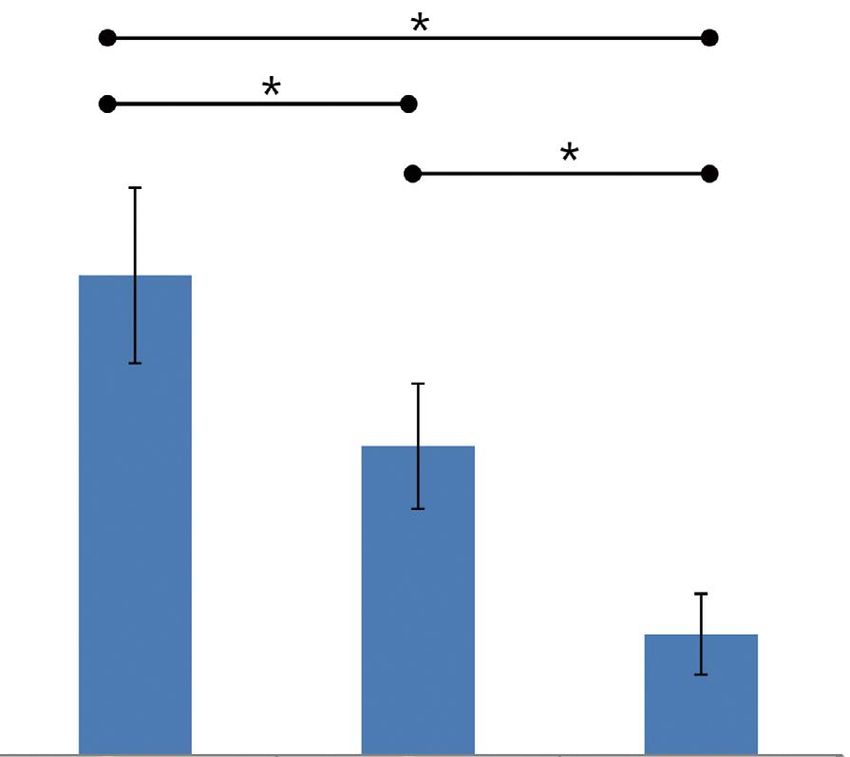
Repeatability of elastography for preclinical trials

26. Barnhart HX, Barboriak DP. Applications of the repeatability of            liver disease. Scand J Gastroenterol 2011;46:1458-1467.
    quantitative imaging biomarkers: a review of statistical analysis of   31. Nadebaum DP, Nicoll AJ, Sood S, Gorelik A, Gibson RN. Variability
    repeat data sets. Transl Oncol 2009;2:231-235.                             of liver shear wave measurements using a new ultrasound
27. Kessler LG, Barnhart HX, Buckler AJ, Choudhury KR, Kondratovich            elastographic technique. J Ultrasound Med 2018;37:647-656.
    MV, Toledano A, et al. The emerging science of quantitative imaging    32. Maruyama H, Kobayashi K, Kiyono S, Sekimoto T, Kanda T, Yokosuka
    biomarkers terminology and definitions for scientific studies and          O. Two-dimensional shear wave elastography with propagation-
    regulatory submissions. Stat Methods Med Res 2015;24:9-26.                 based reliability assessment for grading hepatic fibrosis and portal
28. Krajewski KM, Nishino M, Franchetti Y, Ramaiya NH, Van den                 hypertension. J Hepatobiliary Pancreat Sci 2016;23:595-602.
    Abbeele AD, Choueiri TK. Intraobserver and interobserver variability   33. Georges PC, Hui JJ, Gombos Z, McCormick ME, Wang AY, Uemura M,
    in computed tomography size and attenuation measurements                   et al. Increased stiffness of the rat liver precedes matrix deposition:
    in patients with renal cell carcinoma receiving antiangiogenic             implications for fibrosis. Am J Physiol Gastrointest Liver Physiol
    therapy: implications for alternative response criteria. Cancer            2007;293:G1147-G1154.
    2014;120:711-721.                                                      34. Wang MH, Palmeri ML, Guy CD, Yang L, Hedlund LW, Diehl AM,
29. Park SH, Kim SY, Suh CH, Lee SS, Kim KW, Lee SJ, et al. What we            et al. In vivo quantification of liver stiffness in a rat model of
    need to know when performing and interpreting US elastography.             hepatic fibrosis with acoustic radiation force. Ultrasound Med Biol
    Clin Mol Hepatol 2016;22:406-414.                                          2009;35:1709-1721.
30. Karlas T, Pfrepper C, Wiegand J, Wittekind C, Neuschulz M, Mossner     35. Chen X, Shen Y, Zheng Y, Lin H, Guo Y, Zhu Y, et al. Quantification of
    J, et al. Acoustic radiation force impulse imaging (ARFI) for non-         liver viscoelasticity with acoustic radiation force: a study of hepatic
    invasive detection of liver fibrosis: examination standards and            fibrosis in a rat model. Ultrasound Med Biol 2013;39:2091-2102.
    evaluation of interlobe differences in healthy subjects and chronic

e-ultrasonography.org                                  Ultrasonography 40(1), January 2021                                                     135
You can also read