Quantitative evaluation and comparison of coronary artery characteristics by 3D coronary volume reconstruction - Nature
←
→
Page content transcription
If your browser does not render page correctly, please read the page content below
www.nature.com/scientificreports
OPEN Quantitative evaluation
and comparison of coronary artery
characteristics by 3D coronary
volume reconstruction
Yongcheol Kim1,2, Jonathan James Hyett Bray3, Benjamin Waterhouse2, Alexander Gall2,
Georgia May Connolly2,3, Eva Sammut2,3, Vito Domenico Bruno4, Robert Tulloh2,3,
David Adlam5 & Thomas W. Johnson2*
Non-atherosclerotic abnormalities of vessel calibre, aneurysm and ectasia, are challenging to quantify
and are often overlooked in qualitative reporting. Utilising a novel 3-dimensional (3D) quantitative
coronary angiography (QCA) application, we have evaluated the characteristics of normal, diabetic
and aneurysmal or ectatic coronary arteries. We selected 131 individuals under 50 years-of-age, who
had undergone coronary angiography for suspected myocardial ischaemia between 1st January 2011
and 31st December 2015, at the Bristol Heart Institute, Bristol, UK. This included 42 patients with
angiographically normal coronary arteries, 36 diabetic patients with unobstructed coronaries, and 53
patients with abnormal coronary dilatation (aneurysm and ectasia). A total of 1105 coronary segments
were analysed using QAngio XA 3D (Research Edition, Medis medical imaging systems, Leiden, The
Netherlands). The combined volume of the major coronary arteries was significantly different between
each group (1240 ± 476 mm3 diabetic group, 1646 ± 391 mm3 normal group, and 2072 ± 687 mm3
abnormal group). Moreover, the combined coronary artery volumes correlated with patient body
surface area (r = 0.483, p < 0.01). Inter-observer variability was assessed and intraclass correlation
coefficient of the total coronary artery volume demonstrated a low variability of 3D QCA (r = 0.996,
p < 0.001). Dedicated 3D QCA facilitates reproducible coronary artery volume estimation and allows
discrimination of normal and diseased vessels.
Aneurysmal vascular disease was first reported post-mortem over 200 years a go1 and coronary ectasia was first
described in 19662. Qualitative coronary artery dilatation is evident in up to 10% of all diagnostic coronary
angiograms3. However, defining true aneurysm and ectasia is challenging with a lack of clearly quantifiable and
reproducible cut-offs. An aneurysm is simple to define when discrete, arising in mid-vessel, and bordered by
normal calibre proximal and distal segments. However, aneurysms frequently associate with atheromatous or dif-
fusely ectatic segments and consequently defining the abnormalities is more challenging. The difficulties in effec-
tive quantification are reinforced by the myriad definitions for aneurysm and ectasia found within the l iterature4.
We have previously expressed a major concern regarding the accuracy of reporting and recognition of aneu-
rysm/ectasia in adult coronary angiographic a ssessment3. In considering strategies to improve diagnosis it was
noted that paediatric cardiologists have developed a robust method for coronary artery calibre measurement,
however, paediatric and adult coronary assessments pose different challenges. In paediatric cardiology, an
echocardiography-based assessment of coronary dimensions is commonly used. This assessment, usually based
on visual internal diameter provides a z-score (the number of standard deviations away from the mean for a
population of the same body surface area, age and sex) and is used to guide further m anagement5. Assessment
for aneurysm and ectasia in adult coronary arteries is not possible by echocardiography and is complicated by
the potential for concomitant development of stenotic atherosclerotic disease.
1
Division of Cardiology, Department of Internal Medicine, Yonsei University College of Medicine and Cardiovascular
Center, Yongin Severance Hospital, Yongin, Republic of Korea. 2Bristol Heart Institute, University Hospitals Bristol
NHS Foundation Trust, Upper Maudlin Street, Bristol BS2 8HW, UK. 3University of Bristol, Bristol, UK. 4University
of Bristol Medical School – Translational Health Science, Bristol, UK. 5Department of Cardiovascular Sciences,
NIHR Leicester Biomedical Research Centre, Leicester, UK. *email: Tom.Johnson@uhbristol.nhs.uk
Scientific Reports | (2021) 11:1170 | https://doi.org/10.1038/s41598-020-80928-4 1
Vol.:(0123456789)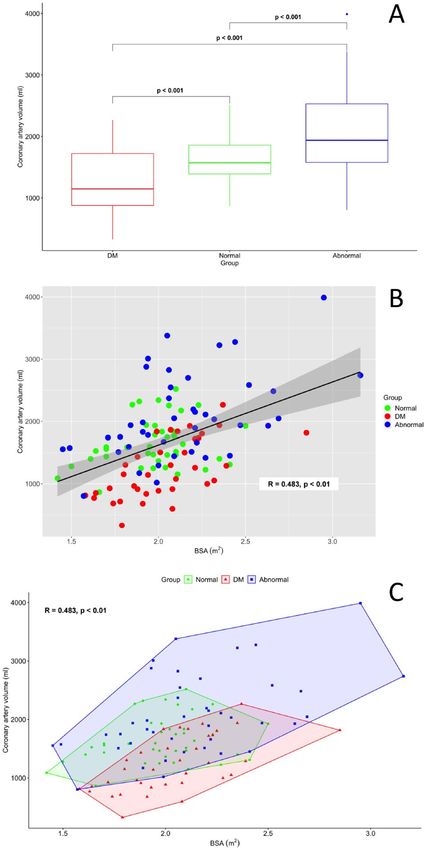
www.nature.com/scientificreports/
Conventional 2-dimensional (2D) quantitative coronary angiography (QCA) is a highly reproducible com-
puter-assisted technique, and is widely used to evaluate CAD in research s ettings6. However, 2D QCA has fun-
damental limitations as coronary angiography only provides a 2D image of the 3-dimensional (3D) structure of a
coronary artery7. Advances in imaging software have facilitated 3D QCA, with generation of a 3D reconstruction
of the coronary artery from two angiographic images, acquired at different angles8. This allows evaluation of
vessel segment length, diameter and volume. We propose that plotting coronary volumes against a population-
based normal range, with z-scoring, equivalent to the paediatric echocardiographic method, would assist in the
diagnosis of aneurysm and ectasia, where the angiographic appearances are ambiguous.
As proof of principle, we have tested this new method of vessel assessment in 3 distinct populations of patient
assessed by coronary angiography. In this study, we report the 3D QCA characteristics of the coronary arteries
of patients with diabetes without evidence of significant coronary artery disease (CAD), in non-diabetic patients
without evidence of significant CAD and in patients with angiographic evidence of aneurysmal or ectatic coro-
nary arteries. Furthermore, we tested inter-observer variability of this novel analysis to ensure that the technique
could be deployed clinically.
Results
Study population. From a total of 1437 patients, 131 individuals were included from three groups: 42
(normal angiography group), 36 (diabetic group), and 53 (abnormal group: 28 aneurysmal and 25 ectatic). The
average age of the 131 patients was 43.2 ± 5.3 years, 76.3% were male, with a near-exclusive population of males
in the abnormal group (94.3% p < 0.01). Differences in risk factor profile were observed between groups, with the
greatest number of risk factors in the diabetic cohort (3.4 ± 1.1) and least in the normal group (0.8 ± 1.2, p < 0.01).
The majority of patients (74.8%) had right dominant coronary anatomy. No difference in height was observed
between groups (172.8 ± 10.1 cm) but variation in weight was observed (81.7 ± 17.4 kg normal, 88.4 ± 20.3 kg
diabetic & 96.8 ± 29.1 kg abnormal group, p = 0.018), resulting in a significant difference in BMI & BSA between
groups. All baseline characteristics are shown in Table S1 in the supplementary material.
Data collected for coronary artery reconstruction by 3D QCA. 3D coronary artery reconstruction
was performed in a total of 1025 segments from 131 patients. In total, 23 segments were uninterpretable due
to failure to generate 3D reconstruction (18 segments in 13 patients), or anatomical absence of the LMCA (5
patients). Data collected by the 3D QCA software included lumen volume, proximal and distal diameters, and
segment length.
Total coronary artery volume. The total coronary volume was defined as the combined volume of the
major coronary arteries which was the summation of volumes from the RCA (segments 1, 2, and 3), LAD (seg-
ments 6 and 7), and LCX (segments 11 and 13), and LMCA (segment 5). Quantification of total coronary vol-
ume was possible in 118 (90.1%) of 131 patients, including 40 (95.2%) in the normal group, 36 (100%) in the
diabetic group, and 42 (79.2%) in the abnormal group. The total coronary volume was significantly different
between each group (1240 ± 476 mm3 diabetic group, 1646 ± 391mm3 normal group, and 2072 ± 687 mm3 abnor-
mal group—see Fig. 1A). In addition, total coronary volume had a significant correlation with body surface area
(BSA) (R = 0.483, p < 0.001—see Fig. 1B). The distribution of total coronary artery volume and BSA between
groups is graphically represented in Fig. 1C, indicating greater variation within the abnormal group. Despite
this greater variation, a significant correlation between volume and BSA was observed in the abnormal group
(R = 0.493, p < 0.001).
The volumes of each segment, major coronary artery and combined volumes are shown in Table 1. Impor-
tantly, the proximal segments in all three major coronary territories and the LMCA of the abnormal group had
consistently larger volumes compared to both the normal and diabetic groups. Additionally, the LAD and LCX
volumes in the diabetic group were significantly smaller than in the normal group.
Data of length and lumen diameter of coronary arteries by 3D QCA. The total length of the LAD
and RCA did not differ, however differences in the total length of the LCX and LMCA were observed between
groups. The diabetic group had a shorter LCX length, due to a significantly shorter mid segment (CASS segment
13). Contrary to this, the diabetic group had a significantly longer LMCA compared with the normal group
(10.9 ± 4.6 vs 8.2 ± 4.4 mm, p < 0.001), see Table S2.
Consistent with the observation that the abnormal group had greater proximal segment volumes, the segment
averaged and proximal reference diameters for all measurements in the abnormal group were larger in com-
parison to both other groups. Segmental analysis of the diabetic group coronary lumen diameters consistently
demonstrated the smallest measurements across all three groups, see Table S3. In the light of the observation of
differences in segmental length between groups, an additional analysis was undertaken to correct for segment
length, using a volume/length ratio ( mm3/mm), and demonstrated a consistent difference between all 3 patient
groups (diabetes < normal < abnormal), see Table S4.
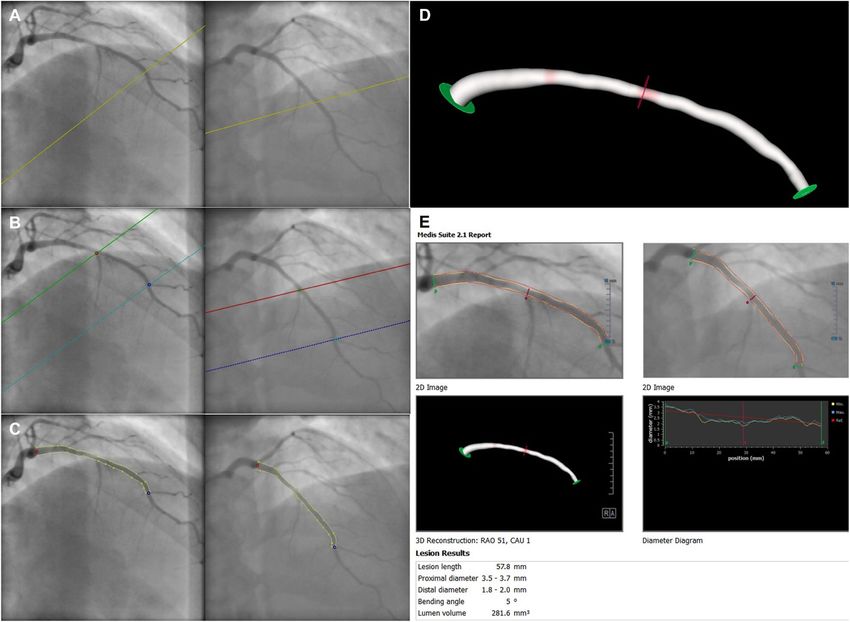
Inter‑observer variability. A total of 89 segments from 30 patients were randomly re-analysed by a sec-
ond observer to investigate inter-observer variability of 3D QCA. This included 9 normal, 6 with diabetes, and
15 (9 aneurysm and 6 ectasia) abnormal group individuals. There was a very strong and significant correlation
regarding the volume measurements between the two observers (r = 0.993, p < 0.001) (Fig. 2A). This relationship
also held true regarding the total coronary volume (RCA, LAD, and LCX) of 29 patients between observers
(r = 0.996, p < 0.001) (Fig. 2B). The absolute values produced by observer 1 versus observer 2 were very similar
(867 ± 415 mm3 vs. 893 ± 486 mm3 for the diabetic group [n = 5], 1673 ± 494 mm3 vs. 1668 ± 486 mm3 for the
Scientific Reports | (2021) 11:1170 | https://doi.org/10.1038/s41598-020-80928-4 2
Vol:.(1234567890)
www.nature.com/scientificreports/
Figure 1. Panel A—The quantification of total coronary artery volume (LAD + LCX + RCA + LMCA) for
three populations with non-atherosclerotic diabetic, normal, and dilated coronary disease. Panel B—The
correlation of total coronary artery volume with body surface area (BSA m2) with groups identified by colour
(diabetes = red; normal = green; abnormal = blue) with R = 0.48 (p < 0.01). Panel C—Total coronary artery volume
and BSA correlation with clustering of groups to identify distribution within groups. Abbreviations: BSA body
surface area, DM diabetes mellitus, LAD left anterior descending artery, LCX left circumflex artery, LMCA left
main coronary artery, RCAright coronary artery.
normal group [n = 9], and 1644 ± 568 mm3 vs. 1647 ± 608 mm3 [n = 15] for the abnormal group). Furthermore,
the intraclass correlation coefficient values for the measurements of LAD, LCX, and RCA were 0.963, 0.978,
and 0.999, respectively, demonstrating excellent inter-observer measurement consistency (see Table S5 in sup-
plementary material). Overall, this showed that there was no systematic error between observers and negligible
skilled-operator bias.
Discussion
To our knowledge, this work constitutes the first demonstration of a quantitative comparison of 3D coronary
artery characteristics by coronary volume reconstruction. This evaluation was undertaken to test the feasibility
and reproducibility of 3D QCA derived coronary volume analysis, in the first instance to assist with the chal-
lenging angiographic diagnosis of ectasia/aneurysm. Confirmation of a difference in coronary volume between
a normal population and selected cohort of patients with angiographic ectasia or aneurysm is reassuring but not
Scientific Reports | (2021) 11:1170 | https://doi.org/10.1038/s41598-020-80928-4 3
Vol.:(0123456789)www.nature.com/scientificreports/
DM group (n = 36) Normal group (n = 40) Abnormal group (n = 42)
Volume (mm3) Volume (mm3) Volume (mm3) p value§
,† ,‡ †,‡
Total coronary artery 1240 (476)* 1646 (391)* 2072 (687) < 0.001
LAD 278 (127)*,† 389 (123)*,‡ 468 (218)†,‡ < 0.001
Proximal LAD 137 (83)*,† 202 (88)*,‡ 271 (164)†,‡ < 0.001
Mid LAD 142 (77)† 187 (85) 206 (140)† 0.026
LCx 207 (126)*,† 292 (116)* 370 (237)† < 0.001
† ‡
Proximal LCx 97 (60) 129 (77) 189 (147)†,‡ 0.001
Mid LCx 106 (102) 164 (89)† 181 (134)† 0.011
RCA 606 (340)† 803 (332) 980 (493)† < 0.001
Proximal RCA 241 (139)† 335 (173)‡ 441 (231)†,‡ < 0.001
Mild RCA 146 (116)*,† 214 (120)* 228 (135)† 0.011
Distal RCA 218 (132) 254 (138) 312 (234) 0.065
LMCA 120 (81)† 118 (75)‡ 179 (102)†,‡ 0.002
Table 1. Comparison of coronary volumes in groups. Data are expressed as mean (SD). LAD left anterior
descending artery, LCx left circumflex artery, RCAright coronary artery, LMCA left main coronary artery.
*Significant difference between DM and Normal. § ANOVA for DM group vs. Normal group vs. Abnormal
group. † Significant difference between DM and abnormal. ‡ Significant difference between normal and
abnormal.
Figure 2. Correlation regarding the volume of 89 segments (A) and the total coronary volume of 29 patients
(B) between two observers. Abbreviations: LAD left anterior descending artery, LCX left circumflex artery, RCA
right coronary artery.
surprising. However, our segmental analysis has confirmed that despite increased vessel dimensions throughout
all major epicardial coronary arterial segments, a significant increase in coronary volume is predominantly
observed in the proximal segments. Importantly, low inter-observer variability was observed, however, automa-
tion of this enhanced QCA would further enhance the operator’s interpretation of the coronary angiogram and
improve the diagnostic yield/identification of important non-stenotic coronary abnormalities.
Coronary artery aneurysm and ectasia are associated with a poor p rognosis9,10. Previous studies have demon-
strated that thrombosis and embolisation of the involved segments are the leading cause of acute MI in patients
with coronary artery d ilation11,12. In our previous report focusing on the abnormal cohort, despite low preva-
lence (3.4%) in patients under 50 years of age, 71.4% of all patients with coronary artery dilation presented with
an acute ST-elevation myocardial infarction3. Furthermore, angiographic signs of turbulent and stagnant flow,
have been demonstrated in patients with coronary artery dilation by using doppler velocity and thrombolysis in
myocardial infarction (TIMI) frame count method, an index of coronary flow v elocity13,14. However, at present,
there is no data regarding an association between the coronary volume and coronary flow velocity. Our results
are consistent with 3D coronary artery volume reconstructions of dilated coronary arteries being significantly
larger than the volume of equivalent normal and diabetic arteries. In the future, use of 3D QCA may enable a
better understanding of the association between coronary volume and flow dynamics in patients with dilated
coronary arteries.
The inclusion of an additional cohort of diabetics with qualitatively normal coronary arteries was considered
to test the new method of 3D QCA in the detection of possible early angiographic changes relating to diabetic
Scientific Reports | (2021) 11:1170 | https://doi.org/10.1038/s41598-020-80928-4 4
Vol:.(1234567890)www.nature.com/scientificreports/
vasculopathy. Hyperglycaemia has long been known as a risk factor in the progression of vascular complica-
tions of diabetes leading to changes in blood vessel diameter in arterial and arteriolar v essels15,16. Furthermore,
increasing blood glucose may also have an effect on vasoconstriction17. As a consequence of this hyperglycaemic
phenomenon, diabetes may be associated with CAD leading to MI and angina18. Indeed, Mosseri et al. showed
that coronary arteries of diabetic patients had a smaller diameter than those of normal s ubjects19. In the present
study, we observed that this is particularly apparent in the LAD (segment 6 and 7), and LCX (segment 11 and 13)
with a trend towards smaller diameters in the RCA (see Table S3 in supplementary material). Furthermore, our
measurements of total coronary artery volume of the diabetic group were significantly smaller than the normal
group. This phenomenon might be explained by the effect of chronic hyperglycaemia which impairs functional
vasodilation via increasing thromboxane-receptor-mediated v asoconstriction20.
Despite the pilot nature of our data, we have demonstrated a moderate correlation between total coronary
volume and BSA. It has previously been demonstrated that there is a linear correlation between coronary artery
diameter and BSA in children21. As a result, BSA-adjusted coronary artery Z-scores (standard deviations from
the mean) have been used for classifying coronary artery dilation in young patients with Kawasaki d isease22.
However, as the paediatric Z-score is an ultrasound-based measurement and is not possible in adults, there is no
diagnostic equivalent for adults with coronary aneurysm or ectasia. Beyond the choice of imaging modality, there
are other important differences between the paediatric and adult populations. The adult population has a stable
height but fluctuant body weight that may lead to a less consistent correlation between coronary volume and BSA,
consequently indexing against other anthropomorphic parameters may prove more useful. Assessment of total
coronary volume and height in our population provided a similarly moderate correlation (R = 0.42), which was
partially enhanced when restricted to the normal group (R = 0.49). Correction of measurements to myocardial
mass may provide the most accurate method of indexing, however, this would require multi-modality imaging.
It is anticipated that extending our analysis to a larger cohort will further enhance our correlations and provide
the potential for producing a Z-score equivalent using total coronary artery volume to differentiate pathological
coronary artery dilation from healthy individuals.
Analysis of luminal diameters of normal coronary arteries are well established although differences in study
methodology can make comparison c hallenging23–25. In the recent study by Medrano-Garcia et al., diameter and
lengths of normal coronary artery were evaluated using computed tomography a ngiograms26. It is useful to com-
pare our angiographically derived measurements against CT-derived measurements, albeit from separate popula-
tions. Our population had larger vessel diameters across all proximal segments, however, the derived LAD and
LCX proximal segment lengths were shorter (22.6 ± 9.5 mm and 16.5 ± 8.3 mm, respectively vs. 35.5 ± 15.2 mm
and 41.3 ± 20.4 mm by CT). Whereas, LMCA and RCA lengths appeared remarkably consistent (8.2 ± 4.4 mm
and 106 ± 22.1 mm, respectively vs. 10.5 ± 5.3 mm and 106 ± 28.8 mm for CT). The variance in this comparison
is likely to reflect the dependence of our 3D QCA analysis on optimally selected angiographic projections to
generate an accurate reconstruction. Ultimately it would be useful to undertake a comparison of 3D QCA by
multiple modalities to validate the coronary volume measurements.
There are several limitations that should be acknowledged. Firstly, this study was designed as a ‘proof-of-
concept’ evaluation and consequently was not adequately powered to assess for significant differences between
individual QCA parameters, or to provide sufficient data to generate a nomogram or thresholds for identification
of coronary volume abnormalities. For this reason, angiographically evident coronary disease was excluded,
however, we acknowledge that clinical application of this 3D QCA analysis will necessitate inclusion of a full
spectrum of coronary disease. We anticipate that segmental-level analysis would facilitate comparative assess-
ment in the presence of significant CAD. Secondly, as indicated by the comparison with CT-derived coronary
dimensions, the retrospective nature of our analysis prevented optimisation of angiographic acquisition for each
coronary segment. Of the initial population of 131 patients, 13 were excluded due to an inability to generate 3D
reconstructions of all 3 coronary arteries. The majority of these patients had significant ectasia or aneurysm that
significantly distorted image reconstruction. However, it is important to recognise that retrospective foreshorten-
ing with underestimation of coronary segment lengths is likely to contribute to the differences observed between
modalities. Our intention is to repeat the analysis using a validation cohort from a collaborating centre and the
ultimate goal is to undertake a prospective study utilising a dedicated acquisition/analysis protocol. Particular
care will be taken to optimise image acquisition and minimisation of distortion of the 3D reconstruction of the
coronaries, before considering our novel method as a clinical application for diagnosis of non-atherosclerotic
coronary artery abnormalities.
Evaluation of coronary angiographic images tends to be qualitative in clinical practice, and consequently
non-stenotic disease can be challenging to detect. We have demonstrated the feasibility of a 3D QCA methodol-
ogy to quantify coronary volume in three distinct patient populations. This quantitative analysis correlates with
BSA, has good reproducibility, and therefore offers potential as a tool for measuring coronary artery volume and
identification of non-atherosclerotic coronary abnormalities. Larger scale, prospective, studies will be needed
to generate adult Z-scoring for accurate identification and monitoring of abnormal coronary artery dilation,
including aneurysm and ectasia.
Methods
Study population and definitions of each group. We have previously reported the prevalence of
aneurysmal and ectatic disease within an unselected population of 1437 patients, under 50 years-of-age, that
underwent coronary angiography between 2011 and 2015, at the Bristol Heart Institute, Bristol, U K3. We have
extended the analysis to include two further populations from this cohort: patients found to have angiographi-
cally normal arteries, with or without a history of diabetes mellitus.
Scientific Reports | (2021) 11:1170 | https://doi.org/10.1038/s41598-020-80928-4 5
Vol.:(0123456789)www.nature.com/scientificreports/
Figure 3. The process of 3D angiographic coronary artery volume reconstruction by 3D QCA. (A) Selection
of the routine coronary angiography acquisition, two image sequences acquired at two angiographic views with
projection angles at least 25° apart. (B) Identifying one to two anatomical markers such as bifurcations and
side branches for automated correction of system distortions in the image geometry. (C) Manually defining
the corresponding start and end positions of the interested vessel segment and extracting its contours and
centerline. (D) Automating 3D coronary artery reconstruction of the vessel segment of interest. (E) Final 3D
QCA report, including coronary volume, length, and proximal and distal diameter of the segment of interest.
The diameter analysis includes a minimum (yellow line), maximum (blue line) and reference (red line)
dimension. Abbreviations: QCA quantitative coronary angiography.
Patients were excluded if they had poor angiographic images or if there was only one angiographic view per
artery, as neither are suitable for 3D QCA.
This study falls outside the scope of the UK policy framework for health and social care research and was
registered with University Hospitals Bristol and Weston NHS Foundation Trust as a service evaluation. It is
an analysis of routinely collected anonymized data, and followed the national “Guidance on the use of patient
images obtained as part of standard care for teaching, training and research” issued by the Royal College of
Radiologists, UK.
Group with healthy coronary artery (normal group). There were 344 patients with atypical chest pain
who underwent coronary angiography to investigate for CAD, without evidence of any luminal stenosis/coro-
nary atheroma. We excluded patients who had a history of myocardial infarction (MI), renal failure, diabetes,
and > 2 risk factors for CAD, including hypertension, dyslipidaemia, smoking, and family history of CAD in first
degree relatives less than 60 years of age, as these factors could affect coronary volume.
Group with diabetic coronary arteries (diabetic group). There were a total of 150 patients with insu-
lin dependent diabetes investigated by coronary angiography for stable anginal symptoms. Insulin treatment
was identified as as a surrogate for extended hypo-glycaemic treatment and thereby significant exposure to the
potential vasculopathic effects of diabetes. Patients with evidence of luminal stenosis secondary to overt athero-
sclerosis were excluded from the analysis.
Scientific Reports | (2021) 11:1170 | https://doi.org/10.1038/s41598-020-80928-4 6
Vol:.(1234567890)www.nature.com/scientificreports/
Group with aneurysmal or ectatic coronary arteries (abnormal group). All coronary angiograms
demonstrating any discrepancy of vessel calibre were reviewed, independently, by two interventional cardiolo-
gists. Coronary aneurysm was defined by quantitative dilatation of the coronary artery exceeding 50% of an
adjacent segment diameter and ectasia was dichotomized by evidence of extension across 2 or more coronary
segments27.
3D volumetric coronary angiographic analysis. 3D angiographic coronary artery reconstruction was
performed using QAngio XA 3D (Research Edition, Medis medical imaging systems, Leiden, The Netherlands).
The 3D reconstruction procedure consisted of the following steps: (1) from the routine coronary angiography
acquisitions, two image sequences acquired from two angiographic projections at least 25° apart were high-
lighted; (2) end-diastolic still frames with complete vessel contrast-filling were selected (Fig. 3A); (3) one to two
anatomical markers such as bifurcations and side branches were identified for automated correction of system
distortions in the image geometry for the 3D angiographic reconstruction (Fig. 3B); (4) the corresponding start
and end positions of the vessel segment of interest and its contours and centre line were semi-automatically
defined (Fig. 3C); (5) automated 3D reconstruction was then performed (Fig. 3D). The data extract from the 3D
analysis included lumen volume, proximal and distal diameters, and segment length (Fig. 3E).
Coronary artery segments classification. Two interventional cardiologists determined each coronary
segment according to the American Heart Association (AHA) classification28 (adapted from the original CASS
segmentation model). If the AHA classification was not suitable for evaluating a segment, the segment would be
defined using the modified AHA c lassification29. Volumetric analysis was restricted to the proximal and mid-
vessel segments of all three major epicardial arterial territories. According to the segment classification, the right
coronary artery (RCA) analysis included segments 1, 2, and 3. Regarding the left coronary system, the left main
coronary artery (LMCA) segment 5, the left anterior descending artery (LAD) segments 6 and 7, and the left
circumflex artery (LCX) segments 11 and 13 were included in the analysis.
Statistical analysis. Continuous variables were expressed as mean with standard deviation (SD) and dif-
ferences were investigated by use of one-way analysis of variance (ANOVA). Post-hoc analysis was conducted
using Tukey Honest Significant Differences. Categorical variables were reported as numbers with percentage
and compared with χ2 test. Correlations were assessed using the Pearson’s correlation coefficient, and the intra-
class correlation coefficient was used to evaluate consistency of inter-observer agreement of coronary volume
measurements. All variables were considered significant when the p value was < 0.05. Statistical analysis was
performed using SPSS 22.0 for Windows (SPSS-PC, Chicago, IL, USA) and R version 3.6.0 (2019-04-26—R Core
Team (2019). R: A language and environment for statistical computing. R Foundation for Statistical Computing,
Vienna, Austria. URL https://www.R-project.org/.)
Received: 6 July 2020; Accepted: 17 December 2020
References
1. Morgagni, G. De Sedibus et Causis Morborum Per Anatomen Indagatis. Venetiis, 1761. The Seats and Causes of Diseases Investigated
by Anatomy. five books; translated from the Latin by Benjamin Alexander. New York: Hafner (1960).
2. Björk, L. Ectasia of the coronary arteries. Radiology 87, 33–34. https://doi.org/10.1148/87.1.33 (1966).
3. Waterhouse, B. R. et al. Retrospective study of the impact of unrecognised Kawasaki disease, coronary aneurysm and ectasia. Int.
J. Cardiol. 248, 308–313. https://doi.org/10.1016/j.ijcard.2017.08.018 (2017).
4. Kawsara, A. et al. Management of coronary artery aneurysms. JACC Cardiovasc. Interven. 11, 1211–1223. https: //doi.org/10.1016/j.
jcin.2018.02.041 (2018).
5. Lopez, L. et al. Relationship of echocardiographic Z scores adjusted for body surface area to age, sex, race, and ethnicity. Circ.
Cardiovasc. Imaging 10, 66. https://doi.org/10.1161/circimaging.117.006979 (2017).
6. de Feyter, P. J. et al. Quantitative coronary angiography to measure progression and regression of coronary atherosclerosis. Value,
limitations, and implications for clinical trials. Circulation 84, 412–423 (1991).
7. Topol, E. J. & Nissen, S. E. Our preoccupation with coronary luminology. The dissociation between clinical and angiographic
findings in ischemic heart disease. Circulation 92, 2333–2342 (1995).
8. Tu, S., Huang, Z., Koning, G., Cui, K. & Reiber, J. H. A novel three-dimensional quantitative coronary angiography system: In-vivo
comparison with intravascular ultrasound for assessing arterial segment length. Catheteriz. Cardiovasc. Interven. 76, 291–298.
https://doi.org/10.1002/ccd.22502 (2010).
9. Baman, T. S., Cole, J. H., Devireddy, C. M. & Sperling, L. S. Risk factors and outcomes in patients with coronary artery aneurysms.
Am. J. Cardiol. 93, 1549–1551. https://doi.org/10.1016/j.amjcard.2004.03.011 (2004).
10. Eitan, A. & Roguin, A. Coronary artery ectasia: New insights into pathophysiology, diagnosis, and treatment. Coron. Artery Dis.
27, 420–428. https://doi.org/10.1097/MCA.0000000000000379 (2016).
11. Swanton, R. H. et al. Coronary artery ectasia—A variant of occlusive coronary arteriosclerosis. Brit. Heart J. 40, 393–400 (1978).
12. Jang, I. K., Lassila, R. & Fuster, V. Atherogenesis and inflammation. Eur. Heart J. 14(Suppl K), 2–6 (1993).
13. Akyurek, O. et al. Altered coronary flow properties in diffuse coronary artery ectasia. Am. Heart J. 145, 66–72. https://doi.
org/10.1067/mhj.2003.48 (2003).
14. Papadakis, M. C. et al. Documentation of slow coronary flow by the TIMI frame count in patients with coronary ectasia. Am. J.
Cardiol. 88, 1030–1032 (2001).
15. Hink, U. et al. Mechanisms underlying endothelial dysfunction in diabetes mellitus. Circ. Res. 88, E14-22 (2001).
16. Zamami, Y. et al. Acute hyperglycemia and hyperinsulinemia enhance adrenergic vasoconstriction and decrease calcitonin gene-
related peptide-containing nerve-mediated vasodilation in pithed rats. Hypertens. Res. 31, 1033–1044. https://doi.org/10.1291/
hypres.31.1033 (2008).
Scientific Reports | (2021) 11:1170 | https://doi.org/10.1038/s41598-020-80928-4 7
Vol.:(0123456789)www.nature.com/scientificreports/
17. Iwakura, K. et al. Association between hyperglycemia and the no-reflow phenomenon in patients with acute myocardial infarction.
J. Am. Coll. Cardiol. 41, 1–7 (2003).
18. Butler, R., MacDonald, T. M., Struthers, A. D. & Morris, A. D. The clinical implications of diabetic heart disease. Eur. Heart J. 19,
1617–1627 (1998).
19. Mosseri, M. et al. Diffuse narrowing of coronary arteries in diabetic patients: The earliest phase of coronary artery disease. Cardiol-
ogy 89, 103–110. https://doi.org/10.1159/000006764 (1998).
20. Xiang, L., Naik, J. S., Abram, S. R. & Hester, R. L. Chronic hyperglycemia impairs functional vasodilation via increasing thrombox-
ane-receptor-mediated vasoconstriction. Am. J. Physiol. Heart Circ. Phys. 292, H231-236. https://doi.org/10.1152/ajpheart.00623
.2006 (2007).
21. Oberhoffer, R., Lang, D. & Feilen, K. The diameter of coronary arteries in infants and children without heart disease. Eur. J. Pediatr.
148, 389–392 (1989).
22. McCrindle, B. W. et al. Diagnosis, treatment, and long-term management of Kawasaki disease: A scientific statement for health
professionals from the American Heart Association. Circulation 135, e927–e999. https://doi.org/10.1161/CIR.000000000000048
4 (2017).
23. Dodge, J. T. Jr., Brown, B. G., Bolson, E. L. & Dodge, H. T. Lumen diameter of normal human coronary arteries. Influence of age,
sex, anatomic variation, and left ventricular hypertrophy or dilation. Circulation 86, 232–246 (1992).
24. Cuspidi, C. et al. Lack of correlation between left ventricular mass and diameter of left coronary artery main trunk in hypertensive
patients. Am. J. Hypertens. 12, 1163–1168 (1999).
25. Raut, B. K., Patil, V. N. & Cherian, G. Coronary artery dimensions in normal Indians. Indian Heart J. 69, 512–514. https://doi.
org/10.1016/j.ihj.2017.01.009 (2017).
26. Medrano-Gracia, P. et al. A computational atlas of normal coronary artery anatomy. EuroIntervention 12, 845–854. https://doi.
org/10.4244/EIJV12I7A139 (2016).
27. Swaye, P. S. et al. Aneurysmal coronary artery disease. Circulation 67, 134–138 (1983).
28. Austen, W. G. et al. A reporting system on patients evaluated for coronary artery disease. Report of the Ad Hoc Committee for
Grading of Coronary Artery Disease, Council on Cardiovascular Surgery. Am. Heart Assoc. Circ. 51, 5–40 (1975).
29. Kaiser, C. et al. Limited diagnostic yield of non-invasive coronary angiography by 16-slice multi-detector spiral computed tomog-
raphy in routine patients referred for evaluation of coronary artery disease. Eur. Heart J. 26, 1987–1992. https://doi.org/10.1093/
eurheartj/ehi384 (2005).
Acknowledgements
We thank all the staff working in the cardiac catheterisation laboratories and CCU at Bristol Heart Institute for
their commitment to this study.
Author contributions
Y.K. and T.J. wrote the original main manuscript text and J.B., B.W., A.G., G.C., E.S., V.D. prepared figures and
tables. R.T., D.A., and T.J. reviewed the edited manuscript text. All authors reviewed the manuscript
Funding
DA has received funding from the NIHR rare disease translational collaboration and the British Medical Associa-
tion (Josephine Lansdell grant) for research into coronary aneurysms and ectasia. TWJ is in part supported by the
NIHR Biomedical Research Centre at University Hospitals Bristol NHS Foundation Trust and the University of
Bristol. The views expressed in this publication are those of the author(s) and not necessarily those of the NHS,
the National Institute for Health Research or the Department of Health and Social Care.
Competing interests
DA has received research funding and in kind research support from Astra Zeneca & Abbott Vascular to sup-
port a clinical research fellow and undertaken consultancy with General Electric to support research funds. All
were for unrelated research. TWJ has received honoraria or consultation fees from Abbott, Bayer AG, Biosen-
sors, Boston Scientific, Medtronic, Terumo and Vascular Perspectives; received grants/research support from
AstraZeneca and Bayer; and participates in a company sponsored speaker’s bureau for Abbott. All other authors
have no competing interests to declare.
Additional information
Supplementary Information The online version contains supplementary material available at https://doi.
org/10.1038/s41598-020-80928-4.
Correspondence and requests for materials should be addressed to T.W.J.
Reprints and permissions information is available at www.nature.com/reprints.
Publisher’s note Springer Nature remains neutral with regard to jurisdictional claims in published maps and
institutional affiliations.
Open Access This article is licensed under a Creative Commons Attribution 4.0 International
License, which permits use, sharing, adaptation, distribution and reproduction in any medium or
format, as long as you give appropriate credit to the original author(s) and the source, provide a link to the
Creative Commons licence, and indicate if changes were made. The images or other third party material in this
article are included in the article’s Creative Commons licence, unless indicated otherwise in a credit line to the
material. If material is not included in the article’s Creative Commons licence and your intended use is not
permitted by statutory regulation or exceeds the permitted use, you will need to obtain permission directly from
the copyright holder. To view a copy of this licence, visit http://creativecommons.org/licenses/by/4.0/.
© The Author(s) 2021
Scientific Reports | (2021) 11:1170 | https://doi.org/10.1038/s41598-020-80928-4 8
Vol:.(1234567890)You can also read