Does Motor Tract Integrity at 1 Month Predict Gait and Balance Outcomes at 6 Months in Stroke Patients?
←
→
Page content transcription
If your browser does not render page correctly, please read the page content below
brain
              sciences
Article
Does Motor Tract Integrity at 1 Month Predict Gait and Balance
Outcomes at 6 Months in Stroke Patients?
SoYeon Jun 1 , BoYoung Hong 2 , YoungKook Kim 3 and SeongHoon Lim 2, *

                                          1   Department of Rehabilitation Medicine, Seoul St. Mary’s Hospital, College of Medicine,
                                              The Catholic University of Korea, Seoul 06591, Korea; iamsj17@naver.com
                                          2   Department of Rehabilitation Medicine, St. Vincent’s Hospital, College of Medicine,
                                              The Catholic University of Korea, Seoul 06591, Korea; byhong@catholic.ac.kr
                                          3   Department of Rehabilitation Medicine, Yeouido St. Mary’s Hospital, College of Medicine,
                                              The Catholic University of Korea, Seoul 06591, Korea; england2@catholic.ac.kr
                                          *   Correspondence: seonghoon@catholic.ac.kr; Tel.: +82-31-249-8952; Fax: +82-31-251-4481

                                          Abstract: Recovery of balance and gait ability is important in stroke patients. Several studies have
                                          examined the role of white matter tracts in the recovery of gait and balance, but the results have
                                          been inconclusive. Therefore, we examined whether the integrity of the corticospinal tract (CST),
                                          corticoreticular pathway (CRP), and cortico-ponto-cerebellar tract (CPCT) at 1 month predicted
                                          balance and gait function 6 months after stroke onset. This retrospective longitudinal observational
                                          clinical study assessed 27 patients with first-ever unilateral supratentorial stroke. The subjects
                                          underwent diffusion tensor imaging 1 month after the stroke, and the Functional Ambulation
                                          Categories (FAC) and Berg Balance Scale (BBS) scores were assessed after 6 months. The normalized
                                          fiber number (FN) and fractional anisotropy (FA) results for the CST, CRP and CPCT were also

                                   obtained. The FN and FA results for the CST, CRP, or CPCT at 1 month were not related to the gait or
                                          balance at 6 months. There was also no difference in FAC values at 1 month after stoke onset among
Citation: Jun, S.; Hong, B.; Kim, Y.;
                                          three groups differing in degree of independence of ambulation. The integrity of the CST, CRP, and
Lim, S. Does Motor Tract Integrity at
                                          CPCT on 1 month after stroke onset was not associated with gait or balance after 6 months. The
1 Month Predict Gait and Balance
Outcomes at 6 Months in Stroke
                                          white matter integrity did not predict the clinical outcome.
Patients? Brain Sci. 2021, 11, 867.
https://doi.org/10.3390/                  Keywords: stroke; gait; balance; diffusion tensor imaging; corticospinal tract; corticoreticular path-
brainsci11070867                          way; corticopontocerebellar tract

Academic Editor: Giovanni Morone

Received: 4 May 2021                      1. Introduction
Accepted: 28 June 2021
                                                Restoration of gait and balance is important for stroke patients. Well control of gait and
Published: 29 June 2021
                                          posture is complex, and is managed by higher centers in the brain (locomotor programming
                                          at the level of the cerebral cortex, with basal ganglia and cerebellum involvement) [1].
Publisher’s Note: MDPI stays neutral
                                          Recovery of gait has been investigated in several ways. The studies with brain imaging
with regard to jurisdictional claims in
                                          revealed that lesion size and involvement of the internal capsule, caudate nucleus, or
published maps and institutional affil-
                                          putamen white matter were associated with poorer gait recovery [2–4]. Other research
iations.
                                          showed that white matter injury might play roles in balance and gait function [5,6].
                                                The corticospinal tract (CST) is involved in the recovery of upper limb motor function,
                                          especially hand function [7,8]. The corticoreticular pathway (CRP) is an extrapyramidal
                                          motor pathway that innervates the proximal muscles of the limbs and the axial muscles; it
Copyright: © 2021 by the authors.
                                          plays roles in standing, gait, and postural control [5,9]. The cerebellum is responsible for
Licensee MDPI, Basel, Switzerland.
                                          motor coordination and gait control, while the cerebellar afferent cortico-ponto-cerebellar
This article is an open access article
                                          tract (CPCT) delivers information on voluntary motor activity to the dentate nucleus [5,10].
distributed under the terms and
                                          CPCT injury was observed in a patient with ataxia and tremor after a traumatic brain
conditions of the Creative Commons
                                          injury [11].
Attribution (CC BY) license (https://
creativecommons.org/licenses/by/
                                                We hypothesized that the integrity of these three white matter tracts is related to the
4.0/).
                                          recovery of gait and balance in patients with stroke, and investigated whether the integrity

Brain Sci. 2021, 11, 867. https://doi.org/10.3390/brainsci11070867                                          https://www.mdpi.com/journal/brainsci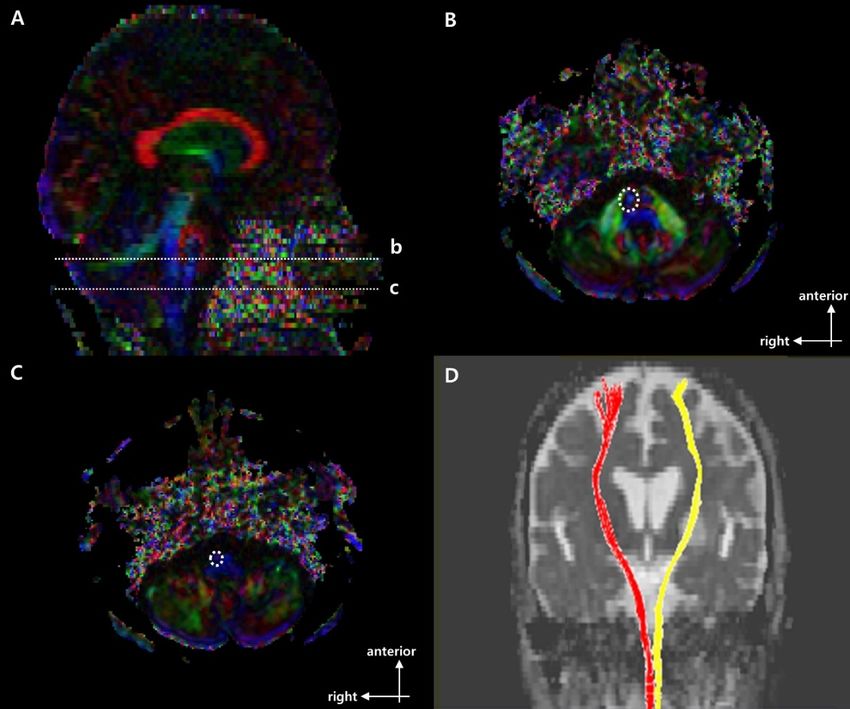
Brain Sci. 2021, 11, 867                                                                                            2 of 10

                           of the CST, CRP, and CPCT at 1 month after stroke onset predicts gait and balance outcomes
                           at 6 months.

                           2. Materials and Methods
                           2.1. Study Design and Participants
                                 This retrospective, longitudinal and observational clinical trial enrolled 27 patients
                           suffering unilateral supratentorial first-ever stroke between September 2014 and September
                           2019. All patients were older than 18 years, had undergone 3T magnetic resonance imaging
                           (MRI) with diffusion tensor imaging (DTI) 1–6 weeks (i.e., ~1 month) after stroke onset, and
                           underwent functional assessments after 6 months. Exclusion criteria included underlying
                           degenerative brain disease or other psychiatric disorder, an inability to ambulate before
                           the stroke, and stroke recurrence within 6 months after onset.
                                 Demographic, clinical, and brain DTI data were obtained from all patients. The 3T-
                           MRI DTI was performed 24.9 ± 8.03 days after stroke onset. A rehabilitation program
                           including neurodevelopmental physical and occupational therapy was treated within
                           7 days of stroke onset in all subjects and continued for up to 6 months (2–3 h daily, 5 days
                           a week, with speech therapy as needed) [12].
                                 Since this was an observational study, the number of samples was not specified in ad-
                           vance. However, since previous DTI parameter-based studies enrolled 10 to 25 subjects [13,14],
                           we wanted to achieve a sample size of more than 25 subjects. Initially, 140 patients were
                           seen during the study period, but 66 were excluded due to missing 1-month MRI data,
                           while 21 had underlying lesions warranting exclusion, and 26 were lost to follow-up within
                           6 months after stroke onset.
                                 The study protocol was approved by the Institutional Review Board of Catholic Uni-
                           versity, College of Medicine (Registry No. VC19RISI0265), which waived the requirement
                           for informed consent.

                           2.2. Functional Assessment
                                 The demographic data of all subjects were reviewed retrospectively. The patients were
                           functionally assessed 6 months after the stroke.
                                 We classified the 27 patients into three groups according to their gait and balance. Gait
                           was assessed using the Functional Ambulation Categories (FAC) scale, on which scores
                           range from 0 to 5 according to the degree of independence in ambulation [15]. The patients
                           were grouped by FAC score as follows: FAC score of 0–1, nonfunctional; FAC score of 2–3,
                           dependent; and FAC score of 4–5, independent. patients were also grouped by Berg Balance
                           Scale (BBS) score (0–20; very high, 21–40; moderate, or 41–56; low risk of falling) [15,16].
                           The Korean version of the modified Barthel Index (K-MBI) was used to estimate disability
                           in all subjects [17,18].

                           2.3. Fiber Bundle Tracking
                                DTI was performed using a 3.0-T MAGNETOM® Verio scanner (Siemens, Erlangen,
                           Germany) equipped with a six-channel head coil. Data were acquired as single-shot
                           spin-echo echo-planar images, with axial slices covering the entire brain across 76 inter-
                           leaved 2.0-mm-thick slices [no gap; repetition time/echo time = 14,300/84 ms; field of
                           view = 224 × 224 mm2 ; matrix = 224 × 224; voxel size = 1 × 1 × 2 mm3 (isotropic); number
                           of excitations = 1]. Diffusion sensitizing gradients were applied in 64 noncollinear direc-
                           tions with a b-value of 1000 ms/mm2 . The b = 0 images were scanned before acquiring
                           the diffusion-weighted images, and there were 65 volumes in total [19]. DTI Studio (Johns
                           Hopkins University, Baltimore, MD, USA) was used to compute the diffusion tensor for
                           fiber bundle tracking, which was based on the fiber assignment by continuous tracking
                           (FACT) algorithm with a fractional anisotropy (FA) threshold of 0.25 and angle threshold
                           of 60 degrees [20].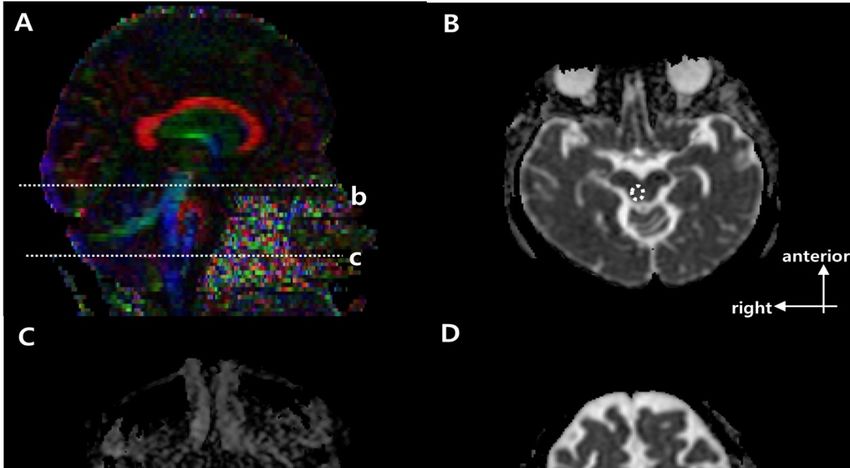
Brain Sci. 2021, 11, x FOR PEER REVIEW 3 of 10
Brain Sci. 2021, 11, 867 3 of 10
algorithm with a fractional anisotropy (FA) threshold of 0.25 and angle threshold of 60
degrees [20].1–3 show the regions of interest (ROIs) used to reconstruct the CST, CRP, and
Figures
Figures 1–3 show the color
CPCT in two-dimensional regions of interest
maps. (ROIs) used toofreconstruct
For reconstruction CST there the CST,
were CRP,
seed andand
target
CPCT
ROI on in
thetwo-dimensional
CST portion ofcolor maps. For reconstruction
the pontomedullary junctionofand
CSTthethere were seed
mid-pons, and tar-
respectively
get ROI1)on[10,21].
(Figure the CSTToportion of the pontomedullary
reconstruct CRP, a seed ROI junction and the
was placed onmid-pons,
the CRP respectively
portion of the
(Figure 1)
reticular [10,21]. To
formation in reconstruct
the medulla. CRP,
On athe
seed ROI was
midbrain placed on the
tegmentum andCRP portion of cortex,
the premotor the
reticular formation in the medulla. On the midbrain tegmentum and the premotor
there were first and second target ROI, respectively (Figure 2) [22]. For the CPCT, the cortex,
there were
portions firstCPCT
of the and second
on thetarget
middleROI, respectively
cerebellar (Figureand
peduncle 2) [22].
the For the CPCT,
cerebral the por-
peduncle of the
tions of the CPCT on the middle cerebellar peduncle and the cerebral
contra side were used as the seed and target ROI, respectively (Figure 3) [10] The peduncle of the
ROIs
contra side were used as the seed and target ROI, respectively (Figure 3) [10] The ROIs
mentioned above were used in a 2D color map. Fiber number (FN) and FA results of the
mentioned above were used in a 2D color map. Fiber number (FN) and FA results of the
CST, CRP, and CPCT were obtained in both the affected and unaffected hemispheres in all
CST, CRP, and CPCT were obtained in both the affected and unaffected hemispheres in
subjects. In the CPCT and non-CPCT groups, FN and FA were normalized by dividing the
all subjects. In the CPCT and non-CPCT groups, FN and FA were normalized by dividing
data for the affected side by that for the unaffected side [23].
the data for the affected side by that for the unaffected side [23].
Figure 1. Regions of interest (ROIs used to reconstruct the right corticospinal tract (CST) on DTI and
Figure 1. Regions of interest (ROIs used to reconstruct the right corticospinal tract (CST) on DTI and
representative diffusion tensor tractography (DTT) images of corticospinal tract (CST). (A) Sagittal
representative
color fractionaldiffusion
anisotropytensor
(FA)tractography
map with dotted (DTT) images
lines of corticospinal
at (b) the mid-pons andtract (CST).
(c) the (A) Sagittal
pontomedul-
color
lary fractional anisotropy
junction. (B) (FA)line
The dotted map with dotted
indicates lines at
the target (b)ofthe
ROI mid-pons
the CST at theandmid-pons
(c) the pontomedullary
in the axial
junction.
color map (B)(level
The dotted line(C)
b in (A)). indicates the target
The dotted ROI of the CST
line indicates seed at theofmid-pons
ROI the CST atinthe
thepontomedul-
axial color map
lary junction
(level b in (A)).in(C)
theThe
axialdotted
color map (level c in the
line indicates (A)).seed
(D) Representative
ROI of the CSTDTT image
at the of CST in a typical
pontomedullary junction
insubject with
the axial a left
color mapmiddle
(levelcerebral artery
c in (A)). (MCA) infarction
(D) Representative DTT (red, unaffected
image of CST side; yellow,subject
in a typical affected
with
side).
a left middle cerebral artery (MCA) infarction (red, unaffected side; yellow, affected side).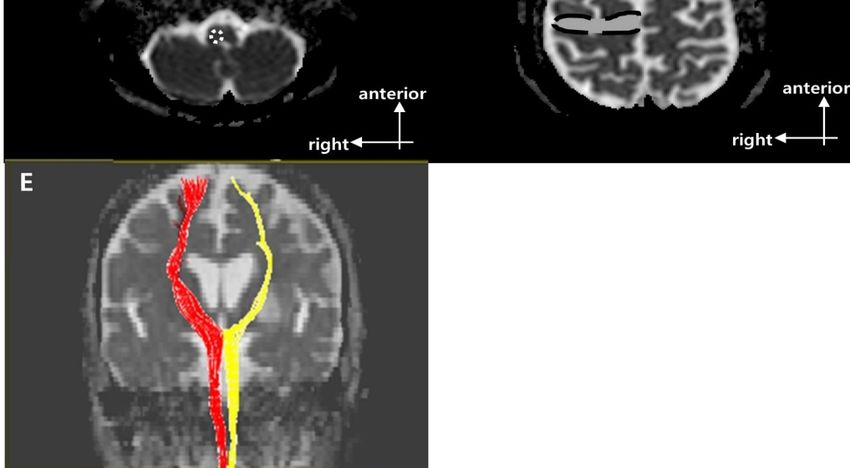
Brain Sci. 2021, 11, 867                                                                                                                             4 of 10
   Brain Sci. 2021, 11, x FOR PEER REVIEW                                                                                                      4 of 10

                                     Figure 2. Regions of interest (ROIs) used to reconstruct the right corticoreticular pathway (CRP) on
                                    Figure 2. Regions of interest (ROIs) used to reconstruct the right corticoreticular pathway (CRP) on
                                     diffusion tensor imaging (DTI) and representative diffusion tensor tractography (DTT) images of
                                    diffusion   tensor
                                     the CRP [9].    (A)imaging
                                                          Sagittal (DTI)  and representative
                                                                    color fractional   anisotropy diffusion
                                                                                                     (FA) maptensor
                                                                                                                withtractography
                                                                                                                      dotted lines (DTT)
                                                                                                                                      showing images   of the
                                                                                                                                                 the (b)
                                    CRP   [9]. (A)
                                     reticular      Sagittalofcolor
                                               formation             fractional
                                                               the medulla       anisotropy
                                                                               and             (FA)
                                                                                    (c) midbrain      map with dotted
                                                                                                   tegmentum.    (B) Thelines
                                                                                                                          dottedshowing    the (b) reticular
                                                                                                                                   circle indicates  the
                                    formation
                                     target ROI ofof the
                                                      the medulla
                                                          CRP at the  and  (c) midbrain
                                                                        midbrain            tegmentum.
                                                                                    tegmentum               (B)bThe
                                                                                                  in the axial       dotted(level
                                                                                                                 = 0 image    circlebindicates    the
                                                                                                                                       in (A)). (C) Thetarget
                                     dotted
                                    ROI      circle
                                          of the    indicates
                                                  CRP    at the the seed ROI
                                                                midbrain        of the CRPinatthe
                                                                             tegmentum          theaxial
                                                                                                    reticular
                                                                                                          b = formation   of thebmedulla
                                                                                                              0 image (level                in the
                                                                                                                                  in (A)). (C)  Theaxial
                                                                                                                                                      dotted
                                     b = 0 image
                                    circle         (level
                                           indicates    thec seed
                                                             in A).ROI
                                                                     (D) of
                                                                         Thethedotted
                                                                                 CRP at line indicates
                                                                                           the         the
                                                                                               reticular    second target
                                                                                                         formation         ROI
                                                                                                                      of the     of the CRP
                                                                                                                              medulla    in theinaxial
                                                                                                                                                  Brod-b = 0
                                     mann area 6 on axial b = 0 image. (E) Representative DTT image of CRP in a typical subject with a
                                    image (level c in A). (D) The dotted line indicates the second target ROI of the CRP in Brodmann area
                                     left middle cerebral artery (MCA) infarction (red, unaffected side; yellow, affected side).
                                    6 on axial b = 0 image. (E) Representative DTT image of CRP in a typical subject with a left middle
                                    cerebral artery (MCA) infarction (red, unaffected side; yellow, affected side).
Brain Sci. 2021, 11, 867 5 of 10
Brain Sci. 2021, 11, x FOR PEER REVIEW 5 of 10
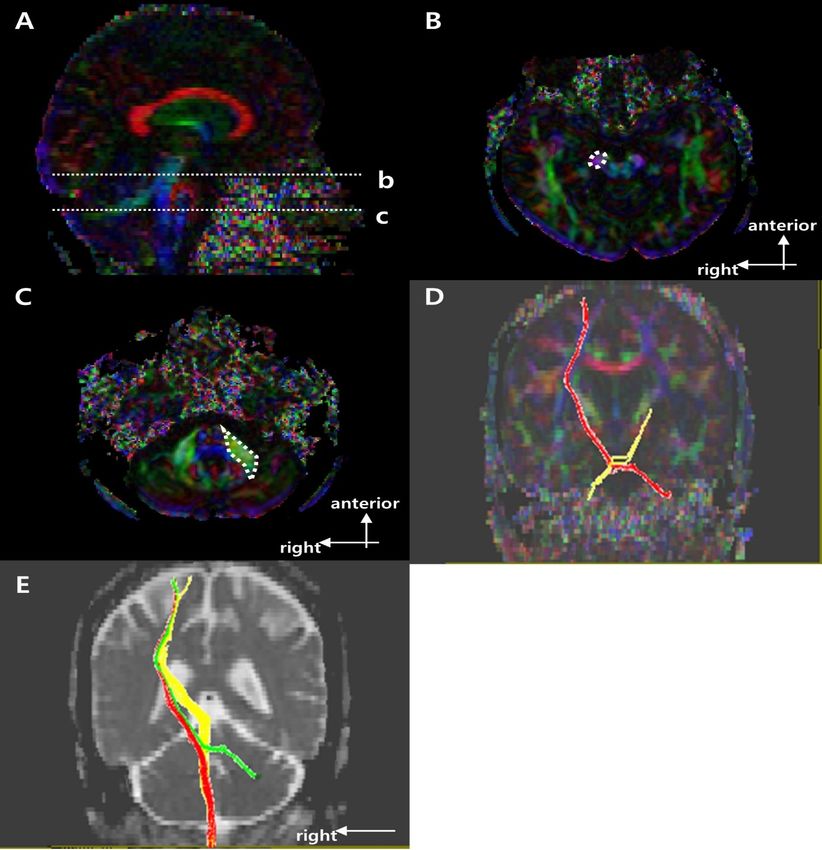
Figure
Figure 3.
3. Regions
Regions ofof interest
interest (ROIs)
(ROIs) used
used toto reconstruct
reconstruct the
the right
right cortico-ponto-cerebellar
cortico-ponto-cerebellar tract tract (CPCT)
(CPCT) on on diffusion
diffusion tensor
tensor
imaging (DTI) and representative diffusion tensor tractography (DTT) images of the CPCT. (A) Sagittal color fractional
imaging (DTI) and representative diffusion tensor tractography (DTT) images of the CPCT. (A) Sagittal color fractional
anisotropy (FA) map with the dotted lines showing the (b) cerebral peduncle and (c) mid pons. (B) The dotted circle
anisotropy (FA) map with the dotted lines showing the (b) cerebral peduncle and (c) mid pons. (B) The dotted circle
indicates the target ROI of the CPCT at the cerebral peduncle in the axial color map (level b in (A)). (C) The dotted polygon
indicates the
indicates the target ROI of
seed ROI of the
the CPCT
CPCT at at the
the cerebral peduncle in
middle cerebellar the axialat
peduncle color
the map
mid (level
pons in b in (A)).
the (C)color
axial The map
dotted polygon
(level c in
indicates
(A)). the seed ROI of DTT
(D) Representative the CPCT
imageatofthe middle
the CPCTcerebellar peduncle
in a typical subject at the amid
with leftpons in the
middle axial color
cerebral arterymap
(MCA)(levelinfarction
c in (A)).
(D) Representative
(red, unaffected side; DTT image
yellow, of the side).
affected CPCT(E) in aRepresentative
typical subjectsuperposing
with a left middle cerebral
DTT image artery
of the right(MCA) infarction
side motor tracts(red,
in a
typical subject
unaffected side;with a leftaffected
yellow, MCA infarction (red, CST; yellow,
side). (E) Representative CRP; green,
superposing DTT CPCT)
imageinofb the
= 0 right
image.side motor tracts in a typical
subject with a left MCA infarction (red, CST; yellow, CRP; green, CPCT) in b = 0 image.Brain Sci. 2021, 11, 867 6 of 10
2.4. Statistical Analysis
FN and FA are presented as the median (interquartile range). Fisher’s exact test was
used to compare the demographics among the groups. When neither the normality of
distribution nor equality of variance assumptions were satisfied, the Kruskal–Wallis test
followed by the Mann–Whitney U test (with the Bonferroni correction) was used to test for
differences among the groups in BBS scores and FAC. For all results, two-tailed p-values ≤
0.0166 were deemed significant. The Wilcoxon signed-rank test was used to analyze the
FAC on 1 and 6 months after stroke onset and to confirm the differences of FN and FA values
for the three tracts (i.e., CST, CRP, and CPCT) between affected and unaffected lesion side
on 1 month after the onset in all subjects. Since the variables were nonparametric groups
and contain an ordinary scale, the correlation of functional assessment scores and DTI
parameter (i.e., FN and FA) was assessed using Kendall’s tau b correlation. Additionally,
the associations between the DTI parameters on 1 month after stroke onset and functional
assessment on 6 month after stroke onset were determined through logistic regression
analyses. All statistical analyses were performed using SPSS for Windows (ver. 21.0; SPSS,
Chicago, IL, USA).
3. Results
Table 1 summarizes the demographic and clinical characteristics of the three groups.
There were no significant group differences in age, gender, stroke type, lesion location,
or affected hemisphere. Figures 1–3 show representative results of diffusion tensor trac-
tography of the CST, CRP, and CPCT. There were significant differences of FN and FA
between affected and unaffected side CST, CRP and CPCT (all p-values < 0.001). Also FAC
on 6 months showed marked improvement compared to that on 1 month. Tables 2–4 shows
the FN and FA data for the CST, CRP, and CPCT by groups based on BBS and FAC scores.
There were no significant associations of FN and FA with balance ability or gait on 1 and
6 months after onset. Only the BBS on 6 month after onset and FA value of CST showed a
low level of correlation, and no other significant correlation of FN and FA with balance or
gait ability 1 and 6 months after onset (Table 5). In logistic regression that included age and
DTI parameters as covariates, there was no significant factor other than age for the balance
or gait ability on 6 month after the stroke onset.
Table 1. Participants’ demographic data.
High Moderate Low
Fall Risk→ p-Value
(0 ≤ BBS ≤ 20) (21 ≤ BBS ≤ 40) (41 ≤ BBS ≤ 56)
Numbers of subjects 6 8 13
Age, years 61.0 (56.3–66.5) 75.5 (62.5–81.0) 63.5 (33.5–73.8) 0.060
Gender 0.090
Female, n (%) 1 (16.7) 6 (75.0) 4 (30.8)
Male, n (%) 5 (83.3) 2 (25.0) 9 (69.2)
Stroke type 0.206
Infarction, n (%) 5 (83.3) 8 (100.0) 9 (69.2)
Hemorrhage, n (%) 1 (16.7) 0 (0.0) 4 (30.8)
Brain injury location 0.778
Cortex, n (%) 0 (0.0) 0 (0.0) 1 (7.7)
Subcortex, n (%) 6 (100.0) 7 (87.5) 12 (92.3)
Mixed, n (%) 0 (0.0) 1 (12.5) 0 (0.0)
Hemispheric lesion 0.889
Left, n (%) 4 (66.7) 4 (50.0) 7 (53.8)
Right, n (%) 2 (33.3) 4 (50.0) 6 (46.2)
K-MBI 23.0 (12.0–34.8) 63.5 (33.5–73.8) 81.0 (77.0–84.0)
Values are the median (interquartile range) or n (%). p-values were calculated using Fisher’s exact test or the
Kruskal–Wallis test, followed by the Mann–Whitney U test with the Bonferroni correction. BBS, Berg Balance
Scale; K-MBI, Korean version of the modified Barthel Index.Brain Sci. 2021, 11, 867 7 of 10
Table 2. FN and FA values for the CST, CRP, and CPCT by groups classified based on the BBS score 6 months after
stroke onset.
High Moderate Low
Fall Risk→ p-Value
(0 ≤ BBS ≤ 20, n = 6) (21 ≤ BBS ≤ 40, n = 8) (41 ≤ BBS ≤ 56, n = 13)
CST FN 0.043 (0.003–0.495) 0.414 (0.362–0.677) 0.392 (0.124–0.546) 0.214
FA 0.644 (0.134–0.898) 0.882 (0.846–0.964) 0.948 (0.862–0.971) 0.058
CRP FN 0.379 (0.275–0.480) 0.280 (0.193–0.636) 0.354 (0.211–0.483) 0.920
FA 0.992 (0.935–1.033) 0.959 (0.940–0.978) 0.962 (0.934–0.977) 0.506
CPCT FN 0.123 (0.018–0.443) 0.052 (0.0–0.465) 0.162 (0.0–0.351) 0.960
FA 0.927 (0.230–0.983) 0.476 (0.0–1.019) 0.915 (0.0–0.965) 0.878
Values are the median (interquartile range). FN and FA were calculated as (affected side value/unaffected side value). p-values were tested
using the Kruskal–Wallis test followed by the Mann–Whitney U test with the Bonferroni correction. BBS, Berg Balance Scale; n, number;
CST, corticospinal tract; CRP, corticoreticular pathway; CPCT, cortico-ponto-cerebellar tract; FA, normalized fractional anisotropy; FN,
normalized fiber number.
Table 3. FN and FA values of CST, CRP, CPCT by group according to the independence of ambulation
via FAC scores on 1 month after the stroke onset.
Nonfunctional Dependent Independent
p-Value
(FAC 0,1, n = 19) (FAC 2,3, n = 6) (FAC 4,5, n = 2)
CST FN 0.406 (0.195–0.571) 0.335 (0.119–0.559) 0.665 (0.389–0.942) 0.870
FA 0.862 (0.788–0.947) 0.962 (0.939–0.986) 0.952 (0.950–0.954) 0.173
CRP FN 0.299 (0.204–0.510) 0.346 (0.303–0.408) 0.348 (0.206–0.491) 0.877
FA 0.977 (0.933–0.988) 0.958 (0.948–0.971) 0.924 (0.919–0.929) 0.330
CPCT FN 0.118 (0.0–0.442) 0.0 (0.0–0.259) 0.289 (0.145–0.434) 0.692
FA 0.952 (0.0–1.003) 0.0 (0.0–0.713) 0.458 (0.229–0.686) 0.331
Values are the median (interquartile range: first–third quartiles), FN and FA are calculated via (affected value/non-
affected value). p-values were tested using Kruskal-Wallis test followed by the Mann-Whitney U-test with the
Bonferroni correction. FAC, Functional Ambulation Categories; n, number; CST, corticospinal tract; CRP, corti-
coreticular pathway; CPCT, corticopontocerebellar tract; FA, normalized fractional anisotropy; FN, normalized
fiber number.
Table 4. FN and FA values of CST, CRP, CPCT by group according to the independence of ambulation
via FAC scores on 6 months after the stroke onset.
Nonfunctional Dependent Independent
p-Value
(FAC 0,1, n = 9) (FAC 2,3, n = 10) (FAC 4,5, n = 8)
CST FN 0.159 (0.014–0.883) 0.410 (0.290–0.513) 0.403 (0.121–0.546) 0.859
FA 0.867 (0.535–0.947) 0.932 (0.836–0.967) 0.905 (0.848–0.953) 0.634
CRP FN 0.299 (0.269–0.485) 0.344 (0.216–0.451) 0.330 (0.174–0.643) 0.998
FA 0.976 (0.922–1.008) 0.971 (0.950–0.981) 0.954 (0.929–0.978) 0.703
CPCT FN 0.073 (0.0–0.533) 0.0 (0.0–0.115) 0.348 (0.121–0.615) 0.163
FA 0.918 (0.0–0.999) 0.0 (0.0–0.962) 0.957 (0.686–1.015) 0.405
Values are the median (interquartile range: first–third quartiles), FN and FA are calculated via (affected value/non-
affected value). p-values were tested using Kruskal-Wallis test followed by the Mann-Whitney U-test with the
Bonferroni correction. FAC, Functional Ambulation Categories; n, number; CST, corticospinal tract; CRP, corti-
coreticular pathway; CPCT, corticopontocerebellar tract; FA, normalized fractional anisotropy; FN, normalized
fiber number.
Table 5. Correlation of DTI parameters and functional assessment scores on 1 month and 6 months
after the stroke onset.
CST CRP CPCT
FN FA FN FA FN FA
BBS on 0.106 0.329 −0.049 −0.138 −0.016 −0.078
6 month 0.497 0.035 0.751 0.375 0.924 0.634
FAC on 0.004 0.285 0.033 −0.214 −0.116 −0.245
1 month 0.979 0.074 0.834 0.181 0.492 0.146
FAC on 0.027 0.121 −0.014 −0.104 0.152 0.091
6 month 0.859 0.436 0.929 0.504 0.351 0.576
FN and FA are calculated via (affected value/non-affected value). Tb -values and p-values were tested using
Kendall’s tau b correlation. DTI, Diffusion Tensor Imaging; BBS, Berg Balance Scale; FAC, Functional Ambulation
Categories; CST, corticospinal tract; CRP, corticoreticular pathway; CPCT, corticopontocerebellar tract; FA,
normalized fractional anisotropy; FN, normalized fiber number.Brain Sci. 2021, 11, 867 8 of 10
4. Discussion
The CSR, CRP, or CPCT at 1 month were not related to the gait and balance outcomes
of patients with stroke at 6 months. The processing of somesthetic graviceptive sensation
plays a critical role in the control of body orientation with respect to gravity, and thus
in gait and balance, along with the motor tracts [24]. Reports suggest that injury to the
insular cortex, postcentral gyrus, and posterior thalamus is associated with poor vertical
posture [25]. A recent study showed that a larger stroke, rather than specific brain lesions,
was more important with respect to the likelihood of restoration of vertical posture, where
multiple sensory and motor systems are involved in the restoration of balance in stroke
patients [26]. Balance function is a whole-brain phenomenon, rather than being associated
with any specific part of the brain [27]. Previous studies, and our results, indicated that
the CST, CRP, and CPCT are not associated with the recovery of gait and balance, just as
no specific lesions affected the recovery of vertical posture [26]. The neuroradiological
findings in the white matter alone did not predict the clinical outcomes in this study.
These findings differ from those of some previous studies. There was a suggestion that
CST independently would predict the response to gait rehabilitation in a study using
the voxel based lesion symptom mapping (VLSM) [28]. Others presented that ipsilateral
CST, CRP, and contra-lateral superior cerebellar peduncle(SCP) as biomarkers for working
recovery [5]. However, our study is somewhat differentiated from those previous studies in
that we targeted patients with various gait functions at the time of enrollment and analyzed
both FN and FA values as DTI parameters.
Because ours was a small study, several statistical methods were used to overcome
bias. We analyzed the subjects longitudinally, i.e., for up to 6 months after stroke onset [29].
We also examined three motor tracts to rule out over-estimation of any one tract analyzed.
However, there were some limitations in our study including the small sample size and
retrospective nature of the study. Also, this study included the inherent limitations from
the functional assessment and diffusion tensor tractography used in this study. There was
significant floor and ceiling effects on BBS despite of its useful properties and it has limited
discriminatory power [16]. Acquisition disturbances or technical restrictions in the process
of tractography should still be considered. A large-scale prospective longitudinal study
using diverse functional assessments and other image tools is needed to address remaining
questions and determine the reasons for the differences in results between previous studies
and our investigation.
5. Conclusions
The integrity of the CST, CRP, and CPCT, as assessed by DTI about 1 month after a
supratentorial first-ever stroke, did not reflect the functional outcome of gait and balance
after 6 months.
Author Contributions: Conceptualization, S.J. and S.L.; methodology, S.J., B.H. and Y.K.; software,
S.J.; validation, B.H. and Y.K.; formal analysis, S.J. and S.L.; investigation, S.J. and S.L.; resources,
S.L.; data curation, S.J. and S.L.; writing—original draft preparation, S.J. and S.L.; writing—review
and editing, S.J. and S.L.; visualization, S.J.; supervision, B.H. and Y.K.; project administration, S.L.;
funding acquisition, S.L. All authors have read and agreed to the published version of the manuscript.
Funding: This work was supported by the National Research Foundation of Korea funded by the
Korean government (No. NRF 2021R1A2C1012113).
Institutional Review Board Statement: The study protocol was approved and review by Institu-
tional Review Board of Catholic University, College of Medicine (Registry No. VC19RISI0265).
Informed Consent Statement: The requirement for informed consent was waived by the board.
Data Availability Statement: The data presented in this study are available on request from the
corresponding author.
Conflicts of Interest: The authors declare no conflict of interest.Brain Sci. 2021, 11, 867 9 of 10
References
1. Takakusaki, K. Neurophysiology of gait: From the spinal cord to the frontal lobe. Mov. Disord. 2013, 28, 1483–1491. [CrossRef]
[PubMed]
2. Alexander, L.D.; Black, S.E.; Patterson, K.K.; Gao, F.; Danells, C.J.; McIlroy, W.E. Association Between Gait Asymmetry and Brain
Lesion Location in Stroke Patients. Stroke 2009, 40, 537–544. [CrossRef]
3. Lee, K.B.; Kim, J.S.; Hong, B.Y.; Lim, S.H. Clinical recovery from stroke lesions and related outcomes. J. Clin. Neurosci. 2017, 37,
79–82. [CrossRef]
4. Lee, K.B.; Kim, J.S.; Hong, B.Y.; Sul, B.; Song, S.; Sung, W.J.; Hwang, B.Y.; Lim, S.H. Brain lesions affecting gait recovery in stroke
patients. Brain Behav. 2017, 7, e00868. [CrossRef] [PubMed]
5. Soulard, J.; Huber, C.; Baillieul, S.; Thuriot, A.; Renard, F.; Broche, B.A.; Krainik, A.; Vuillerme, N.; Jaillard, A.; on behalf of the
ISIS-HERMES Group. Motor tract integrity predicts walking recovery. Neurology 2020, 94, e583–e593. [CrossRef] [PubMed]
6. Schaechter, J.D.; Fricker, Z.P.; Perdue, K.; Helmer, K.G.; Vangel, M.G.; Greve, D.N.; Makris, N. Microstructural status of ipsilesional
and contralesional corticospinal tract correlates with motor skill in chronic stroke patients. Hum. Brain Mapp. 2009, 30, 3461–3474.
[CrossRef] [PubMed]
7. Kim, A.R.; Kim, D.H.; Park, S.Y.; Kyeong, S.; Kim, Y.; Lee, S.-K.; Kim, D.Y. Can the integrity of the corticospinal tract predict the
long-term motor outcome in poststroke hemiplegic patients? NeuroReport 2018, 29, 453–458. [CrossRef] [PubMed]
8. Yoo, Y.J.; Kim, J.W.; Kim, J.S.; Hong, B.Y.; Lee, K.B.; Lim, S.H. Corticospinal Tract Integrity and Long-Term Hand Function
Prognosis in Patients with Stroke. Front. Neurol. 2019, 10, 374. [CrossRef]
9. Jang, S.H.; Lee, S.J. Corticoreticular Tract in the Human Brain: A Mini Review. Front. Neurol. 2019, 10, 1188. [CrossRef]
10. Kim, Y.; Im, S.; Kim, S.-H.; Park, G.-Y. Laterality of cerebellar afferent and efferent pathways in a healthy right-handed population:
A diffusion tensor imaging study. J. Neurosci. Res. 2019, 97, 582–596. [CrossRef]
11. Jang, S.H.; Kwon, H.G. Injury of the cortico-ponto-cerebellar tract in a patient with mild traumatic brain injury. Medicine 2017, 96,
e8749. [CrossRef] [PubMed]
12. Lee, K.B.; Hong, B.Y.; Kim, J.S.; Sul, B.; Yoon, S.C.; Ji, E.-K.; Son, D.B.; Hwang, B.Y.; Lim, S.H. Which brain lesions produce
spasticity? An observational study on 45 stroke patients. PLoS ONE 2019, 14, e0210038. [CrossRef] [PubMed]
13. Fan, Y.-T.; Lin, K.-C.; Liu, H.-L.; Chen, Y.-L.; Wu, C.-Y. Changes in structural integrity are correlated with motor and functional
recovery after post-stroke rehabilitation. Restor. Neurol. Neurosci. 2015, 33, 835–844. [CrossRef] [PubMed]
14. Imura, T.; Nagasawa, Y.; Inagawa, T.; Imada, N.; Izumi, H.; Emoto, K.; Tani, I.; Yamasaki, H.; Ota, Y.; Oki, S.; et al. Prediction of
motor outcomes and activities of daily living function using diffusion tensor tractography in acute hemiparetic stroke patients: A
multi-time-point study. J. Phys. Ther. Sci. 2015, 27, 1383–1386. [CrossRef] [PubMed]
15. Mehrholz, J.; Wagner, K.; Rutte, K.; Meiβner, D.; Pohl, M. Predictive Validity and Responsiveness of the Functional Ambulation
Category in Hemiparetic Patients After Stroke. Arch. Phys. Med. Rehabil. 2007, 88, 1314–1319. [CrossRef]
16. Blum, L.; Korner-Bitensky, N. Usefulness of the Berg Balance Scale in Stroke Rehabilitation: A Systematic Review. Phys. Ther.
2008, 88, 559–566. [CrossRef]
17. Jung, H.Y.; Park, B.K.; Shin, H.S.; Kang, Y.K.; Pyun, S.B.; Paik, N.J.; Kim, S.H.; Kim, T.H.; Han, T.R. Development of the Korean
version of modified barthel index (k-mbi): Multi-center study for subjects with stroke. J. Korean Acad. Rehabil. Med. 2007, 31,
283–297.
18. Lee, Y.; Kim, J.S.; Hong, B.Y.; Park, J.G.; Yoo, J.W.; Lee, K.B.; Kim, T.-W.; Lim, S.H. Determinant of Quality of Life in Patients with
Chronic Cerebral Infarct. Brain Neurorehabilit. 2020, 13, 10–12786. [CrossRef]
19. Binkofski, F.; Seitz, R.J.; Hacklander, T.; Pawelec, D.; Mau, J.; Freund, H.J. Recovery of motor functions following hemipa-retic
stroke: A clinical and magnetic resonance-morphometric study. Cerebrovasc. Dis. 2011, 11, 273–281. [CrossRef]
20. Jiang, H.; van Zijl, P.C.; Kim, J.; Pearlson, G.D.; Mori, S. DtiStudio: Resource program for diffusion tensor computation and fiber
bundle tracking. Comput. Methods Programs Biomed. 2006, 81, 106–116. [CrossRef]
21. Seo, J.; Jang, S. Different Characteristics of the Corticospinal Tract According to the Cerebral Origin: DTI Study. Am. J. Neuroradiol.
2013, 34, 1359–1363. [CrossRef]
22. Son, S.M.; Shin, S.M. Disruption of the Corticoreticular Tract in Pediatric Patients with Trunk Instability: A Diffusion Tensor
Tractography Study. Ann. Rehabil. Med. 2017, 41, 1093–1099. [CrossRef]
23. Jang, S.H.; Kim, K.; Kim, S.H.; Son, S.M.; Jang, W.H.; Kwon, H.G. The relation between motor function of stroke patients and
diffusion tensor imaging findings for the corticospinal tract. Neurosci. Lett. 2014, 572, 1–6. [CrossRef]
24. Perennou, D.A.; Mazibrada, G.; Chauvineau, V.; Greenwood, R.; Rothwell, J.; Gresty, M.A.; Bronstein, A.M. Lateropulsion,
pushing and verticality perception in hemisphere stroke: A causal relationship? Brain 2008, 131, 2401–2413. [CrossRef]
25. Johannsen, L.; Broetz, D.; Naegele, T.; Karnath, H.-O. “Pusher syndrome” following cortical lesions that spare the thalamus. J.
Neurol. 2006, 253, 455–463. [CrossRef]
26. Lee, K.; Yoo, S.; Ji, E.; Hwang, W.; Yoo, Y.; Yoon, M.-J.; Hong, B.; Lim, S. Is Lateropulsion Really Related with a Specific Lesion of
the Brain? Brain Sci. 2021, 11, 354. [CrossRef]
27. Surgent, O.J.; Dadalko, O.I.; Pickett, K.A.; Travers, B.G. Balance and the brain: A review of structural brain correlates of postural
balance and balance training in humans. Gait Posture 2019, 71, 245–252. [CrossRef] [PubMed]Brain Sci. 2021, 11, 867 10 of 10
28. Jones, P.S.; Pomeroy, V.; Wang, J.; Schlaug, G.; Marrapu, S.T.; Geva, S.; Rowe, P.; Chandler, E.; Kerr, A.; Baron, J.; et al. Does stroke
location predict walk speed response to gait rehabilitation? Hum. Brain Mapp. 2016, 37, 689–703. [CrossRef] [PubMed]
29. Lee, K.B.; Lim, S.H.; Kim, K.H.; Kim, K.J.; Kim, Y.R.; Chang, W.N.; Yeom, J.W.; Kim, Y.D.; Hwang, B.Y. Six-month functional
recovery of stroke patients. Int. J. Rehabil. Res. 2015, 38, 173–180. [CrossRef] [PubMed]You can also read