Primary Offer Data
Information Pack for Hockey
←
→
Page content transcription
If your browser does not render page correctly, please read the page content below
Primary Offer Data Information Pack for Hockey
Information Pack for Hockey            1

This pack provides information which you can use in the development of NGB
proposals. Specifically, this information can be used to provide a rationale for
focusing on particular areas and for developing and agreeing interventions in
partnership with Sport England.

The pack provides information on two of Sport England’s key Strategic Outcomes.

      •    Grow

      •    Sustain

Hockey (Field) in summary

      •    141,000 participants    2

      •    79,000 male participants and 63,000 female participants

      •    8,000 participants from ethnic minorities

      •    76,000 participants in employment, 5,000 unemployed, 57,000 students.

      •    11,400 participants have a household income under £15,559

      •    25,000 participants are categorised in groups NS-SEC 5-8 (C2DE), 59,000
                                                                        3

           are from NS SEC 1-4 (ABC1)

      •    There are 6,000 participants in the North East, 14,000 in the North West,
           12,000 in Yorkshire, 15,100 in the West Midlands, 16,000 in the East
           Midlands, 16,100 in the East, 21,000 in the South West, 29,000 in the South
           East and 16,000 in London.

      •    0.25% of all adults, (100,000 adults) would like to play hockey or play more
           often . This represents the equivalent of over half of the people currently
                 4

           playing hockey.

      •    Participation in hockey is predicted to remain stable at 0.3% between 2005
           and 2013 . 5

1
    Participation in Hockey refers to Hockey - Field

2
 All figures from the Active People Survey (2005/06) and ONS mid population 2005 estimates –
participating at least once in the last four weeks

3
 NS-SEC: 1. Higher managerial and professional occupations, 2. Lower managerial and
professional occupations, 3.Intermediate occupations, 4.Small employers and own account
workers, 5. Lower supervisory and technical occupations, 6. Semi-routine occupations, 7.
Routine occupations, 8. Never worked and long-term unemployed, 9. Full time students and
Occupations not stated or inadequately described.

4
    Active People Survey 2, Quarter1 (fieldwork period mid Oct 2007-mid Jan 2008)

                                                                                           1
•   Between Active People Survey 1 (months 1-6) and Active People Survey 2
        (months 1-6) overall participation has not significantly changed. However
        male participation has fallen from 0.56% to 0.45%, a fall of 0.08 percent.
        This represents a change from 107,000 to 92,000, 15,000 less male
        participants .6

    •   95,000, (3%) of young people aged 11-15 participating in hockey regularly               7

5
 Sheffield Hallam: The growth potential of different sport and recreational activities (2007)
unpublished

6
 Active People Survey 1, months 1-6 (fieldwork period mid Oct 2005- mid April 2006), Active
People Survey 2, months 1-6 (fieldwork period mid Oct 2007- mid April 2008)

7
 DCMS Taking Part Young People’s Survey 11-15 year olds (2006/07), taking part at least once
outside of school in the last four weeks

                                                                                                    2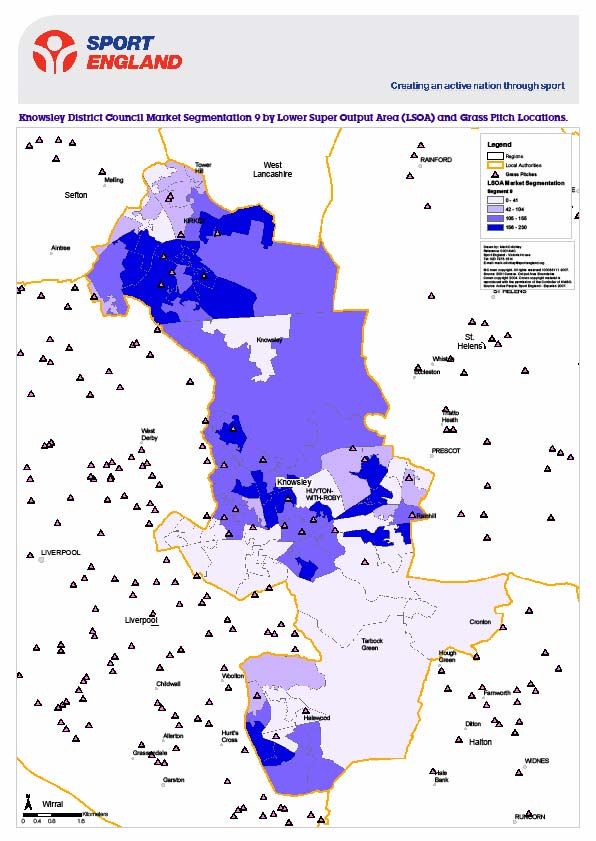
Growth

The information in this section will help you develop growth interventions and help to
understand equality issues in your sport. An understanding of your current market
profile will also help to develop interventions to increase satisfaction in your sport.

Current Participation Profile in Hockey (Field)

This section provides information on your current market profile i.e. the groups that
are currently participating in your sport.

By looking at your market, you can begin to gain an understanding of where
participation growth is more likely to occur. For example, if your current participant
market is made up of 80% 16-19 year olds, it is probably more likely that any
sustained increase in participation will come from that younger group than among
the 65+ age group.

The data also helps to identify inequalities in your sport. By comparing the
demographic breakdowns in your sport, with the demographic breakdown across
all people who play sport, and also the demographic profile of the total England
population, you can gain an understanding of the type of groups which are over (or
under) represented in your sport.

It can also help you think about how you might tackle satisfaction in your sport. For
example, if the majority of your current participants have children, perhaps providing
more family friendly activities could improve satisfaction in your sport.

All data comes from the Active People Survey (2005/6) and refers to participation at
least once in the last four weeks:

   •   0.3% of all adults take part in hockey

   •   2 in 5 (43%) of adult hockey players are under the age of 19, in comparison
       12% of those that take part in any sport or active recreation are in this age
       group

   •   2 in 5 (41%) of adult hockey players are students, compared to 11% of
       those that take part in any sport or active recreation.

   •   There is a reasonably equal gender balance, with slightly more men playing
       hockey than women, similar to the profile for sport overall.

                                                                                       3
This table benchmarks how well your sport is doing in attracting different groups of
the population when compared to the prevalence of those that do any sport, do no
sport and the overall population.
Market share
Not undertaken sport or All
Undertaken sport or active active recreation in last respondent
recreation in last four weeks four weeks (excluding s in Active Hockey
(excluding any walking) any walking) People field
Male 54% 45% 49% 56%
Female 46% 55% 51% 44%
White 91% 91% 91% 94%
Non White 9% 9% 9% 6%
Yes - illness or
disability that limits
activity in some way 8% 22% 16% 4%
No illness or disability
that limits activity in
some way 92% 78% 84% 97%
16-19 year olds 12% 4% 7% 43%
20-24 year olds 10% 5% 7% 14%
25-29 year olds 9% 5% 7% 8%
30-34 year olds 11% 7% 9% 9%
35-44 year olds 22% 17% 19% 15%
45-64 years 24% 32% 29% 10%
65 plus 11% 30% 22% *
children 34% 25% 29% 40%
no children 66% 75% 71% 60%
£0 to £15,559 15% 28% 22% 8%
£15,600 to £20,799 8% 10% 9% 6%
£20,800 to £25,999 7% 7% 7% 6%
£26,000 to £31,199 10% 8% 9% 11%
£31,200 to £36,399 7% 5% 6% 9%
£36,400 to £51,999 15% 8% 11% 16%
£52,000 or more 37% 35% 36% 45%
employed f/t p/t 66% 49% 57% 54%
Unemployed 5% 7% 6% 4%
economically inactive -
retired 13% 31% 23% *
economically inactive -
other 5% 8% 7% *
Student 11% 4% 7% 41%
Other 0% 1% 1% *
NS SEC 1-4 57% 49% 52% 42%
NS SEC 5-8 31% 43% 38% 18%
NS SEC 9 13% 8% 10% 41%
Car or van available in
household 86% 72% 78% 92%
No car or van available
in household 14% 28% 22% 8%
* data not available
49.6
16-19 year olds
14.8 20-24 year olds
44.3 43.0
MALE 25-29 year olds
55.7 FEMALE 30-34 year olds
9.0
35-44 year olds
8.1 45-64 years
14.3
Disabled
Non-Disabled
96.5
40.5 41.9 NS SEC 1-4
NS SEC 5-8
NS SEC 9
17.7
39.9%
no children
children
60.1%
55.7
40.5 employed f/t p/t
Unemployed White
53.8
Student Non White
3.6 94.3
8.1%
6.0%
£0 to £15,559
5.7% £15,600 to £20,799
44.9% £20,800 to £25,999
10.5% £26,000 to £31,199
£31,200 to £36,399
8.6% £36,400 to £51,999
£52,000 or more
16.2%
7.8%
yes car or van
available
no car or van
available
92.2%
6Current Participation Figures in (Field) Hockey
This section uses Active People Survey data (2005/6) to illustrate current
participation (defined as participated at least once in the last four weeks) among
different groups. These participation figures have been translated into numbers of
participants in the introduction.
This provides further information on your current market, inequalities in participation
and has potential impact on satisfaction.
• Individuals from a non white background are half as likely to play hockey.
• Student participation rate is 2%
• The participation rate among 16-19 year olds is 2%
• People with dependent children are also likely to play hockey more than
those who do not have children.
0.6
0.6
0.5 0.5 0.5
0.5 0.5 0.4
0.4
0.4 0.4
0.3
0.3 0.3 0.2
0.3
0.2 0.1
0.2 0.1
0.1 0.0
£0 to £15,600 to £20,800 to £26,000 to £31,200 to £36,400 to £52,000 or
0.0 £15,559 £20,799 £25,999 £31,199 £36,399 £51,999 more
no children children Household incom e
0.5 0.4 0.5
0.4
0.4 0.4
0.4 0.4
0.3
0.3 0.3
0.3 0.3
0.2 0.2
0.2 0.2
0.1
0.1 0.1
0.1 0.1
0.0 0.0
Disabled Non-Disabled MALE FEMALE
72.5
2.0 0.5% 0.4%
2.0
0.4%
0.4%
1.5
0.3%
0.3%
1.0
0.7 0.2%
0.2% 0.1%
0.5 0.4 0.4
0.3
0.1%
0.1
0.1%
0.0
16-19 20-24 25-29 30-34 35-44 45-64 0.0%
yes car or van available no car or van available
Age
1.4 0.4 0.4
1.5
0.4
0.3
1.0 0.2
0.3
0.2
0.5 0.3 0.2
0.2
0.1
0.0 0.1
NS SEC 1-4 NS SEC 5-8 NS SEC 9 0.0
Socio-econom ic classification Whi te Non Whi te
2.5%
2.0%
2.0%
1.5%
1.0%
0.5% 0.3%
0.2%
0.0%
employed f/t p/t Unemployed Student
8Regional Distribution of Participation in Hockey
This section uses Active People Survey data (2005/6) to illustrate the regional
distribution of hockey’s current market and the participation rates (once in the last
four weeks) by region.
• The South West (0.5%) and South East (0.44%) have the highest levels of
participation.
0.60%
0.50%
0.50% 0.44%
0.40% 0.37% 0.35% 0.36%
0.30% 0.30%
0.30% 0.26% 0.26%
0.20%
0.10%
0.00%
r
s
s
on
st
st
t
be
t
st
es
es
nd
nd
Ea
Ea
Ea
nd
m
W
W
la
la
Hu
Lo
h
th
id
id
h
th
ut
or
M
tM
ut
or
d
So
N
So
an
st
N
es
Ea
W
ire
sh
rk
Yo
% of
England % of
population hockey
16+ accounted participation
accounted for by rate in each
population for by each region in Number of
16+ region region hockey participants
North East 2,082,212 5% 4% 0.30% 6,247
North West 5,511,030 14% 10% 0.26% 14,329
Yorkshire and Humber 4,076,520 10% 9% 0.30% 12,230
East Midlands 3,483,554 9% 9% 0.37% 12,889
West Midlands 4,297,365 11% 11% 0.35% 15,041
East 4,466,852 11% 11% 0.36% 16,081
London 6,067,026 15% 11% 0.26% 15,774
South East 6,588,348 16% 20% 0.44% 28,989
South West 4,140,556 10% 15% 0.50% 20,703
9Seasonal Variation in Participation
Using Active People Survey data (2005/6), it is possible to show seasonal
fluctuations in participation in sports. This will help to identify key periods where
demand for your sport is likely to be highest.
Participation in hockey peaks between September and March.
0.6%
0.5%
0.4%
0.3%
0.2%
0.1%
0.0%
Jan Feb Mar Apr May Jun Jul Aug Sep Oct Nov Dec
3x30
24.0%
22.0%
20.0%
18.0%
16.0%
14.0%
12.0%
10.0%
Jan Feb Mar Apr May Jun Jul Aug Sep Oct Nov Dec
3x30
10Growth and Latent Demand
• 0.25% of all adults, 100,000 adults would like to play hockey more or more
often . This represents the equivalent of over half of the people currently
8
playing hockey.
• Participation in hockey is predicted to remain stable at 0.3% between 2005
and 2013 . 9
• Between Active People Survey 1 (months 1-6) and Active People Survey 2
(months 1-6) participation has not significantly changed. However male
participation has fallen from 0.56% to 0.45%, a fall of 0.08 percent. This
represents a change from 107,000 to 92,000, 15,000 less male
participants . 10
8
Active People Survey 2, Quarter1 (fieldwork period mid Oct 2007-mid Jan 2008)
9
Sheffield Hallam: The growth potential of different sport and recreational activities (2007)
unpublished
10
Active People Survey 1, months 1-6 (fieldwork period mid Oct 2005- mid April 2006), Active
People Survey 2, months 1-6 (fieldwork period mid Oct 2007- mid April 2008)
11Market Segmentation
Market segmentation is a powerful tool which provides knowledge and further
information on your existing and potential customers. The sporting segments are
based on research gathered through the Active People and Taking Part surveys.
The segments are built on demographic data identified as impacting on sports
participation and attitudes; this includes gender, age, whether people have children
and socio-economic status.
The segments provide information on the specific sports people take part in, the
motivations behind participation, whether they want to do more sport and the
barriers to participation. In addition, the market segments provide information on:
• Media consumption and most effective methods of communication;
• Health indicators including obesity;
• Participation in wider cultural activities.
As segmentation is underpinned by key socio-demographic variables, the segments
can be geographically quantified and appended to both customer records and the
Electoral Roll. Therefore, every adult in England can have a Sport England segment
appended to them, whilst a market segment profile can be counted at any
geographic level within England down to postcode.
This results in a powerful tool which allows users to understand the segment profile
at local level.
In total 19 distinct sporting segments were identified. The figure below shows the
19 segments in relation to age (along the x axis) and sporting activity levels (3x30
along the y axis with the red line indicating whether the segments activity level fall
above or below the national average of 21% achieving 3x30). The segments are
divided into four “supergroups” based on age. Supergroup A contains mainly 18-
24 year olds, whereas supergroup D contains mainly those aged 65+. This allows
for comparisons between segments of the same age. The segment circle size
represents the proportion of people in that segment across England. So for
example, segment 19 “Elsie and Arnold” are relatively large segments whereas
segment 10 “Paula” represents relatively less people in England. The chart below
outlines the 19 segments and their key characteristics.
www.sportengland.org/research provides much more information about the market
segments including pen portraits, how to use guides, technical documents and
frequently asked questions.
How Market Segmentation can be used in Relation to Sport England’s Strategic
Outcomes
Market segmentation can be used for both the grow and sustain outcomes. In
terms of the Grow outcome, the segments provide knowledge about who your
potential customers are most likely to be, and identifies geographic areas to target.
The attitudes and barriers information will help you to design interventions that
appeal to your customers and the marketing data will help you attract them.
12In terms of the Sustain outcome, the segmentation information will help identify
some of the factors that could help decrease the drop-off in participation and
increase satisfaction. For example, Jamie would do more sport if he had people to
go with and there were better playing facilities available.
Sport England Segmentation
45 Index
> 200
> 150
40 1 > 100
> 75
> 50Market Segments Summary
This provides general information about the 19 Sport England Market Segments
Segment Segment Age Socio 3x30 % Sports Media and Communications Key brands Activity characteristics
name and characteristics econ Eng
description 0x30 Pop
A01 Ben Male recent graduates, 18- ABC1 40% 6.4 Football Ben is a heavy internet user and has a high Ben is well educated and well informed, and is
with a work-hard, play- Golf speed broadband connection at home. He the most likely of his peers to appreciate live
Competitive 25 Cricket
Male hard, drink-hard attitude uses this for sports news, personal emails, music, photography and graphical design,
19% Rugby Un+ Lge
buying films and games and in recent especially if combined with his thirst for the
Urbanites Skateboard
American Ftball months playing online poker. latest gadgets.
A02 Jamie Young blokes enjoying 18- C2DE 32% 5.4 Football Jamie is a prolific mobile user, particularly Jamie is least likely to participate in the
Sports Team football, pints and pool 25 Weight Lifting using sms text alerts and checking out the arts compared to his peers, being not
Drinkers Single, Vocational Pool football scores on his mobile using wap. He particularly interested or finances being
Student 30% has a pay-as-you-go phone, rather than a barrier.
being tied into a monthly contract.
A03 Chloe Young image-conscious 18- ABC1 28% 6.9 Aerobics Chloe is a heavy mobile phone user, Chloe is very likely to participate in the arts,
Fitness Class females keeping fit and 25 Horse Riding keeping in contact with all her friends almost having been encouraged from an early age. She
Friends keeping trim Yoga daily, and probably uses it more than a particularly enjoys crafts, photography and
Single graduate 34% Netball landline. She uses the internet a lot, for dance classes, including those not just for
professional. Trampoline social messaging, booking music tickets, or fitness. It’s a good way to meet new people and
movie information. learn new skills.
A04 Leanne Young busy mums and 18- C2DE 23% 4.7 Aerobics Leanne is a heavy mobile user, for personal Leanne enjoys participating in some arts
Dance Exercise
Supportive their supportive college 25 Netball rather than business use. She regularly texts activities, to meet people and also to take her
Singles mates Body Combat and calls her friends, and is likely to use children. She is the most likely of her peers to
Likely to have children, 44%
Ice Skating pay-as-you-go rather than be tied to a participate in dance classes both for fitness and
Rounders
Student, Pt vocational. Gymnastics monthly contract. general enjoyment, and may also enjoy textile
crafts.
B05 Helena Single professional 26- ABC1 33% 5.0 Aerobics Helena always has her mobile on hand so Helena is the most likely of her peers to
ladies, enjoying life in the Yoga that she is contactable for work and social participate in arts, having been encouraged from
Career 35 Horse Riding
Focused fast lane calls. As a heavy internet user it is her an early age. She enjoys going to museums, art
Pilates
Single, Full time 33% primary source of information on events, galleries and the theatre and also listening to
Female Netball
professional. Hockey holidays and restaurants. live music.
Body Pump
B06 Tim Sporty male 26- ABC1 32% 9.4 Football Tim loves to embrace the latest technology Tim enjoys participating in the arts. He is the
professionals, buying a Golf –the internet is his primary source of most likely of his peers to play a musical
Settling Down 35 Squash
Males house and settling down information, and he is a heavy mobile user instrument, enjoying developing and learning
Cricket
with partner Rugby U
for both personal and business purposes new skills. He may also enjoy photography or
Single/Married, may 27% Shooting use his computer for graphical design,
have children, American Ftball especially if these activities can be combined
professional with his thirst for top of the range gadgets.
B07 Alison Mums with a 36- ABC1 25% 4.6 Aerobics Yoga Alison is a medium TV viewer, watching Alison enjoys participating in the arts including
Stay at Home comfortable, but busy, 45
Horse Riding
mainly children’s programmes but also dance, music, textile crafts and drawing. She 14
Pilates
Mums lifestyle Netball cookery shows and dramas. She enjoys finds it relaxing, likes to take the children and
Married, Housewife, 33% Skiing reading higher-end women’s magazines, the also likes meeting new people at events and
Trampoline
Children Body Pump Telegraph or Times. classes. Alison takes the children to the library
Swimming regularly, and picks up a book for herself also.Market Segments Summary
This provides general information about the 19 Sport England Market Segments
33%
B08 Jackie Mums juggling work, 36- C1C2D 21% 4.0 Aerobics Jackie is a medium TV viewer, enjoying Jackie enjoys participating in the arts, including
family and finance Trampoline soaps, chat shows and dramas. She is a textile crafts, dance, painting and drawing,
Middle 45 Ice Skating
England Married, Part-time skilled cautious internet user, but is being having been encouraged from an early age. She
Rounders
worker, Housewife 47% encouraged by her children’s prolific usage finds these activities relaxing, and also takes the
Mums Step Machine
Children Rollerblading and is becoming more confident herself. children to them.
Swimming
B09 Kev Blokes who enjoy pub 36- DE 19% 5.8 Football Kev is a heavy TV viewer, particularly Kev is generally uninterested in arts
Fishing
Pub League league games and 45 Weight Training favouring ITV and C5. He is also likely to participation, or unable to for health reasons. He
Teamates watching live sport. Snooker have a digital/cable package for live sports was also not particularly encouraged to
Married/Single; may Pool coverage. Kev’s mobile phone is important participate at an early age and is unlikely to
have children; Vocational 51% Darts
for his plumbing business and getting the encourage his children to get involved.
Sea Fishing
Weigh Lifting footy lads organised, his landline is seldom
used.
B10 Paula Single mums with 26- DE 16% 3.8 Aerobics Keep Fit Paula is a heavy TV viewer, enjoying quiz Paula is likely to participate in a few arts
Trampoline
Stretched financial pressures, 35 Ice Skating and chat shows, reality TV and soaps. She activities, perhaps textile crafts or craft and
Single Mums childcare issues and little Step machine is likely to have a digital or cable package design with the kids - these may have been
time for pleasure Rounders and enjoys the extra choice this provides, encouraged from an early age or through her
Single, Job seeker or 61% Rollerblading
particularly the shopping channels. kids’ primary school.
Skipping
part time low skilled
C11 Philip Mid-life professional, 46- ABC1 26% 7.8 Golf Philip is a medium TV viewer, enjoying Having been encouraged from an early age,
Comfortable sporty males with older 55 Football business and current affairs programmes Philip enjoys participating in the arts – he may
Mid-Life Males children and more time Squash and live sports coverage. He is likely to have play a musical instrument, enjoy photography,
for themselves 39% Cricket digital TV and also use interactive TV visit theatres and be an active all rounder.
services for sports and business news.
C12 Elaine Mid-life professionals 46- ABC1 25% 5.3 Yoga Aerobics Elaine is a light TV viewer, choosing Well educated and well informed, Elaine enjoys
Dance Exercise
Empty Nest who have more time for 55 Step Macine programmes that reflect her interests in art participating in the arts, including dance,
Career Ladies themselves since their Skippings or cookery. She uses the internet at home, painting, drawing, textile crafts and reading for
children left home 44% Health and for news and emails but does not have a pleasure.
Fitness
high speed connection.
C13 Roger & Free-time couples 56- ABC1 19% 6.2 Golf Yoga Roger and Joy are medium TV viewers and With more time available to them, Roger and
Keep Fit
Joy nearing the end of their 65 Pilates Bowls heavy radio listeners. They read Joy like to participate in arts such as painting,
Early careers. Aqua Fit newspapers regularly, usually the Times or drawing, sewing and reading – they also use the
Married, retired or part- 54% Tai Chi Daily Telegraph, and also subscribe to some local ‘university of the 3rd age’.
Retirement Sailing Skittles
time. personal interest magazines.
Couples
C14 Brenda Middle aged ladies, 46- C2DE 14% 4.0 Keep Fit Brenda is a medium TV viewer who likes to Although lack of time is a barrier, Brenda is still
working full time to make Aerobics keep up with the soap storylines and the likely to participate in some arts. She may enjoy
Older Working 55 Dance Exercise
Women ends meet latest reality TV show on cable. She also dance classes and also textile crafts.
Step Machine
Single/Married 64% Health + Fit
enjoys reading soap magazines and
May have children Skipping newspapers such as the Mirror or Sun.
Low skilled worker
C15 Terry Generally inactive older 56- DE 12% 3.4 Fishing, Terry is a high TV viewer, both at home and Terry was not encouraged to participate in the
Weight Training
Local Old men, low income, little 65 Snooker/Darts in the pub, particularly enjoying live sports arts at an early age. He has a general lack of
15C16 Norma Older ladies, recently 56- DE 9% 2.0 Keep Fit Norma is a high TV viewer, enjoying quiz Norma enjoys participating in the arts,
Aqua Fit Darts
Late Life retired 65 Dance Exercise shows, chat shows, soaps and religious particularly enjoying reading, textile crafts such
Ladies Single/Married, Low Tai Chi programmes. Most new technology has as knitting, sewing and embroidery, and some
skilled worker, Retired 78% Step Machine passed her by, having no internet access or painting or drawing. She will also regularly visit
Skipping
mobile phone. her local library
D17 Ralph & Retired couples, enjoying 66+ ABC1 14% 3.7 Golf Ralph and Phyllis are medium to light TV Ralph and Phyllis enjoy participating in the arts
Phyllis active and comfortable Bowls viewers, preferring to be out and about – they paint, read for pleasure and may play a
Comfortable lifestyles Keep Fit instead. They like to read the Daily musical instrument. They regularly enjoy visiting
Married, Retired 70% Tennis Telegraph or Independent do not have museums and heritage sites and taking foreign
Retired
Shooting access to the internet, but they have a holidays.
Couples mobile phone
D18 Frank Retired men with some 66+ C1C2D 9% 3.5 Golf Frank is a heavy TV viewer enjoying live Frank has limited participation in arts activities,
Twilight Years pension provision and Bowls sports coverage. He doesn’t have access to having not been particularly encouraged in his
Gent limited exercise Snooker the internet, or a mobile phone. He enjoys early years. However, he does enjoy visiting
opportunities 78% Fishing reading the Daily Mail or Express. heritage sites and museums when given the
Pool opportunity.
D19 Elsie & Retired singles or 66+ DE 5% 8.3 Bowls Yoga Elsie is a heavy TV viewer enjoying old Elsie is keen to participate in the arts,
widowers, predominantly Keep Fit films, and BBC2.Elsie does not have an
Arnold Aerobics
particularly enjoying the dance
Retirement female, living in sheltered internet connection or mobile phone. She afternoon in the community lounge.
Aqua Fit
accommodation will use her landline to call family She loves listening to old music and
Home Singles Tai Chi
Widowed, Retired Dance Exercise having a waltz with other residents.
16How to use Market Segmentation
There are many ways that segmentation can help your organisation attract new
participants and keep them in your sport. The knowledge provided by
segmentation, and in particular the information included in the pen portraits, can
assist you in:
• Offering programmes and services which customers want and need;
• Determining how to market to, and communicate with customers and
potential customers;
• Developing approaches to marketing and communication;
• Developing new markets, securing and retaining new customers;
Identifying Segments to Target
For each segment we are able to tell the likelihood of taking part in a particular
sport. This is possible through creating an index system which allows you to
compare how distant the behaviour or an attitude of a particular segment is, from
the mean. An index of 100 shows average representation in the English adult
population, above 100 shows over representation and below 100 shows under
representation. For example Ben’s index for recreational cycling is 210, this means
he is more likely to cycle than the average. His index for doing any voluntary work in
the last 12 months is 98, so Ben is not more or less likely than the English average
to volunteer. His index for netball is 4, so he is much less likely than the average to
play netball.
Through the index system it is possible to identify which segments are most likely to
take part in particular sports. Once these segments have been established, the
segment profiles can help organisations to design interventions which are more
likely to succeed in attracting new participants. Knowing who your existing
segments are can also help in increasing satisfaction, by providing information on
what matters to your customers.
Which segments are most likely to take part in hockey?
• Most likely to play hockey is Ben (index of 461), 1.1% of Bens play hockey
• Second most likely to play hockey is Chloe (index 360), 0.9% of Chloe’s play
hockey
• Leanne, Tim, Helena and Jamie are also much more likely to play hockey
(indexes of 276, 228, 223 and 188 respectively, % that play golf 0.7%,
0.6%, 0.5%, 0.5%)
• If females were a target group, Chloe is the female segment most likely to
respond to hockey programmes and to be your current customer
• If you were to target segments from lower socio economic groups, Leanne
and Jamie are the segments most likely to take part
17• If you were to target segments with higher proportions of black and ethnic
minorities, you would target Leanne and Jamie
The chart below shows the proportion of hockey accounted for by different
segments.
• Ben accounts for over 1 in 5 of all hockey players, another third are
represented by Tim and Chloe
• The proportion of Hockey’s market accounted for by Tim is still slightly
higher than the combined number of Group B females: Helena, Alison,
Jackie and Paula
Hockey
25
20
15
%
10
5
0
oe
a
v
y
r ry
n
d
is
n
il ip
Ke
Jo
en
Be
l
iso
yll
no
l
Te
Ch
Ph
l
Ph
nd
He
Al
Ar
ra
d
d
an
an
ge
ph
sie
Ro
l
El
Ra
Knowing Where Your Customers Are
Once target segments have been identified, the geographic function of market
segmentation means it is possible to identify where these segments are located.
The tables below show the percentage and number of adults for the two segments
most likely to take part in your sport broken down by CSP area.
• For example, in terms of actual population, both Hampshire and London
South have high numbers of Bens. Hampshire has 105,000 Bens and
London South has 95,000, whilst counties within the North East have
relatively low numbers of individuals fitting these groups.
• In terms of proportional population within an area, London South and Surrey
have the highest levels of numbers fitting these segments, whilst again the
North East and London East have relatively low levels of population.
These tables can help inform where investment can be targeted. For example, you
may want to target areas where there are higher numbers of the segments that you
know are more likely to play your sport.
18Sport England has produced maps for each of the segments at national, regional,
CSP/County Council and Local Authority level. So for example, if on the basis of the
table below you decide to work in Sussex and target Bens, you can explore a map
of Sussex to identify where there are high concentrations of Bens, and prioritise
localised areas to work with. These maps are already available, as part of the
secondary offer support through the Sport England Research Team.
If you wish to look at even smaller geographic areas, segmentation profiles are
available down to super output area (geographic areas of approximately 1,500
people).
Through Experian Business Strategies, it is also possible to analyse your existing
membership base by sporting segments. For example, are you attracting Leannes,
and are you attracting more or less than you would expect in relation to your
potential client base. There is a small cost implication to this, please speak to your
Sport England contact for more details
It is also possible to look at how likely areas are to take part in particular sports,
rather than looking at all 19 segments separately.
Examples of some of these maps are provided below. Further information is
available through the Engagement Teams and from the Sport England Research
team.
19Ben
% of adult population
population number in
16+ thousands
Hampshire and the Isle of Wight 7.4% 105
Greater Manchester 5.2% 102
London South 9.1% 95
Essex 7.1% 92
Sussex 7.6% 92
Kent 7.3% 91
West Yorkshire 5.4% 88
Surrey 10.1% 86
London Central 6.7% 82
London West 7.0% 78
Hertfordshire 8.4% 69
London East 4.4% 67
Lancashire 5.8% 66
West of England Sports Trust 7.5% 59
London North 7.1% 57
Berkshire 8.8% 56
Devon 6.4% 56
Warwickshire 6.8% 54
Cheshire 6.7% 53
Merseyside 4.8% 51
Leicestershire 6.8% 50
Staffordshire 5.9% 50
South Yorkshire 4.6% 47
Buckinghamshire 8.6% 46
Derbyshire 5.9% 45
North Yorkshire 7.3% 45
Nottinghamshire 5.5% 45
Hereford and Worcester 7.2% 42
Cambridgeshire 7.2% 41
Oxfordshire 8.4% 41
Norfolk 6.1% 40
Dorset 6.9% 39
Humber 5.3% 37
Black Country 4.3% 36
Wiltshire 7.3% 36
Suffolk 6.5% 35
Gloucestershire 7.2% 33
Lincolnshire 6.3% 33
Northamptonshire 6.6% 33
Tyne and Wear 3.8% 33
Birmingham 4.0% 30
Bedfordshire 6.6% 29
Somerset 6.9% 28
Cornwall 6.6% 27
Shropshire 6.7% 24
Cumbria 5.9% 23
Durham 4.3% 20
Tees Valley 4.8% 20
Northumberland 5.5% 14
20Chloe
% of adult population
population number in
16+ thousands
London Central 9.6% 118
London South 11.3% 118
Hampshire and the Isle of Wight 8.1% 116
Surrey 12.8% 109
Sussex 8.7% 106
Essex 7.8% 101
Kent 7.7% 97
Greater Manchester 4.7% 91
London West 7.6% 85
West Yorkshire 5.2% 84
Hertfordshire 9.7% 80
Berkshire 10.5% 66
London North 8.2% 66
West of England Sports Trust 8.0% 63
London East 4.0% 61
Cheshire 7.5% 59
Lancashire 5.3% 59
Buckinghamshire 10.8% 58
Devon 6.6% 58
Warwickshire 7.0% 56
Leicestershire 7.1% 52
North Yorkshire 8.5% 52
Oxfordshire 10.5% 51
Staffordshire 5.9% 50
Hereford and Worcester 8.4% 48
Cambridgeshire 8.1% 46
Merseyside 4.2% 46
Nottinghamshire 5.6% 46
Derbyshire 5.6% 43
Dorset 7.3% 42
Norfolk 6.4% 42
South Yorkshire 4.1% 42
Wiltshire 8.3% 40
Gloucestershire 8.2% 37
Northamptonshire 7.4% 37
Lincolnshire 6.9% 36
Humber 5.1% 35
Suffolk 6.6% 35
Bedfordshire 7.0% 31
Black Country 3.5% 30
Somerset 7.4% 30
Birmingham 3.7% 28
Cornwall 6.9% 28
Tyne and Wear 3.2% 27
Shropshire 7.4% 26
Cumbria 5.7% 23
Tees Valley 4.1% 18
Durham 3.6% 17
Northumberland 5.5% 14
2122
23
24
Sustain

This section provides information which will be particularly useful for the Sustain
outcomes; reducing the drop off in sports participation among 16-18 year olds and
increasing the proportion of people that are satisfied with their sporting experience.

Young People’s Participation

Understanding the participation profile among 11-15 year olds in your sport will help
to identify which groups you will most likely to be working with 16 year olds.

The following data is from an analysis of the Taking Part Young People’s Survey
which covers cultural and sporting behaviour for 11-15 year olds.

     •     95,000, (3%) of young people aged 11-15 participating in hockey regularly        11

     •     There appears a slightly higher proportion of men aged 11-15 playing
           hockey, just as there are at adult levels.

     The figure below shows how many young people are playing hockey.

     Female                          2.87

         Male                                                                 3.10

         Total                                           2.99

             2.75   2.80      2.85     2.90    2.95      3.00      3.05     3.10     3.15

                                     male      female      total
                      age            thousands
                      Total          51.0      44.6        95.6

11
  DCMS Taking Part Young People’s Survey 11-15 year olds (2006/07), taking part at least
once outside of school in the last four weeks

                                                                                            25
Drop-off in Participation
This section provides information on drop-off in participation in your sport,
concentrating on 16-22 year olds. This data could be used to help you identify
particular age groups you may want to work with and can be used to inform
proposals.
Key drop off ages in Hockey 16+
• Between 16-17 year olds there is a 33% drop in participation, with hockey
losing 7,000 participants. This could be related to the end of compulsory
education
• By 18 there are half as many hockey players as there were at 16
• If the participation rate was stable at 3% from 16-22, there would be
approximately 75,000 more participants in hockey.
• At 16, more females (3.7%) are playing hockey then males (2.6%). The drop
off in female participation between the ages of 16 and 18 is pronounced
than the drop off in male participation. Between the ages of 16 and 17, 1 in
2 females, 50%, stop playing whereas for males this figure is 1 in 5, 20%.
Between 16 and 18 the 60% of females have stopped playing compared to
50% of males.
Number of Cumulative
participation participants decrease year on
age rate (thousands) year thousands)
Hockey
16 3.0% 20 0
17 2.0% 13 -7
18 1.4% 9 -11
19 1.2% 8 -12
20 0.8% 5 -15
21 0.9% 6 -14
22 0.7% 4 -16
accumulative change 16-22 -75
At 17, there are 1 in 3 less participants
By 18 there are half as many hockey players as at 16.
By 20, participation rate in hockey is below 1%.
263.5%
3.0%
L e ve ls of pa rtic ipa tion 2.5%
2.0%
1.5%
1.0%
0.5%
0.0%
16 17 18 19 20 21 22 23 24
Age
4.0%
3.5%
3.0%
2.5%
2.0%
1.5%
1.0%
0.5%
0.0%
16 17 18
male female
27Reach of Organised Sport
Using Taking Part Survey data (2005), it is possible to explore the reach of
organised activity into individual sports. By looking at tuition, club membership and
competition separately, we can gain an understanding of what proportion of
participants a NGB is likely to be already working with and where perhaps there is
scope for widening the reach of organised sport.
If the proportions initially look low this is because anyone who took part in your
sport in the last 12 months, were asked to respond to this question, so it includes
those who take part in your sport in the most informal manner. If data is not
available for one of the three areas, competition, club and tuition; you can assume
that the proportion taking part in this area in your sport is relatively small. (Data is
excluded if the number of people answering positively to that question is less than
30).
320,000, 0.8% of all adults have taken part in hockey in the last 12 months
The reach of organised sport in hockey is much higher than in many other sports.
Approximately a third of all hockey players have received coaching or tuition or
played in competitive sport. Approximately 3 in 10 for both, whilst 2 in 10 are also
members in sport clubs to play hockey.
B C
% of those that do
Total number the sport in the last
receiving tuition 12 months who
(thousands) receive tuition
Hockey 92 29.0%
% of those that do
the sport in the last
Total number in 12 months who
organised have taken part in
competition organised
(thousands) competition
Hockey 88 27.4%
those that do the
sport in the last 12
months who have
Total number had club
member of a club membership in the
(thousands) last four weeks
Hockey 69 21.7%
28Satisfaction
In the absence of sport-specific satisfaction measures and baselines, Sport England
is able to provide information from qualitative research which provides some
indications of the type of issues that impact on satisfaction.
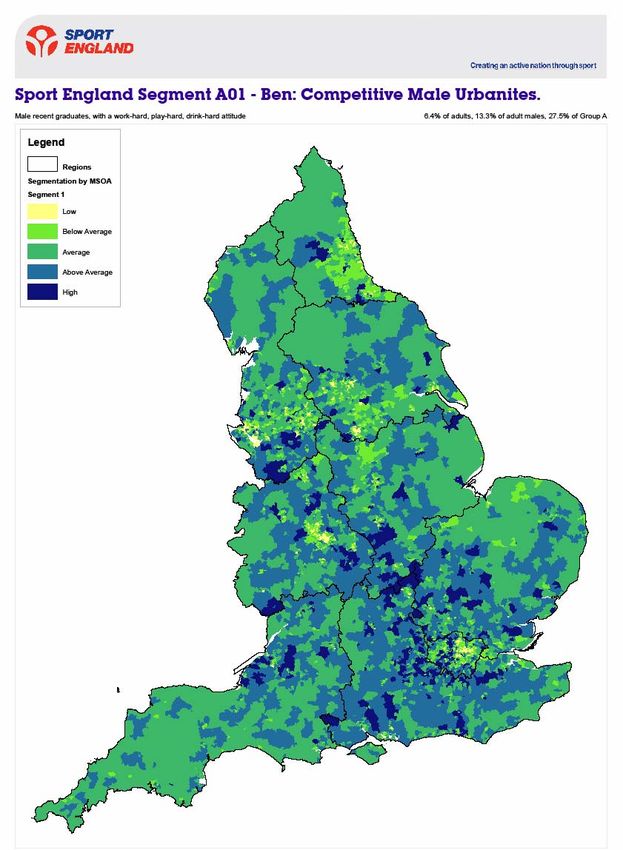
Henley Centre Headlight Vision (January 2008) found that current participants are
fundamentally “satisfied” with their sporting experience. If they were not they would
not be taking part. Sports existing customers are the converted and already feel
that they are enjoying the right “conditions”. As such, perceptions of what makes a
good experience, are centred mainly on emotional and subjective issues, rather
than facilities and tangibles. The figure below demonstrates the key components
which affect satisfaction. While there is some variation across sports these are
nuanced rather than fundamental. The main drivers to satisfaction are intrinsic
(these drivers are highlighted in pink).
ENJOYMENT PER SE
Emotional and Functional drivers
introspective PERFORMANCE
drivers are to SERVICE / HYGIENE
the fore Functional,
EXERTION / FITNESS
tangible
ORGANISATION pointers are
DIVERSION / RELEASE generally
more
COACHING recessive!
SOCIAL / BELONGING
Source: Henley Centre HeadlightVision (2008)
Do These Factors Differ Across Sports?
The emotional and service/hygiene drivers are common to all sports and the
remaining three drivers (coaching, organisation and social/belonging) a result of
particular types of sport (see figure below).
As a team sport social aspects and belonging will have an important bearing on an
individual’s satisfaction factor in hockey as will organisation. A number of players are
likely to find coaching and facilities an important element as hockey is largely a
facility based sport based around competition. Though obviously individuals will
have different key drivers in satisfaction, playing Sunday or tournament mixed
hockey may have more of a focus towards social/belonging whilst league hockey
satisfaction may have more dependence on performance.
29Team
ORGANISATION
SOCIAL /
BELONGING
ENJOYMENT PER SE COMMON TO
ALL SPORTS
Informal Organised
EXERTION / FITNESS PERFORMANCE
COACHING*
DIVERSION / RELEASE SERVICE / HYGIENE*
Solo
Source: Henley Centre HeadlightVision (2008)
30You can also read