STOCK ASSESSMENT OF NAFO SUBDIVISION 3PS COD
←
→
Page content transcription
If your browser does not render page correctly, please read the page content below
Canadian Science Advisory Secretariat
Newfoundland and Labrador Region Science Advisory Report 2019/009
STOCK ASSESSMENT OF NAFO SUBDIVISION 3PS COD
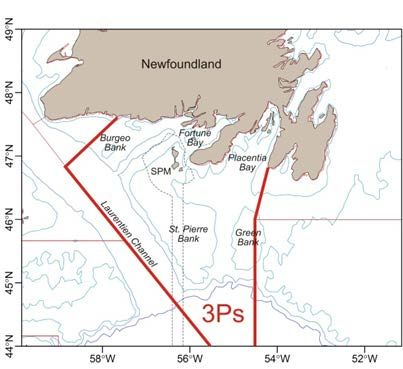
Image: Gadus morhua.
Figure 1: Subdivision 3Ps management area and
economic zone around the French islands of
St. Pierre et Miquelon (SPM) (dashed line).
Context:
In the Northwest Atlantic, cod are distributed from Greenland to Cape Hatteras and are managed as
12 stocks. The Northwest Atlantic Fisheries Organization (NAFO) Subdivision 3Ps stock off southern
Newfoundland extends from Cape St. Mary’s to just west of Burgeo Bank, and over St. Pierre Bank and
most of Green Bank (Fig. 1).
The distribution of 3Ps cod does not conform well to management boundaries and the stock is
considered a complex mixture of inshore and offshore sub-components. These may include fish that
move seasonally between adjacent areas as well as fish that migrate seasonally between inshore and
offshore. The extent to which the different components contribute to the fisheries is not fully understood.
Female cod from this stock have generally matured at younger ages since the mid-1990s. About 50%
of the females are mature by age 5 (~47 cm) in these more recent cohorts, compared to only about
10% at age 5 (~55 cm) among cohorts present in the 1970s-1980s.
Catches from this stock have supported an inshore fixed gear fishery for centuries and are of vital
importance to the area. Fish are caught offshore by mobile and fixed gear, and inshore by fixed gear
only. Spanish and other non-Canadian fleets heavily exploited the stock in the 1960s and early 1970s.
French catches increased in the offshore throughout the 1980s. A moratorium on fishing initiated in
August, 1993 ended in 1997 with a quota set at 10,000 t. Beginning in 2000, the management year was
changed to begin on 1 April. The Total Allowable Catch (TAC) for the 2017-18 management year was
set at 6,500 t. Under the terms of a 1994 Canada-France agreement, Canada holds 84.4% of the TAC,
while the remainder (15.6%) is held by France (St. Pierre et Miquelon).
The present assessment is the result of a request for science advice from the Fisheries Management
Branch (Newfoundland and Labrador [NL] Region). The main objectives were to evaluate the status of
the stock and to provide scientific advice concerning conservation outcomes related to various fishery
management options.
February 2019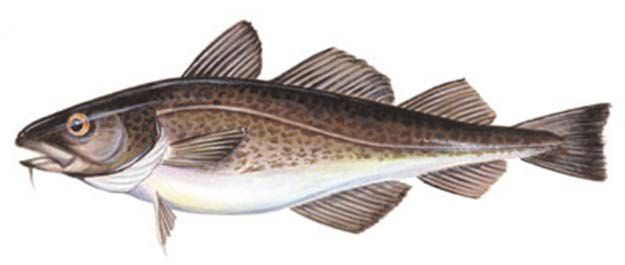
Newfoundland and Labrador Region                                Stock Assessment of 3Ps Cod

    This Science Advisory Report is from the October 16-17, 2018 Assessment of NAFO Subdivision 3Ps
    Atlantic Cod. Additional publications from this meeting will be posted on the Fisheries and Oceans
    Canada (DFO) Science Advisory Schedule as they become available.

SUMMARY
•     Consistent with recent assessments, a cohort model (SURBA) based on the spring DFO
      survey was used to infer overall stock trends.
•     The 2018 Spawning Stock Biomass (SSB) is estimated to be in the Cautious Zone (49%
      above Blim ) as defined by the DFO Precautionary Approach (PA) Framework. The probability
      that the stock is in the critical zone is 0.04.
•     SSB has increased since 2015. In 2018, 71% of the SSB is comprised of ages 6 and 7.
•     Recruitment has generally been at or above the time-series average since 2005, with a
      particularly strong cohort produced in 2011.
•     Estimated total mortality remains high. Over 2015-17, total mortality averaged 0.61 (54%
      survival per year), however the relative contributions of natural and fishing mortality to total
      mortality are unknown.
•     Projection of the stock to 2021 was conducted assuming total mortality rates will be within
      +/- 20% of current values (2015 to 2017 average). All projections show SSB in 2021 to be
      lower than SSB in 2018. Where total mortality is assumed to remain at or above current
      levels, projections indicate that SSB in 2020 and 2021 to be at or below Blim .
•     The ecosystem in Subdivision 3Ps remains under reduced productivity conditions. Spring
      bloom magnitude and zooplankton biomass have shown very low levels since 2014, which
      would negatively impact transfer of energy to higher trophic levels. However, there are some
      improvements in biological indicators for cod in 2018 (e.g. condition and diet).

INTRODUCTION
Oceanography and Ecosystem Overview
Oceanographic conditions in Subdivision 3Ps are influenced by several factors, including local
atmospheric climate conditions, advection by the Labrador Current from the east and the
warmer and saltier Gulf Stream waters from the south as well as the complex bottom
topography in the region. Near bottom temperatures, while showing significant variability from
one year to the next, have experienced a general warming trend up to 1.5°C in some areas
since 1990.
Satellite remote sensing data indicate that the spring bloom in 3Ps was lower in intensity and
magnitude during 2015-18, but the timing of peak magnitude and duration were near normal in
2018. The biomass of both small and large size fractions of zooplankton in 3Ps continue to
remain near the lowest levels observed in the 19-year time series. Reductions in standing
stocks of phytoplankton and zooplankton observed in recent years indicate changes in the
structure of the ecosystem and lower productivity conditions that may influence higher trophic
levels.
The overall biomass of the fish community in 3Ps has been relatively stable since the
mid-1990s, but there were clear internal changes in the fish community with signals of reduced
productivity in the 2010s. Ongoing warming trends, together with an increased dominance of
warm water species and reduced fish sizes across many fish functional groups, indicate that this

                                                    2
Newfoundland and Labrador Region Stock Assessment of 3Ps Cod
ecosystem is undergoing structural changes. Although there are some positive indicators for
cod (e.g. improvement in biomass and more fish in the diet), these signals are not widespread
nor fully consistent across the fish community. The ecosystem still remains under reduced
productivity conditions.
History of the Fishery
The stock was heavily exploited in the 1960s and early-1970s by non-Canadian fleets, mainly
from Spain, with catches peaking at 87,000 t in 1961 (Fig. 2).
After the extension of jurisdiction in 1977, landings increased to peak at almost 59,000 t in 1987
due to increased landings by France. Landings then decreased sharply to about 40,000 t during
1988-91 before decreasing further to 36,000 t in 1992.
A moratorium was imposed in August, 1993 and at that time 15,000 t of the 20,000 TAC had
been landed. Although offshore landings fluctuated, the inshore fixed gear fishery reported
landings around 20,000 t each year until the moratorium.
The fishery reopened in May, 1997 with a TAC of 10,000 t, increasing to 30,000 t by 1999. In
2000 the management year was changed to begin on 1 April. Total Allowable Catches and
landings over the past decade are shown in Table 1 and are described in detail below. The TAC
was set at 6,500 t for the 2017-18 management year and at 5,980 t for the 2018-19
management year.
Figure 2: Reported annual landings and TACs (t) from 1959-2018. Values are based on calendar year
from 1959-2000 and on management year (1 April-31 March) since then. Landings for 2018 (2018-19
season) are incomplete and not displayed.
3Newfoundland and Labrador Region Stock Assessment of 3Ps Cod
Landings
Table 1: TAC and landings by management year (thousand metric tons).
Management
09-10 10-11 11-12 12-13 13-14 14-15 15-16 16-17 17-18 18-191,2
Year
TAC3 11.5 11.5 11.5 11.5 11.5 13.225 13.49 13.043 6.5 5.98
Canada 7.5 6.6 5.2 4.0 4.6 5.8 5.9 5.2 4.9 2.3
France 1.5 1.3 1.1 0.8 1.4 1.6 0.9 1.1 0.2
Totals 9.0 7.8 6.3 4.8 6.0 7.3 6.8 6.3 5.0 2.3
1
Provisional.
2
Approximate landings to 5 October, 2018.
3
TAC is shared between Canada (84.4%) and France (St. Pierre et Miquelon; 15.6%).
Reported combined landings by Canada and France were substantially below the TAC from the
2009-10 season to 2016-17, but during the 2017-18 season, approximately three quarters
(77%) of the 6,500 t TAC was landed. Prior to 2009-10, the TAC had been almost fully
subscribed with the exception of the initial four years of TAC regulation. Industry participants
have indicated multiple reasons contributing to the recent reduction in landings, including
reduced cod availability and economic factors. Of the 5,031 t landed during the 2017-18 season,
4,862 t was taken by Canada (including 13 t from sentinel surveys), and 169 t was landed by
France.
Provisional data indicate that landings during the ongoing 2018-19 management year were
2,252 t as of 5 October, 2018. Although incomplete, these landings to date are comparable to
those during the same period in 2017-18 when a slightly higher TAC of 6,500 t was not taken.
During the 2017-18 season, more than three-quarters of the total landings were taken by fixed
gears (dominated by gillnet) with the remainder taken by the otter trawl fleet.
Species Biology
Stock structure and migration patterns of 3Ps cod are complex. Cod in 3Ps mix with adjacent
stocks at the margins of the stock boundary. Some offshore components of the stock migrate
seasonally to inshore areas, and there are inshore components that are shoreward of the spring
DFO Research Vessel (RV) trawl survey area. These features add uncertainty to the
assessment of stock status. However, since 1994, additional information has been obtained
from various sources, including tagging, acoustic telemetry, and the sentinel fishery. This
information has provided a basis for several measures to investigate the potential impact of
these factors (i.e., stock structure and migration patterns) on the assessment. Survey timing
was shifted to April (beginning in 1993) and winter fishery closures in some areas have been
imposed to reduce the potential for migrant non-3Ps cod being sampled by surveys and
included in commercial catches. The spring DFO RV trawl survey covers most of the stock so
survey trends are thought to broadly reflect stock trends.
Spawning is spatially widespread in 3Ps, occurring close to shore as well as on Burgeo Bank,
St. Pierre Bank, and in the Halibut Channel. Timing of spawning is variable and extremely
protracted, with spawning fish present from March until August in Placentia Bay. Detailed
examination of fish collected from Halibut Channel (southern portion of 3Ps) in March and April
of 2015 and 2016 suggested that spawning in this area began in April. Also, it was noted that for
these fish, all females initially categorized as spent were in fact likely skipping spawning;
therefore, previous estimates of spawning time may be biased and estimated to be earlier than
actual spawning times.
Maturation in female cod was estimated by cohort. The proportion of female cod maturing at
ages 4-6 is higher for all cohorts subsequent to the 1985 cohort. The reasons for the change
4Newfoundland and Labrador Region Stock Assessment of 3Ps Cod toward earlier age at maturity are not fully understood but may have a genetic component that is partly a response to high levels of mortality including fishing. Males generally mature about one year younger than females but show a similar trend over time. Growth, calculated from length-at-age in research trawl survey samples, has varied over time. For cod older than age 3 there was a general decline in length-at-age from the early 1980s to the mid-1990s. For most ages there was an increase in length-at-age from the mid-1990s through the mid-2000s, followed by a period of lower length-at-age in recent years. Length-at- age during 2013-17 was among the lowest in the time series. During 2018, an increase in length at age was observed for most ages. Condition (or condition factor) is a measure of fish weight relative to length and is considered a proxy for energy reserves. Comparison of post-1992 condition with that observed during 1985-92 is difficult because survey timing has changed. Condition varies seasonally and tends to decline during winter and early spring. There were signs of improved fish condition during 2008-13, but condition values for 2014-17 subsequently declined and were among the lowest in the time series. In 2018, condition returned to average values. Similarly, most estimates of condition from sentinel sampling increased in 2018. ASSESSMENT Resource Status Sources of Information A cohort model (SURBA) based on abundance indices from Canadian RV trawl surveys (1972-2018) is used to infer overall stock trends (Cadigan 2010). This model can only use a single index of stock abundance. Although additional sources of information are presented (see “Other Data Sources” below), only the RV survey data was selected as the input data for the model because it is collected with a standardized design over most of the stock area and is thought to best reflect overall trends in the stock. Research Vessel Surveys Canadian DFO RV bottom trawl surveys have been conducted in 3Ps since 1972, however, surveys from 1972-82 had poor coverage. The surveyed area was increased by 18% by the addition of strata closer to shore in 1994 and 1997. The survey was not completed in 2006. Survey indices based on strata
Newfoundland and Labrador Region                                  Stock Assessment of 3Ps Cod

Figure 3: RV survey biomass indices (t).Error bars are ± one standard deviation for combined survey
index–dashed line is the time series average of the combined survey index.

The offshore DFO RV abundance index is variable, but values during the 1990s were generally
lower than those from the 1980s (Fig. 4). Abundance was low during the 2000s but somewhat
higher over 2010-15 with four of the six years being at or above average. In particular, the 2013
estimate was very high with a high measure of uncertainty. In 2018, abundance levels were
below the 1997-2017 average, similar to those observed in 2017 and during the 2000s.

Figure 4: Research vessel survey abundance indices. Error bars are ± one standard deviation for
combined survey, dashed line is average of combined survey index.

    Age Composition
Catches during the 2018 RV survey consisted mainly of cod aged 2-6 (78% of abundance
index). The 2011 (age 7 in 2018) and 2012 (age 6 in 2018) year classes remain strong. The
abundance of cod older than age 7 is relatively low.

                                                   6
Newfoundland and Labrador Region Stock Assessment of 3Ps Cod
Reference Points
The Limit Reference Point (LRP) for this stock is BRecovery, the lowest observed spawning stock
biomass (SSB) from which there has been a sustained recovery. The 1994 value of SSB based
on the SURBA analysis has been identified as the LRP. The Upper Stock Reference (USR) has
been defined (by fisheries managers) as two times the LRP. Mortality reference points have not
been identified for this stock.
Spawning Biomass
Cohort analyses of the RV data indicated that SSB declined by 58% over 2004-09 (Fig. 5).
Median SSB was estimated to be just below the LRP in 2009. SSB increased considerably over
2009-12 but declined to 20% above Blim by 2015. SSB has increased since 2015. The 2018
SSB is estimated to be in the Cautious Zone (49% above Blim ) as defined by the DFO
Precautionary Approach (PA) Framework. Estimates of the uncertainty of the 2018 SSB indicate
that the probability that the stock is in the critical zone is 0.04. Very low numbers of older
(ages 8+) fish in the population combined with the presence of the strong 2011 and 2012 year
classes resulted in over seventy percent of the 2018 SSB being made up of 6-7 year old fish.
These year-classes are expected to experience high mortality rates over the next few years.
Figure 5: Cohort analysis estimates of SSB, relative to the Blim value (median estimate with 95%
confidence interval). The lower dashed line at one (reference level) represents the SSB Limit Reference
Point and the upper horizontal dashed line at two represents the Upper Stock Reference (i.e., 2 x LRP).
These reference points represent the boundaries between the zones of DFO’s precautionary approach
framework, as indicated on the right axis. Text label indicates the current SSB relative to the LRP.
Mortality Rates
Total mortality rates reflect mortality due to all causes, including fishing. Generally, estimated
total mortality for ages 5-10 from the cohort model (Fig. 6) has been increasing since 1997, but
slightly lower values were observed in 2016 and 2017. This decline was due to the large
number of age 5-6 and 6-7 fish in 2017 and 2018 respectively, which have lower mortality rates
compared to older individuals. Over 2015-17, the total mortality rate averaged 0.61 (equivalent
to 54% per year). This is very high considering that landings have been between one half and
three quarters of the TACs over this time period. The current age structure indicates that fish in
7Newfoundland and Labrador Region Stock Assessment of 3Ps Cod
this population are not surviving to older ages and the extent to which this might be related to
early age at first maturity is not certain.
Figure 6: Cohort analysis estimates of population weighted average annual mortality (ages 5-10). Text
label indicates the estimated total mortality for 2017.
Recruitment
Recruitment (Fig. 7) has generally been at or above the time-series average since 2005, with a
particularly strong cohort produced in 2011. The 2012 cohort was also among the strongest in
the time series. However, even these strong cohorts are expected to decline rapidly in coming
years if total mortality rates remain at high levels. Preliminary indications are that the 2016
cohort is relatively strong, but the degree to which it is expected to contribute to the fishery may
be revised as additional data are collected.
8Newfoundland and Labrador Region Stock Assessment of 3Ps Cod
Figure 7: Estimated relative year-class strength from cohort model (median estimate with 95% confidence
intervals). The dashed horizontal line is the time-series median.
Projection
Projection of the stock to 2021 was conducted assuming mortality rates will be within ±20% of
current values (2015-17 average). All projections show SSB in 2021 to be lower than SSB in
2018. Where total mortality is assumed to remain at or above current levels, projections indicate
that SSB in 2020 and 2021 to be at or below Blim . The risk of being below Blim by 2020 ranges
from 0.19 and 0.86, and in 2021 from 0.14 to 0.83 (Table 2).
9Newfoundland and Labrador Region Stock Assessment of 3Ps Cod
Table 2: Risk of projected SSB being below Blim under five scenarios of total mortality (Z at status quo,
±10% status quo and ±20% status quo) over 2019-21. Status quo Z was estimated as the geometric
mean of the last three years.
Mortality (Z)
Year Relative SSB (median with 95% CI) P(SSBNewfoundland and Labrador Region Stock Assessment of 3Ps Cod
Sentinel survey
Fixed gear sentinel surveys have been conducted at sites along the south coast of
Newfoundland from St. Bride’s to Burgeo from 1995 through 2017. Gillnet results come mostly
from sites in Placentia Bay whereas line-trawl results come mostly from sites west of the Burin
Peninsula. The sentinel survey for 2018 is still ongoing; hence, the data for 2018 are incomplete
and were not included in the modeling reported below.
The sentinel survey data were standardized to remove site and seasonal effects to produce
annual indices of the total and age-specific catch rates (Fig. 8).
The standardized total annual catch rate for gillnets was highest from 1995-97, but
progressively lower in 1998 and 1999, and remained quite low from 2000 to 2017 (Fig. 8, upper
panel). The line-trawl catch rates were high in 1995 with a steady decline to 1999, but were
subsequently fairly constant through 2009 (Fig. 8, lower panel). More recent (2013-17) values
are the lowest in the time-series.
The standardized age-specific catch rates for sentinel gillnets and line-trawls show similar
trends with the relatively strong 1989 and 1990 year-classes being replaced by subsequent
weaker year-classes resulting in an overall decline in catch rates. Although the magnitude of the
sentinel catch rates has been generally constant for more than a decade, the 1997 and 1998
year-classes were consistently evident in both age disaggregated sentinel indices. In addition,
the 2004 year-class appears to be well-represented only within line-trawl results. The relative
strength of more recent year-classes in the sentinel results is less clear. Comparison of sentinel
catch rates and the RV index at times show inconsistent age compositions; these differences
are not fully understood. As an example, the 2006 year-class ranks above average in the RV
survey, but does not appear particularly strong in either sentinel index even though fish in this
year-class are now available to these gears. The 2011 year class, which appears as the
strongest in the RV survey, appears prominently in the 2017 sentinel survey. The 2012 year
class also appeared strong in both the RV survey and the 2017 linetrawl data from the sentinel
survey.
11Newfoundland and Labrador Region Stock Assessment of 3Ps Cod
Figure 8: Standardized sentinel catch rates for gillnets (upper panel) and line-trawls (lower panel). Error
bars are 95% confidence intervals; dashed lines represent the time-series average.
Logbooks
There is considerable uncertainty in the interpretation of fishery catch rate data. These data may
be more reflective of changes in fishery performance or the nature of the fishery than changes
in population size.
Logbooks forNewfoundland and Labrador Region Stock Assessment of 3Ps Cod
compared to approximately 70% at the start of the time series in 1997. This likely affects the
quality, and comparability, of this index over time, such that it is unclear if the CPUE trends
reflect the fishery as a whole.
Figure 9: Standardized catch rates for gillnets (upper panel) and line-trawls (lower panel) derived from
logbook data for vessels less than 35 feet. Error bars are 95% confidence intervals; dashed lines
represent the time-series average.
Logbooks for >35’ Vessels
Catch rates for gillnets from vessels >35’ were standardized to account for spatial and seasonal
effects. For these vessels, standardized annual catch rates (Fig. 10, upper panel) were higher in
magnitude than those from vessels less than 35 feet (Fig. 9), but the general pattern was
similar. Both time series showed an initial decline over 1998 to 2000 followed by fairly constant
catch rates to 2017. Over the last decade, approximately two thirds of the reported landings
from vessels >35’ were accounted for by the standardized gillnet index, which is slightly higher
than earlier in the series when less than 50% coverage occurred frequently. Further analyses
are required to develop a standardized catch rate index for line trawls fished by vessels >35’.
For the otter trawl fleet, catch rates were standardized to remove spatial, seasonal, and vessel
size (greater or less than 100 feet) effects. Standardized annual catch rates for otter trawlers
generally declined from 1999 to 2017 with high values during 2006 (Fig. 10, lower panel)
attributed to atypically high fishing effort in 3Psh where catch rates are much higher than other
areas. The percentage of the otter trawl catch that is accounted for in the standardized index
13Newfoundland and Labrador Region Stock Assessment of 3Ps Cod
was variable over time (27-94%) but has been 60% or higher since 2010. During this period, the
otter trawl fleet was small and logbook data was available from less than ten vessels annually.
The long term decline in catch rates by otter trawlers is broadly consistent with the declining
trend in biomass indices from the RV survey. However, otter trawl effort is variable with respect
to timing (little or no autumn tows during some years) and is highly concentrated relative to RV
survey coverage.
Figure 10: Standardized catch rates for gillnets (upper panel) and otter trawls (lower panel) derived from
logbook data for vessels greater than 35 feet. Error bars are 95% confidence intervals.
Observer sampling
Data collected at sea by observers on Canadian vessels fishing for cod (1997-2017) were
analyzed to calculate a standardized catch rate index for gillnets. There were substantial
variations in observer coverage over time and among unit areas, as well as by fleet sector.
Although the proportion of the landings observed is low (Newfoundland and Labrador Region Stock Assessment of 3Ps Cod
Tagging
The geographical coverage of tagging since 2007 has been limited to areas of Fortune Bay and
Placentia Bay, which causes some uncertainty as to how results from these inshore areas relate
to the stock as a whole. The number of cod tagged has varied annually and by area with tagging
conducted annually in 3Psc (Placentia Bay) during 2007 to 2015 plus 2017, in 3Psb (Fortune
Bay) during 2012 to 2017 (plus 2007) and in 3Psa only during 2007, 2013 and 2017. Although
exploitation rates based on tagging of cod in these inshore areas may not be applicable to other
areas, or to the stock as a whole, these inshore regions account for a significant portion (~ 50%)
of the overall annual landings from the stock.
The general pattern of cod tag returns remains unchanged with most of the fish tagged in 3Ps
being harvested in 3Ps. Recent tagging suggests exploitation of 3Ps cod in neighbouring stock
areas (Divs. 3KL) is minimal and not a major issue for management. No new information was
available to evaluate mixing in the western part of the stock (3Pn or 4R). The timing of tagging
experiments with respect to the annual commercial fishery complicates analysis aimed at
developing exploitation rates.
FFAW Telephone Survey
Canadian fixed-gear fish harvesters’ perspectives on the 2017 fishery were compiled based on
the results of the telephone survey conducted by the FFAW. Results are based on the
responses of 55 active harvesters, which is 17% of the active harvesters reported in 2016.
Harvesters reported good catch rates and abundance during the 2017 season, with rankings
higher by harvesters who fished west of the Burin Peninsula (Fortune to Burgeo).
Surveyed harvesters reported low levels of capelin, mackerel, sandlance and squid in the area,
with over 60% of all harvesters surveyed assigning to the lowest bait abundance rank for each
species. Herring abundance was ranked higher with over 60% of harvesters reporting average
or above average abundance (ranks 3-5).
Sources of Uncertainty
Although the RV survey of Subdivision 3Ps includes coverage of 45 index strata, the majority of
the survey indices for cod are typically influenced by catches from only a small number of those
strata. In some years the high estimates in some of these strata are a result of a single large
survey tow. For example, in two of the last four years, a large survey tow on Burgeo Bank has
had a major influence on survey indices (e.g. 60% of the biomass index in 2016 resulted from a
single survey tow in stratum 309). The presence of single large survey tows results in increased
uncertainty in the survey data which is not accounted for in the cohort analysis.
Survey indices are at times influenced by “year-effects”, an atypical survey result that can be
caused by a number of factors (e.g., environmental conditions, movement, degree of
aggregation, etc.) which may be unrelated to absolute stock size. There are strong indications
that the 2013 survey may have been influenced by a year effect that resulted in a large spike in
the survey indices for that year. The 2013 RV survey estimated that the abundance of multiple
cohorts increased compared to observations of these same cohorts at one age younger in 2012.
Since the number of fish in a cohort cannot increase after it is fully recruited to the survey gear
(without immigration), such results are usually considered clear evidence for a year effect. Year
effects in the survey data have the potential to mask trends in the data for several years and
contribute to retrospective patterns.
Recent assessments of 3Ps cod have been subject to revisions of estimates from previous
years with the addition of a new year’s survey data. Using the most updated data in 2018, only
15Newfoundland and Labrador Region Stock Assessment of 3Ps Cod
minor revisions were observed in previous year estimates of SSB and recruitment at age one.
However, estimates of total mortality were revised downward with the addition of one year of
data, but estimates remained within confidence bounds and it was concluded that the
retrospective pattern was not a major concern. These revisions are not uncommon in cohort
models, which use annual information to predict the abundance of multiple cohorts.
Burgeo Bank is a known seasonal mixing area for cod from 3Ps and those from the Northern
Gulf of St. Lawrence. The DFO RV survey was moved to April in 1993 to minimize the impact of
migratory Northern Gulf fish on the assessment of 3Ps cod. However, at least one published
study suggests that a non-trivial portion of fish in the Burgeo Bank area in April is of Northern
Gulf origin (Méthot et al. 2005). The potential presence of non-3Ps fish in this area at the time of
the survey combined with the fact that a large portion of the survey indices have come from the
Burgeo Bank area in recent years suggests the potential for overestimation of survey results.
The level of total removals is uncertain. It is likely that landings have been biased both upwards
(e.g., due to misreporting of catch by area and/or species) and downwards (e.g., due to
discarding). In addition, commercial catch accounting procedures pre- and post-moratorium are
radically different, with current measures likely to provide improved estimates of removals.
Estimates of recreational fishery landings have not been available since 2006. In assessing
stock status, it would be useful to better understand the accuracy of total removals. Given these
uncertainties and the variability in the reliability of removals estimates, the decision was
previously made to assess this stock based on a cohort model that incorporates only RV catch
information (i.e., no commercial catch data). Assessment models do exist that are capable of
handling uncertainty in the catch estimates but a full evaluation of these or any other model
formulations would require a framework meeting.
The relative efficiency of the survey trawl at capturing different age groups is uncertain. Differing
patterns of catchability were explored in a previous assessment and yielded a similar outcome
in terms of current status relative to the LRP. If the catchabilities differ from the assumed values,
stock dynamics may differ from the results presented above.
CONCLUSIONS AND ADVICE
• Consistent with recent assessments, a cohort model (SURBA) based on the spring DFO
survey was used to infer overall stock trends.
• The 2018 SSB is estimated to be in the Cautious Zone (49% above Blim ) as defined by the
DFO Precautionary Approach (PA) Framework. The probability that the stock is in the critical
zone is 0.04.
• SSB has increased since 2015. In 2018, 71% of the SSB is comprised of ages 6 and 7.
• Recruitment has generally been at or above the time-series average since 2005, with a
particularly strong cohort produced in 2011.
• Estimated total mortality remains high. Over 2015-17, total mortality averaged 0.61 (54%
survival per year), however the relative contributions of natural and fishing mortality to total
mortality are unknown.
• Projection of the stock to 2021 was conducted assuming total mortality rates will be within
+/- 20% of current values (2015 to 2017 average). All projections show SSB in 2021 to be
lower than SSB in 2018. Where total mortality is assumed to remain at or above current
levels, projections indicate that SSB in 2020 and 2021 to be at or below Blim .
16Newfoundland and Labrador Region Stock Assessment of 3Ps Cod
• The ecosystem in Subdivision 3Ps remains under reduced productivity conditions. Spring
bloom magnitude and zooplankton biomass have shown very low levels since 2014, which
would negatively impact transfer of energy to higher trophic levels. However, there are some
improvements in biological indicators for cod in 2018 (e.g. condition and diet).
OTHER CONSIDERATIONS
Management Considerations
The assessment of 3Ps cod is based on a cohort model that utilizes data from the DFO spring
RV survey. Other data sources are typically examined during the course of the assessment
meeting but have previously been eliminated as potential inputs for modeling population
dynamics due to questions regarding reliability (e.g., catch), concerns related to limited spatial
coverage (logbook data, sentinel data, tagging data), and/or the inability to incorporate more
than one data source into the current model formulation. Given concerns regarding the current
modeling approach, activities are ongoing toward a framework meeting to evaluate modelling
options. That framework meeting is anticipated to occur during autumn 2019.
A seasonal closure of the entire 3Ps stock area (typically March to mid-May) occurs annually
and is intended to minimize fishing on spawning aggregations. Some harvesters have
suggested that the time of spawning has been delayed in recent years and that the timing of the
closure may no longer be appropriate. Fishing was permitted in March 2014 and 2015 to
provide those harvesters with increased flexibility in accessing the resource. In 2015 and 2016,
samples collected from the Halibut Channel area (Southern 3Ps) by industry (March) and from
the DFO multispecies survey (April) indicated that spawning in this area began in April. No
spawning was observed in March but egg sizes suggested that at least some fish were nearing
spawning at the time of capture. The original recommendation for the 3Ps spawning closure
came with the suggestion that spawning in this stock occurs during April-June but with the
acknowledgement that “spawning ground behavior typically begins in March” (FRCC 2001).
Hence, the recommended (and subsequently adopted) closure time of March 1-June 30 was
presumably intended to protect not only spawning but also pre-spawning aggregations. If the
objective of the 3Ps spawning closure is still to protect spawning and pre-spawning
aggregations, then the starting date of the closure is likely still appropriate. It should be noted,
however, that the current closure end date of mid-May almost certainly does not protect the full
spawning period for this stock.
SOURCES OF INFORMATION
This Science Advisory Report is from the October 16-17, 2018 Assessment of Northwest
Atlantic Fisheries Organization (NAFO) Subdivision 3Ps Atlantic Cod. Additional publications
from this meeting will be posted on the Fisheries and Oceans Canada (DFO) Science Advisory
Schedule as they become available.
Cadigan, N. 2010. Trends in Northwest Atlantic Fisheries Organization (NAFO) Subdivision 3Ps
Cod (Gadus morhua) stock size based on a separable total mortality model and the
Fisheries and Oceans Canada Research Vessel survey index. DFO Can. Sci. Advis. Sec.
Res. Doc. 2010/015. iv + 43 p.
FRCC. 2001. Conservation requirements for groundfish stocks in sub-areas 0, 2 + 3. Ottawa,
Canada. 39 p.
17Newfoundland and Labrador Region Stock Assessment of 3Ps Cod
Méthot, R., Castonguay, M., Lambert, Y., Audet, C. and S. Campana. 2005. Spatio-temporal
Distribution of Spawning and Stock Mixing of Atlantic Cod from the Northern Gulf of
St. Lawrence and Southern Newfoundland Stocks on Burgeo Bank as Revealed by Maturity
and Trace Elements of Otoliths. J. Northw. Atl. Fish. Sci. 36: 1–12.
APPENDIX
NAME Affiliation
Erika Parrill DFO - Centre for Science Advice
Jonathan Babyn DFO – Science
Joanne Morgan DFO – Science
Alfred Fitzpatrick Harvester
Brian J Careen Harvester
Dan Baker Harvester
Erin Carruthers Food, Fish, and Allied Workers (FFAW)
Bob Rogers DFO - Science
Heather Penney DFO – Science
Karen Dwyer DFO – Science
Laura Wheeland DFO – Science
Greg Robertson DFO - Science
Andrea Perreault Rapporteur
Derek Osborne DFO - Science
Danny Ings DFO - Science
Joel Vigneau IFREMER
Juliette Champagnat IFREMER
Chelsey Kawbowski Oceans North
Andrew Cuff DFO – Science
Fan Zhang MUN - Marine Institute
Geoff Evans DFO Emeritas
Kris Vascotto Groundfish Enterprise Allocation Council (GEAC)
Gary Maillett DFO – Science
Eugene Colbourne DFO – Science
Rick Rideout DFO - Science
Mariano Koen-Alonso DFO - Science
Keith Lewis DFO – Science
Irene Andrushchenko St. Andrews Biological Station (SABS)
Brian Healey DFO - Science
Joanna Mills Flemming Dalhousie University
Connie Korchoski DFO – Centre for Science Advice
Frederic Cyr DFO – Science
Paul Regular DFO - Science
Luiz Mello DFO - Science
Peter Upward DFO – Science
Noel Cadigan MUN – Marine Institute
Jin Gao MUN – Marine Institute
18Newfoundland and Labrador Region Stock Assessment of 3Ps Cod
NAME Affiliation
Shelley Dwyer DFO – Resource Management
Chelsie Tricco DFO – Resource Management
Melissa Abbott DFO - Resource Management
Sherrylynn Rowe MUN – Marine Institute
Jennifer Duff DFO – Communications
Ben Davis DFO – Science
Sebastian Donnett DFO – Science
Tom Dooley Government of NL – Fisheries and Land Resources
THIS REPORT IS AVAILABLE FROM THE:
Centre for Science Advice
Newfoundland and Labrador Region
Fisheries and Oceans Canada
PO Box 5667
St. John’s, NL
A1C 5X1
Telephone: (709) 772-8892
Internet address: www.dfo-mpo.gc.ca/csas-sccs/
ISSN 1919-5087
© Her Majesty the Queen in Right of Canada, 2019
Correct Citation for this Publication:
DFO. 2019. Stock Assessment of NAFO Subdivision 3Ps Cod. DFO Can. Sci. Advis. Sec. Sci.
Advis. Rep. 2019/009.
Aussi disponible en français :
MPO. 2019. Évaluation du stock de morue dans la sous-division 3Ps de l’OPANO. Secr. can. de
consult. sci. du MPO, Avis sci. 2019/009.
19You can also read