Dynamic Panel Data Modeling and Surveillance of COVID-19 in Metropolitan Areas in the United States: Longitudinal Trend Analysis - JMIR
←
→
Page content transcription
If your browser does not render page correctly, please read the page content below
JOURNAL OF MEDICAL INTERNET RESEARCH                                                                                                       Oehmke et al

     Original Paper

     Dynamic Panel Data Modeling and Surveillance of COVID-19 in
     Metropolitan Areas in the United States: Longitudinal Trend
     Analysis

     Theresa B Oehmke1, MSc; Lori A Post2, PhD; Charles B Moss3, PhD; Tariq Z Issa4, BA; Michael J Boctor4, BSc;
     Sarah B Welch2, MPH; James F Oehmke2, PhD
     1
      Department of Civil and Environmental Engineering, University of California, Berkeley, Berkeley, CA, United States
     2
      Department of Emergency Medicine, Feinberg School of Medicine, Northwestern University, Chicago, IL, United States
     3
      Institute of Food and Agricultural Sciences, University of Florida, Gainesville, FL, United States
     4
      Feinberg School of Medicine, Northwestern University, Chicago, IL, United States

     Corresponding Author:
     Theresa B Oehmke, MSc
     Department of Civil and Environmental Engineering
     University of California, Berkeley
     202 O'Brien Hall
     Berkeley, CA, 94720
     United States
     Phone: 1 5108986406
     Email: toehmke@berkeley.edu

     Abstract
     Background: The COVID-19 pandemic has had profound and differential impacts on metropolitan areas across the United
     States and around the world. Within the United States, metropolitan areas that were hit earliest with the pandemic and reacted
     with scientifically based health policy were able to contain the virus by late spring. For other areas that kept businesses open, the
     first wave in the United States hit in mid-summer. As the weather turns colder, universities resume classes, and people tire of
     lockdowns, a second wave is ascending in both metropolitan and rural areas. It becomes more obvious that additional SARS-CoV-2
     surveillance is needed at the local level to track recent shifts in the pandemic, rates of increase, and persistence.
     Objective: The goal of this study is to provide advanced surveillance metrics for COVID-19 transmission that account for
     speed, acceleration, jerk and persistence, and weekly shifts, to better understand and manage risk in metropolitan areas. Existing
     surveillance measures coupled with our dynamic metrics of transmission will inform health policy to control the COVID-19
     pandemic until, and after, an effective vaccine is developed. Here, we provide values for novel indicators to measure COVID-19
     transmission at the metropolitan area level.
     Methods: Using a longitudinal trend analysis study design, we extracted 260 days of COVID-19 data from public health
     registries. We used an empirical difference equation to measure the daily number of cases in the 25 largest US metropolitan areas
     as a function of the prior number of cases and weekly shift variables based on a dynamic panel data model that was estimated
     using the generalized method of moments approach by implementing the Arellano-Bond estimator in R.
     Results: Minneapolis and Chicago have the greatest average number of daily new positive results per standardized 100,000
     population (which we refer to as speed). Extreme behavior in Minneapolis showed an increase in speed from 17 to 30 (67%) in
     1 week. The jerk and acceleration calculated for these areas also showed extreme behavior. The dynamic panel data model shows
     that Minneapolis, Chicago, and Detroit have the largest persistence effects, meaning that new cases pertaining to a specific week
     are statistically attributable to new cases from the prior week.
     Conclusions: Three of the metropolitan areas with historically early and harsh winters have the highest persistence effects out
     of the top 25 most populous metropolitan areas in the United States at the beginning of their cold weather season. With these
     persistence effects, and with indoor activities becoming more popular as the weather gets colder, stringent COVID-19 regulations
     will be more important than ever to flatten the second wave of the pandemic. As colder weather grips more of the nation, southern
     metropolitan areas may also see large spikes in the number of cases.

     https://www.jmir.org/2021/2/e26081                                                                    J Med Internet Res 2021 | vol. 23 | iss. 2 | e26081 | p. 1
                                                                                                                         (page number not for citation purposes)
XSL• FO
RenderX
JOURNAL OF MEDICAL INTERNET RESEARCH Oehmke et al
(J Med Internet Res 2021;23(2):e26081) doi: 10.2196/26081
KEYWORDS
COVID-19; SARS-CoV-2; SARS-CoV-2 surveillance; second wave; wave two; wave 2; global COVID-19 surveillance; COVID-19
metropolitan areas; COVID-19 cities; US public health surveillance; US COVID-19; US surveillance metrics; dynamic panel
data; generalized method of the moments; US econometrics; US SARS-CoV-2; US COVID-19 surveillance system; US COVID-19
transmission speed; US COVID-19 transmission acceleration; COVID-19 transmission deceleration; COVID-19 transmission
jerk; COVID-19 7-day lag; Arellano-Bond estimator; generalized method of moments; GMM; New York City; Los Angeles;
Chicago; Dallas; Houston; Washington, DC; Miami; Philadelphia; Atlanta; Phoenix; Boston; San Francisco; Riverside; Detroit;
Seattle; Minneapolis; San Diego; Tampa; Denver; St Louis; Baltimore; Charlotte; Orlando; San Antonio; Portland
mitigate the health and economic impacts caused by the virus
Introduction [7]. The US federal government did not create a national unified
In December 2019, a novel coronavirus, SARS-CoV-2, leading pandemic control strategy [8-10], leading local state and city
to severe pneumonia and acute respiratory disease, was observed officials to implement their own public health and safety
in Wuhan, China (Figure 1) [1-4]. On January 21, 2020, the measures to “flatten the curve” [11]. However, by late May,
first confirmed case of COVID-19 was recorded in the United many state and city leaders lifted their public health measures,
States [5]. As cases began to spread globally at an alarming leading to another alarming rise in COVID-19 case numbers
rate, the World Health Organization officially recognized [12,13]. As of October 29, 2020, there are 8,937,926 confirmed
COVID-19 as a pandemic on March 11, 2020 [6]. Around the COVID-19 cases and 228,439 COVID-19–related deaths across
world, countries quickly implemented public health policies to the United States [14].
Figure 1. Timeline illustrating important events of the COVID-19 pandemic as related to US metropolitan areas.
Metropolitan areas largely drove the first wave of COVID-19 European hotspots in Spain and Italy early in the pandemic
in the country [15], with northern travel hubs such as New York [19,21,22]. Chicago, Boston, and Detroit were likely additional
City, Chicago, Boston, Detroit, and Seattle seeing early spikes entry points because of the large number of international
in the number of cases and deaths [14] (we refer to the area by travelers—Detroit’s metro airport had over 1100 flights per day
the first city in its Census Bureau designation; eg, New York to 4 continents including direct flights to China and Europe
City for the New York-Newark-Jersey City, NY-NJ-PA [23], and was the least busy of the airports.
core-based statistical area). Initial outbreaks around major east
COVID-19 became endemic in the United States at the end of
and west travel hubs are particularly important because they are
March [9], when many of these northern metro areas and travel
gateways of international travel and have high population
hubs saw significant uptrends in their COVID-19 caseloads. In
densities [16,17]. Genomic evidence from early SARS-CoV-2
many of these areas, the first wave peaked in late March or early
strains suggests that initial infections in the United States were
April after lockdowns and other preventive measures were
introduced to Washington State, a hub for travel to East Asia,
imposed. For example, Washington State recorded its first death
by travelers from China [18-20]. There is also evidence that
on February 19, 2020, and Governor Jay Inslee declared a state
suggests New York City likely served as a primary entry point
of emergency later that same day [24]. This led to increasingly
to the United States for the SARS-CoV-2 contagion from
stringent lockdown measures from Inslee, Seattle Mayor Jenny
https://www.jmir.org/2021/2/e26081 J Med Internet Res 2021 | vol. 23 | iss. 2 | e26081 | p. 2
(page number not for citation purposes)
XSL• FO
RenderXJOURNAL OF MEDICAL INTERNET RESEARCH Oehmke et al
Durkan, and country executives, culminating in the governor this week to new cases next week (eg, from Halloween, sports
issuing a “Stay Home Stay Safe” lockdown on March 23 events, political rallies, etc)?
[25,26]. Michigan’s first case was recorded on March 10, and
The objective of this paper is to provide novel, policy-relevant
Michigan Governor Gretchen Whitmer imposed a “stay at
surveillance information about the second wave of COVID-19
home” lockdown on March 23 [27,28]. In the Seattle
cases in the 25 largest metropolitan areas in the United States.
metropolitan area, the first wave peaked the week of March
This information is of critical importance to controlling the
20-26, as it did in Detroit (authors’ calculations using data from
second wave because in the absence of a national coronavirus
USAFacts.org [29]). New York peaked the week of March 27
policy, a COVID-19 policy is made and implemented at the
to April 2, Boston the week of April 10-16, and Chicago the
state and local levels, including the metropolitan area [9,47].
week of April 17-24. The ebb from the first peak is associated
Guidelines on reopening such as a 14-day downward trend in
with the imposition of varying degrees of lockdown measures,
the number of new cases per day are difficult to implement at
social distancing, and mask wearing, among other COVID-19
the local level without accurate quantitative data on the number
responses and policies [11,30-33].
of new cases and a local, area-specific trend. For example, in
The first wave of the pandemic crested in southern cities about Los Angeles and New York City, day-to-day fluctuations in
3 months later, corresponding to a US-wide peak on July 16 new case numbers were directly correlated to testing numbers
with 77,352 new cases that day [19]. Phoenix peaked the week rather than biological factors [48]. Additionally, there can be
of July 3-9, with an average of 1404 new cases per day. Los differences between state and local policies, leading to friction
Angeles peaked the week of July 10-16 with an average of 2080 between governors and mayors with perhaps negative impacts
new cases per day during that week; Miami also peaked that on public adherence to social distancing, face mask wearing,
same week with an average of 1666 new cases per day. and other public health guidelines and behaviors [49].
Consequently, surveillance information is needed at the
The impact of the first wave on southern cities is associated
metropolitan level to help inform policy needs and policy
with a lack of COVID-19 prevention measures in these areas
effectiveness.
[9,16,17,34,35]. For example, in Texas, on April 27, 2020,
Governor Greg Abbott issued an executive order reopening the
state including in-person retail and dining and prohibiting
Methods
municipalities from imposing sanctions on individuals who Overview
chose not to wear a face mask [36], despite opposition from
local government leaders [37,38]. On June 17, the governor This paper uses the dynamic panel data (DPD) modeling
allowed local jurisdictions to require face masks and, on July application and surveillance approach [50,51], which has been
2, mandated face masks across the state [37,38]. In Dallas and applied to sub-Saharan Africa, South Asia, and at the state level
Houston, the pandemic initially peaked the week of July 10-16 in the United States [52-54]. We apply these methods to the 25
and then ebbed (authors’ calculations based on data from most populous US metropolitan areas, as defined by the US
USAFacts.org [29]). Census Bureau [55]. For each metropolitan area, a panel data
set is constructed using counties as the cross-sectional variable
The United States is now entering the second wave of the and days as the time variable.
COVID-19 pandemic [39,40]. As of November 2020, only 3
US counties have not reported a case of COVID-19, each of The DPD modeling method is a novel approach to medical
which has a population of less than 1000 people [41]. Many surveillance applications. Traditional contagion modeling
cities and states have reopened, citing the need to keep their techniques, including agent-based modeling and system
economies functioning [42]. There has been considerable dynamics, are complex, require sophisticated software (system
pushback against COVID-19 precautions, such as social dynamics), and are labor intensive, which makes them
distancing and face mask wearing. The pushbacks have reached impractical for rapid surveillance across dozens of cities and
the extremes of violent protests in Texas [43], and an alleged counties in the United States, especially given the data that are
plot to kidnap the Governor of Michigan [44]. With the readily available and easily accessible. Surveillance methods
second—historically more deadly [45,46]—year of the pandemic should rapidly generate understandable indicators to inform
coming up in a few months, surveillance of the disease will be current decision making [56]. Our surveillance method can
even more relevant for determining appropriate COVID-19 quickly be applied to existing data to generate indicators of
precautions. The onset of the second wave requires taking pandemic outbreak locations and where explosive growth is
initiative rather than relying on reactive public health measures, likely to occur. The DPD-based modeling and surveillance
and in order to be proactive, an improved surveillance system method was validated previously [50,51]; these papers contain
is needed. more detailed explanations and additional references to other
methods.
A robust surveillance system should answer relevant questions
about the second wave: how many new cases appear in the Data
metropolitan area per day per 100,000 population? Is the number Data on the cumulative number of positive COVID-19 cases
of new cases an acceleration from the previous week, and is the based on testing for each county and each day were downloaded
acceleration indicative of explosive growth? Is there evidence from USAFacts.org [29] on October 17, 2020, as an excel file
of sustained transmission from new cases last week to new cases and are complete from January 22 through October 15, 2020.
Data from March 20 to October 15 were used for statistical
https://www.jmir.org/2021/2/e26081 J Med Internet Res 2021 | vol. 23 | iss. 2 | e26081 | p. 3
(page number not for citation purposes)
XSL• FO
RenderXJOURNAL OF MEDICAL INTERNET RESEARCH Oehmke et al
analysis and tables presented in this paper, which provides 30 shifts in the 7-day persistence effect. A positive weekly shift
weeks of data from the approximate start of the pandemic in could be caused by a super-spreading event that occurred during
the United States. On March 20, the country had 6367 new the week in question, by reopening, by the removal of
cases, the first day in which the number of new cases exceeded mask-wearing requirements, or similar events.
5000 [57]. The only cleaning or processing of the data was to
We applied the DPD model to the 25 most populous
create the novel surveillance metrics described below based on
metropolitan areas in the United States. The model was
Oehmke et al [50].
estimated using the generalized method of moments (GMM)
Surveillance Methods approach [58] as implemented by Arellano and Bond [59] for
Following the procedures described by Oehmke et al [50], we DPD models and applied to the COVID-19 pandemic by
calculated the novel surveillance metrics of speed, acceleration, Oehmke et al [50,51]. The Wald chi-square test was
and jerk for the COVID-19 caseloads for each of the 25 most administered to test model fit based on the null hypothesis that
populous metropolitan areas. Speed is defined as the number the regression contains no explanatory power. The Sargan
of new cases per day per 100,000 population; since reporting chi-square test was applied to determine model validity by
coverage depends on the day of the week, we report a weekly testing the null hypothesis that the model is valid [58]. Statistical
average value. Acceleration is the change in speed from one significance was determined at the 5% level. All estimations
week to the next. It provides the primary indication of whether were conducted in STATA/MP 16.1 (StataCorp LLC) using the
the pandemic is getting worse (positive acceleration) or better xtabond command.
(negative acceleration or deceleration). Jerk is calculated as the Because of the use of lagged values in these formulae, we
change in acceleration from the prior week to the current week. reported results for each of the 55 “weeks” (7-day periods) from
Jerk is the second indictor of whether the pandemic is getting Monday, March 2, 2020, through Sunday, January 3, 2021, in
worse, with a positive jerk signaling growing acceleration that the Multimedia Appendices 1 and 2. This paper contains the
is possibly associated with a super-spreading event, ineffective results for the week of October 9-15, 2020.
reopening policy, colder weather, or other behavior or
environmental change. A negative jerk indicates a slowing Results
acceleration, possibly leading to a plateau or even a peak
followed by deceleration in the pandemic. Persistence Rates
Dynamic Panel Data Regression Methods Complete data for persistence rates by International Standards
Organization (ISO) week and metropolitan area are provided
The DPD model generates the 7-day persistence surveillance
in an excel sheet (Multimedia Appendix 1). The full set of
indicator. This model relies in part on discerning common trends
persistence results cover the week beginning on April 6, 2020,
across counties within a metropolitan area, if present, to inform
through the week ending on January 3, 2021. To optimize
the modeling of overall metropolitan area trends in general and
computer resources, weekly persistence rates were estimated
the 7-day persistence effect in particular.
using data for the annual quarter containing the week; for
We cannot replicate the full model described elsewhere [50,51] example, persistence rates for ISO week 53 (December 28,
since testing data are available only on the number of positive 2020, to January 3, 2021) are estimated from data for the fourth
tests administered by each county. Instead, we use the quarter of 2020.
abbreviated model:
We were unable to estimate a persistence rate for Phoenix for
the week ending January 3, 2021, due to insufficient data at the
time of estimation. The metropolitan areas of Los Angeles and
where the subscripts i and t denote the county within the metro Riverside comprise only 2 counties, and San Diego comprises
area and the day of the measurement, respectively. Speedit is 1 county, so at times there was insufficient cross-county
the number of new cases in county i on day t, εit is an error term, variation for the application of DPD techniques. In this case,
and the βj parameters are those to be estimated. β1 and β2 we estimated values for the combined Southern California region
quantify the 1-day and 2-day lag effects, and β3 determines the (combined Los Angeles, Riverside, and San Diego metro areas).
In particular, persistence rates reported for Riverside and San
base coefficient value for calculating the 7-day persistence
Diego for the fourth quarter (ISO weeks 41 through 53) are
effect. β3 measures the number of new cases today that are
estimates for the Southern California region.
statistically attributable to new cases 7 days ago, that is, it
measures the propensity of the pandemic to travel in week-long A positive persistence rate most likely indicates continuing
“echoes” in which people newly diagnosed a week ago also unsafe COVID-19 behaviors that recur over time, whereby
infected others a week ago, and these others are diagnosed as infected individuals in a given week transmit the infection to
new cases today. These week-long echoes could be caused by other individuals who appear as COVID-19 cases the next week,
idiosyncratic factors such as super-spreading events and/or by leading to a “persistence” in the number of COVID-19 cases
systemic factors such as a systemic disregard for social reported each week. Large positive persistence rates are
distancing and mask wearing. The indicator variables I10.9-10.15 associated with increasing case rates, and rates greater than 1
and I10.2-10.8 define the weeks October 9-15 and October 2-8, are indicators of potentially explosive growth. A negative
respectively, so that the coefficients β4 and β5 quantify weekly persistence rate could indicate a choppy, up-and-down
movement in the number of COVID-19 cases from week to
https://www.jmir.org/2021/2/e26081 J Med Internet Res 2021 | vol. 23 | iss. 2 | e26081 | p. 4
(page number not for citation purposes)
XSL• FO
RenderXJOURNAL OF MEDICAL INTERNET RESEARCH Oehmke et al
week, or a period of downturn and decline in the number of acceleration, with speed declining to an average of 3 new cases
cases. per day per 100,000 population during the week of May 29 to
June 4, 2020, and remaining at values of 3 or 4 before starting
Entering 2021, the metropolitan areas with the largest
a second wave ascent the week of September 18-24, 2020. This
persistence were New York City (1.83), Miami (1.00),
general pattern was replicated to a large degree in other northern
Philadelphia (1.61), Tampa (1.08), Charlotte (1.29), and Orlando
cities hit early by the first wave.
(1.04). These areas are at high risk for increased COVID-19
caseloads during the first full week of January, with a potential Although Dallas recorded its first 3 cases on March 9, case
for explosive growth. counts increased relatively slowly during an early Dallas
shutdown to an average of 175 new cases daily and a speed of
Surveillance Results 2.3 new cases per 100,000 during the week of April 17-23. After
We report novel surveillance results of speed, acceleration, and the governor ordered Texas to reopen on April 17, case counts
jerk for each of the 44 “weeks” (7-day periods) from the week increased noticeably but not explosively, reaching a speed of
beginning on March 2, 2020, through the week ending on 4.9 new daily cases per 100,000 the week of May 29 to June 4.
January 3, 2021, in Multimedia Appendix 2. Table 1 contains During that week, acceleration and jerk turned positive and
the results for the week of October 9-15, 2020. In relation to stayed positive through the week of July 10-16, possibly
the timeline presented in Figure 1, notable findings are that for associated with the hot weather that encouraged people to visit
New York City and Seattle jerk turned negative the week of crowded beaches or otherwise break social distancing and other
March 27 to April 2, 2020, 1 week after shutdowns. In Detroit, COVID-19 protocols [60-62], which is considered risky
jerk turned negative the week of April 3-9, 2020, 2 weeks after behavior [63]. The first wave peaked in Dallas during the week
the shutdown in Michigan. The negative jerks indicate a slowing of July 10-16 with an average of 2084 new cases per day that
of the pandemic acceleration; the chronological propinquity to week and a speed of over 27.5 new cases per 100,000. Following
the shutdown orders was consistent with a strong and rapid the reimposition of COVID-19 prevention measures on July 2,
impact of these orders on the pandemic. The average number acceleration turned negative and the number of cases declined
of daily new positive results for the week of October 9-15 ranged during the weeks spanning July 17 to September 10, with the
from 19 for San Antonio to 627 for Los Angeles (Table 2). The exception being the week of August 14-20 when a spike was
metropolitan areas with the greatest speed were Minneapolis associated with clearing a backlog of unreported prior test results
(30) and Chicago (21). The metropolitan areas with the slowest [64]. However, even the trough during the week of September
speed were Portland (3) and San Francisco (5). 4-10 had an average of 640 new cases per day and a speed of
In the New York metropolitan area, the first wave peaked during 8.4 new daily cases per 100,000, which is higher than during
the week of March 20-26, 2020, with an average of 12,855 new the early shutdown. In Dallas, the pandemic has now re-emerged
cases per day or a speed of over 68 new cases per day per with an average of 1116 new cases per day and a speed of 14.7
100,000 population. During the week of April 10-16, 2020, this new daily cases per 100,000. Other southern metropolitan areas
area started to gain control of the pandemic, characterized by a including Houston, Miami, Phoenix, and Tampa experienced
negative acceleration (–10) and the area’s largest negative jerk similar first wave patterns, although evidence of a second wave
(–33). The next 8 weeks were characterized by negative has not hit all southern cities.
https://www.jmir.org/2021/2/e26081 J Med Internet Res 2021 | vol. 23 | iss. 2 | e26081 | p. 5
(page number not for citation purposes)
XSL• FO
RenderXJOURNAL OF MEDICAL INTERNET RESEARCH Oehmke et al
Table 1. Novel surveillance metrics for the week of October 9-15, 2020.
Metropolitan area Number of daily new positive Speeda Accelerationb Jerkc 7-day persistence effectd
results, weekly average
1. New York 67 8 –1 –3 0.68
2. Los Angeles 627 8 0 0 2.90
3. Chicago 142 21 6 3 7.18
4. Dallas 101 11 1 1 1.54
5. Houston 73 8 –2 –5 2.47
6. Washington, DC 21 8 1 0 1.52
7. Miami 265 12 2 1 4.58
8. Philadelphia 65 9 2 2 1.48
9. Atlanta 26 12 1 1 1.14
10. Phoenix 255 10 2 0 2.78
11. Boston 70 9 2 1 2.16
12. San Francisco 42 5 –1 0 0.11
13. Riverside 263 11 0 0 3.51
14. Detroit 82 12 4 4 8.37
15. Seattle 94 7 1 1 5.21
16. Minneapolis 63 30 12 10 14.60
17. San Diego 286 9 0 0 2.31
18. Tampa 89 10 1 1 2.87
19. Denver 54 13 3 1 2.87
20. St Louis 37 22 5 12 3.18
21. Baltimore 38 8 0 0 2.29
22. Charlotte 40 18 0 4 3.72
23. Orlando 72 10 0 –2 2.81
24. San Antonio 19 3 –6 –7 –1.96
25. Portland 29 6 0 1 0.31
a
Number of daily new positive results, weekly average.
b
Change in speed between the weeks of October 2-8 and October 9-15.
c
Change in acceleration between the weeks of October 2-8 and October 9-15.
d
Number of cases this week statistically attributable to cases last week.
https://www.jmir.org/2021/2/e26081 J Med Internet Res 2021 | vol. 23 | iss. 2 | e26081 | p. 6
(page number not for citation purposes)
XSL• FO
RenderXJOURNAL OF MEDICAL INTERNET RESEARCH Oehmke et al
Table 2. Dynamic panel data regression of COVID-19 speed and 7-day persistence effect.
Metropolitan area Wald χ2 test of regres- Sargan χ2 test of 7-day persistence coefficient
(number of counties) sion significance model validity
(P value) (P value)
Base effect (P value) Shift, October 9-15 (P Shift, October 2-8 (P
value) value)
1. New York (n=23) 193.68 (JOURNAL OF MEDICAL INTERNET RESEARCH Oehmke et al
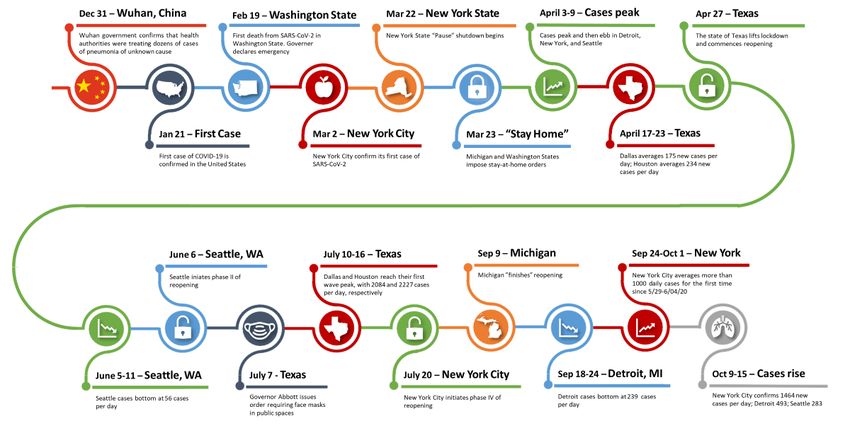
Figure 2. Number of positive COVID-19 cases recorded by the University of Minnesota, Twin Cities.
The Wald test of model significance shows that the model weeks, and Chicago’s persistence for the weeks of October 2-8
explains a statistically significant proportion of the variation in and October 9-15 increased by 0.2238 and 0.5085, respectively.
the caseload for 16 of the 25 most populous metropolitan areas. Minneapolis had the second highest increase in speed over the
The lack of statistical significance in the other 9 most populous 2 weeks, from 38 at the beginning of the 2-week period to 42
metropolitan areas is indicative of the absence of both 1-day at the end of the second week to 63 at the end of the third week.
and 7-day persistence effects, since the regression equation is This represents a 67% increase in just 14 days. For the week of
designed specifically to measure these persistence effects. The October 9-15, Minneapolis experienced a persistence shift of
lack of a persistence effect is most likely to occur when the 0.8143, the largest persistence shift recorded during the 2-week
number of new cases per day is relatively flat (constant speed). period. An increasing persistence (positive and statistically
For example, the Wald test for the Tampa metropolitan area is significant shift) would be expected to lead to greater speed in
7.18 (P=.21), and for the weeks included in the regression the next week.
analysis the speed was 9, 10, 8, 9, and 10, respectively. In other
words, the lack of a significant persistence effect is consistent Discussion
with and corroborates the finding of a low-level and flat profile
for the pandemic in the Tampa metropolitan area during those Principal Findings
weeks. Of the 9 areas where the model was not statistically The DPD model successfully represented COVID-19 case
significant, 8 had fewer than 10 counties. In the ninth area, St dynamics for all metropolitan areas, except for the
Louis, the speed ranged from 17 to 24 for the past 3 months Minneapolis-St. Paul-Bloomington area that experienced
with no discernable upward or downward trend—in this case, extreme events. Calculating speed, acceleration, and jerk also
a simple constant provides a reasonably good model and the helped with understanding case dynamics in metro areas,
DPD model contributes only minimally. especially as they refer to characterizing a peak or wave
Detroit’s speed increased from 59 for the week October 2-8 to progression.
82 in the week October 9-15. Its persistence factor increased The first wave of COVID-19 hit northern metropolitan areas
by 0.6095 for the week of October 9-15 from 0.5095 to 1.290, first. These areas were able to flatten the curve by imposing
which is indicative of explosive growth, although neither the shutdowns, social distancing, mask wearing, and other
base persistence effect nor the weekly shift effect was COVID-19 protocols. The first wave did not hit southern
individually statistically significant. Chicago had one of the metropolitan areas as early or as hard as northern areas; southern
largest percentage increases in speed, from 87 the week of metropolises reopened and only after reopening did the first
September 25 to October 1 to 100 for the week of October 2-8 wave truly hit. The current situation in the New York
to 142 for the week of October 9-15, an 80% increase in just 2 metropolitan area exemplifies the usefulness of the novel
https://www.jmir.org/2021/2/e26081 J Med Internet Res 2021 | vol. 23 | iss. 2 | e26081 | p. 8
(page number not for citation purposes)
XSL• FO
RenderXJOURNAL OF MEDICAL INTERNET RESEARCH Oehmke et al
metrics. The second wave hit New York during the week of Conclusion
August 28 to September 3, based on changes in acceleration Our analysis including the use of novel surveillance metrics
and jerk from negative to positive values. The onset was shows that the second wave of the pandemic has arrived in the
confirmed the week of September 11-17, when acceleration United States and is accelerating, especially in northern
nearly tripled from the prior week, and jerk more than metropolitan areas. For metropolitan areas in the Midwest,
quadrupled to a value of 0.98. However, the governors of New specifically Chicago, Detroit, and Minneapolis, there has been
York and New Jersey did not impose additional restrictions rapid and potentially explosive growth in cases during the first
until November 11, and then the restrictions were primarily half of October 2020. This type of growth can be seen from the
curfews on bars and late-night entertainment, based on cities’ speed, acceleration, and jerk, as well as the increasing
information available at the time [66]. Use of novel metrics 7-day persistence effects. It is critical for those cities already
could have influenced earlier, more forceful, and more proactive feeling the second wave to react swiftly and strongly. For those
COVID-19 policy. cities who have so far escaped the second wave, it is critically
Limitations important to studiously monitor surveillance data to ascertain
if and when the second wave is beginning to hit, and then to be
A limitation of this data set is that it does not have data on the
proactive in reimposing COVID-19 protocols. The overall
total number of tests reported per day at the county level. A
conclusion is that improved COVID-19 surveillance metrics
limitation of the estimation technique is that the metropolitan
can help cities be proactive in managing the pandemic, leading
areas of San Diego and Riverside, comprising one and two
to fewer cases and saving lives.
counties, respectively, had insufficient cross-sectional
information and the estimation had to be conducted for a
combined southern California region.
Conflicts of Interest
None declared.
Multimedia Appendix 1
Seven-day persistence by week and metropolitan area, 2020.
[XLSX File (Microsoft Excel File), 21 KB-Multimedia Appendix 1]
Multimedia Appendix 2
Speed, acceleration, and jerk by metropolitan area and week, 2020.
[XLSX File (Microsoft Excel File), 74 KB-Multimedia Appendix 2]
References
1. Chen N, Zhou M, Dong X, Qu J, Gong F, Han Y, et al. Epidemiological and clinical characteristics of 99 cases of 2019
novel coronavirus pneumonia in Wuhan, China: a descriptive study. The Lancet 2020 Feb;395(10223):507-513. [doi:
10.1016/s0140-6736(20)30211-7]
2. Li Q, Guan X, Wu P, Wang X, Zhou L, Tong Y, et al. Early Transmission Dynamics in Wuhan, China, of Novel
Coronavirus–Infected Pneumonia. N Engl J Med 2020 Mar 26;382(13):1199-1207. [doi: 10.1056/nejmoa2001316]
3. Zhu N, Zhang D, Wang W, Li X, Yang B, Song J, et al. A Novel Coronavirus from Patients with Pneumonia in China,
2019. N Engl J Med 2020 Feb 20;382(8):727-733. [doi: 10.1056/nejmoa2001017]
4. Wang D, Hu B, Hu C, Zhu F, Liu X, Zhang J, et al. Clinical Characteristics of 138 Hospitalized Patients With 2019 Novel
Coronavirus-Infected Pneumonia in Wuhan, China. JAMA 2020 Mar 17;323(11):1061-1069 [FREE Full text] [doi:
10.1001/jama.2020.1585] [Medline: 32031570]
5. Holshue ML, DeBolt C, Lindquist S, Lofy KH, Wiesman J, Bruce H, Washington State 2019-nCoV Case Investigation
Team. First Case of 2019 Novel Coronavirus in the United States. N Engl J Med 2020 Mar 05;382(10):929-936 [FREE
Full text] [doi: 10.1056/NEJMoa2001191] [Medline: 32004427]
6. Mahase E. Covid-19: WHO declares pandemic because of "alarming levels" of spread, severity, and inaction. BMJ 2020
Mar 12;368:m1036. [doi: 10.1136/bmj.m1036] [Medline: 32165426]
7. Anderson RM, Heesterbeek H, Klinkenberg D, Hollingsworth TD. How will country-based mitigation measures influence
the course of the COVID-19 epidemic? The Lancet 2020 Mar;395(10228):931-934. [doi: 10.1016/s0140-6736(20)30567-5]
8. Maor M, Howlett M. Explaining variations in state COVID-19 responses: psychological, institutional, and strategic factors
in governance and public policy-making. Policy Design and Practice 2020 Sep 25;3(3):228-241. [doi:
10.1080/25741292.2020.1824379]
9. Haffajee RL, Mello MM. Thinking Globally, Acting Locally — The U.S. Response to Covid-19. N Engl J Med 2020 May
28;382(22):e75. [doi: 10.1056/nejmp2006740]
https://www.jmir.org/2021/2/e26081 J Med Internet Res 2021 | vol. 23 | iss. 2 | e26081 | p. 9
(page number not for citation purposes)
XSL• FO
RenderXJOURNAL OF MEDICAL INTERNET RESEARCH Oehmke et al
10. Kettl DF. States Divided: The Implications of American Federalism for Covid-19. Public Adm Rev 2020 May
22;80(4):595-602 [FREE Full text] [doi: 10.1111/puar.13243] [Medline: 32836439]
11. Laestadius L, Wang Y, Ben Taleb Z, Kalan M, Cho Y, Manganello J. Online National Health Agency Mask Guidance for
the Public in Light of COVID-19: Content Analysis. JMIR Public Health Surveill 2020 May 26;6(2):e19501 [FREE Full
text] [doi: 10.2196/19501] [Medline: 32427103]
12. Aleta A, Martín-Corral D, Pastore Y Piontti A, Ajelli M, Litvinova M, Chinazzi M, et al. Modelling the impact of testing,
contact tracing and household quarantine on second waves of COVID-19. Nat Hum Behav 2020 Sep 05;4(9):964-971. [doi:
10.1038/s41562-020-0931-9] [Medline: 32759985]
13. Ngonghala CN, Iboi EA, Gumel AB. Could masks curtail the post-lockdown resurgence of COVID-19 in the US? Math
Biosci 2020 Nov;329:108452 [FREE Full text] [doi: 10.1016/j.mbs.2020.108452] [Medline: 32818515]
14. CDC COVID Data Tracker Internet. Centers for Disease Control and Prevention. 2020. URL: https://www.cdc.gov/
covid-data-tracker/#cases [accessed 2020-10-31]
15. Rader B, Scarpino SV, Nande A, Hill AL, Adlam B, Reiner RC, et al. Crowding and the shape of COVID-19 epidemics.
Nat Med 2020 Dec 05;26(12):1829-1834. [doi: 10.1038/s41591-020-1104-0] [Medline: 33020651]
16. Chin T, Kahn R, Li R, Chen J, Krieger N, Buckee C, et al. US-county level variation in intersecting individual, household
and community characteristics relevant to COVID-19 and planning an equitable response: a cross-sectional analysis. BMJ
Open 2020 Sep 01;10(9):e039886 [FREE Full text] [doi: 10.1136/bmjopen-2020-039886] [Medline: 32873684]
17. Browne A, Ahmad SSO, Beck C, Nguyen-Van-Tam J. The roles of transportation and transportation hubs in the propagation
of influenza and coronaviruses: a systematic review. J Travel Med 2016 Jan;23(1):a [FREE Full text] [doi:
10.1093/jtm/tav002] [Medline: 26782122]
18. CDC COVID-19 Response Team, Jorden MA, Rudman SL, Villarino E, Hoferka S, Patel MT, et al. Evidence for Limited
Early Spread of COVID-19 Within the United States, January-February 2020. MMWR Morb Mortal Wkly Rep 2020 Jun
05;69(22):680-684 [FREE Full text] [doi: 10.15585/mmwr.mm6922e1] [Medline: 32497028]
19. Schuchat A, CDC COVID-19 Response Team. Public Health Response to the Initiation and Spread of Pandemic COVID-19
in the United States, February 24-April 21, 2020. MMWR Morb Mortal Wkly Rep 2020 May 08;69(18):551-556 [FREE
Full text] [doi: 10.15585/mmwr.mm6918e2] [Medline: 32379733]
20. Fauver JR, Petrone ME, Hodcroft EB, Shioda K, Ehrlich HY, Watts AG, et al. Coast-to-Coast Spread of SARS-CoV-2
during the Early Epidemic in the United States. Cell 2020 May 28;181(5):990-996.e5 [FREE Full text] [doi:
10.1016/j.cell.2020.04.021] [Medline: 32386545]
21. Bushman D, Alroy KA, Greene SK, Keating P, Wahnich A, Weiss D, CDC COVID-19 Surge Laboratory Group;, et al.
Detection and Genetic Characterization of Community-Based SARS-CoV-2 Infections - New York City, March 2020.
MMWR Morb Mortal Wkly Rep 2020 Jul 17;69(28):918-922 [FREE Full text] [doi: 10.15585/mmwr.mm6928a5] [Medline:
32678072]
22. Maurano MT, Ramaswami S, Zappile P, Dimartino D, Boytard L, Ribeiro-Dos-Santos AM, et al. Sequencing identifies
multiple early introductions of SARS-CoV-2 to the New York City region. Genome Res 2020 Dec 22;30(12):1781-1788
[FREE Full text] [doi: 10.1101/gr.266676.120] [Medline: 33093069]
23. About DTW. Wayne County Airport Authority. 2020. URL: https://www.metroairport.com/about-dtw [accessed 2021-01-26]
24. Inslee Issues COVID-19 Emergency Proclamation. Office of the Washington Governor Jay Inslee. 2020 Feb 29. URL:
https://www.governor.wa.gov/news-media/inslee-issues-covid-19-emergency-proclamation [accessed 2020-11-05]
25. Inslee announces “Stay Home, Stay Healthy” order. Office of the Washington Governor Jay Inslee. 2020 Mar 23. URL:
https://www.governor.wa.gov/news-media/inslee-announces-stay-home-stay-healthy%C2%A0order [accessed 2020-11-05]
26. McNerthney C. Coronavirus in Washington state: A timeline of the outbreak through March 2020. KIRO 7 News. 2020
Apr 3. URL: https://www.kiro7.com/news/local/coronavirus-washington-state-timeline-outbreak/
IM65JK66N5BYTIAPZ3FUZSKMUE/ [accessed 2021-01-26]
27. Executive Order 2020-21 (COVID-19) – Rescinded. Office of Governor Gretchen Whitmer. 2020. URL: https://www.
michigan.gov/whitmer/0,9309,7-387-90499_90705-522626--,00.html [accessed 2021-01-26]
28. Haddad K. Michigan issues stay-at-home order amid coronavirus: Here’s what it means. Click On Detroit. Michigan issues
stay-at-home order amid coronavirus: Here’s what it means. Click on Detroit; 2020 . URL: https://www.clickondetroit.com/
news/2020/03/23/michigan-issues-stay-at-home-order-amid-coronavirus-heres-what-it-means/ [accessed 2021-01-26]
29. US Coronavirus Cases and Deaths. USA Facts. URL: https://usafacts.org/visualizations/coronavirus-covid-19-spread-map
[accessed 2020-11-01]
30. Javid B, Weekes MP, Matheson NJ. Covid-19: should the public wear face masks? BMJ 2020 Apr 09;369:m1442. [doi:
10.1136/bmj.m1442] [Medline: 32273278]
31. Greenhalgh T, Schmid MB, Czypionka T, Bassler D, Gruer L. Face masks for the public during the covid-19 crisis. BMJ
2020 Apr 09;369:m1435. [doi: 10.1136/bmj.m1435] [Medline: 32273267]
32. Cheng KK, Lam TH, Leung CC. Wearing face masks in the community during the COVID-19 pandemic: altruism and
solidarity. The Lancet 2020 Apr:1-2. [doi: 10.1016/S0140-6736(20)30918-1]
https://www.jmir.org/2021/2/e26081 J Med Internet Res 2021 | vol. 23 | iss. 2 | e26081 | p. 10
(page number not for citation purposes)
XSL• FO
RenderXJOURNAL OF MEDICAL INTERNET RESEARCH Oehmke et al
33. Dalton C, Corbett S, Katelaris A. Pre-Emptive Low Cost Social Distancing and Enhanced Hygiene Implemented before
Local COVID-19 Transmission Could Decrease the Number and Severity of Cases. SSRN Journal 2020 Mar 05:1-8. [doi:
10.2139/ssrn.3549276]
34. Weiner Z, Wong G, Elbanna A, Tkachenko A, Maslov S, Goldenfeld N. Projections and early-warning signals of a second
wave of the COVID-19 epidemic in Illinois. medRxiv. Preprint posted online July 7, 2020 2021. [doi:
10.1101/2020.07.06.20147868]
35. Liu M, Thomadsen R, Yao S. Forecasting the spread of COVID-19 under different reopening strategies. Sci Rep 2020 Nov
23;10(1):20367 [FREE Full text] [doi: 10.1038/s41598-020-77292-8] [Medline: 33230234]
36. Abbott G. Executive Order No GA-18 relating to the expanded reopening of services as part of the safe, strategic plan to
Open Texas in response to the COVID- 19 disaster. Legislative Reference Library of Texas. URL: https://lrl.texas.gov/
scanned/govdocs/Greg%20Abbott/2020/GA-18.pdf [accessed 2021-01-26]
37. Abbott G. Executive Order No GA-29 relating to the use of face coverings during the COVID- 19 disaster. Office of the
Texas Governor. URL: https://gov.texas.gov/uploads/files/press/
EO-GA-29-use-of-face-coverings-during-COVID-19-IMAGE-07-02-2020.pdf [accessed 2021-01-26]
38. Friend D. COVID-19 in Texas: A Timeline of Gov. Abbott’s Executive Orders and Case Numbers. The Texan. 2020 Sep
07. URL: https://thetexan.news/covid-19-in-texas-a-timeline-of-gov-abbotts-executive-orders-and-case-numbers/ [accessed
2021-01-26]
39. Solis J, Franco-Paredes C, Henao-Martínez AF, Krsak M, Zimmer S. Structural Vulnerability in the U.S. Revealed in Three
Waves of COVID-19. Am J Trop Med Hyg 2020 Jul;103(1):25-27 [FREE Full text] [doi: 10.4269/ajtmh.20-0391] [Medline:
32383432]
40. Taskinsoy J. Coronavirus Pandemic: The U.S. Induced Great Panic of the 21st Century. SSRN Journal 2020 May 26:1-15.
[doi: 10.2139/ssrn.3610749]
41. Smith S. Loving county, Texas, is one of three U.S. counties with zero Covid-19 cases. CNBC. 2020 Oct 23. URL: https:/
/www.cnbc.com/video/2020/10/23/loving-county-texas-is-one-of-three-counties-in-the-u-s-with-zero-covid-19-cases.html
[accessed 2021-01-26]
42. Li H, Jecker NS, Chung RY. Reopening Economies during the COIVD-19 Pandemic: Reasoning about Value Tradeoffs.
Am J Bioeth 2020 Jul 27;20(7):136-138. [doi: 10.1080/15265161.2020.1779406] [Medline: 32716790]
43. Fernandez M, Montgomery D. Businesses Chafing Under Covid-19 Lockdowns Turn to Armed Defiance. The New York
Times. 2020 May 13. URL: https://www.nytimes.com/2020/05/13/us/coronavirus-businesses-lockdown-guns.html [accessed
2020-11-13]
44. Six Arrested on Federal Charge of Conspiracy to Kidnap the Governor of Michigan. The United Stated Department of
Justice. 2020 Oct 8. URL: https://www.justice.gov/opa/pr/six-arrested-federal-charge-conspiracy-kidnap-governor-michigan
[accessed 2021-01-26]
45. Akin L, Gözel MG. Understanding dynamics of pandemics. Turkish Journal of Medical Sciences 2020 Apr
21;50(SI-1):515-519 [FREE Full text] [doi: 10.3906/sag-2004-133] [Medline: 32299204]
46. Johnson NPAS, Mueller J. Updating the accounts: global mortality of the 1918-1920 "Spanish" influenza pandemic. Bull
Hist Med 2002;76(1):105-115. [doi: 10.1353/bhm.2002.0022] [Medline: 11875246]
47. Government Response to Coronavirus, COVID-19. US Government. 2020. URL: https://www.usa.gov/coronavirus [accessed
2021-01-26]
48. Bergman A, Sella Y, Agre P, Casadevall A. Oscillations in U.S. COVID-19 Incidence and Mortality Data Reflect Diagnostic
and Reporting Factors. American Society of Microbiology 2020 Jul 14;5(4):1-6 [FREE Full text] [doi:
10.1128/mSystems.00544-20] [Medline: 32665331]
49. Greenblatt A. Will State Preemption Leave Cities More Vulnerable? Governing: The Future of States and Localities. 2020
Apr 3. URL: https://www.governing.com/now/Will-State-Preemption-Leave-Cities-More-Vulnerable.html [accessed
2021-01-26]
50. Oehmke JF, Moss CB, Singh LN, Oehmke TB, Post LA. Dynamic Panel Surveillance of COVID-19 Transmission in the
United States to Inform Health Policy: Observational Statistical Study. J Med Internet Res 2020 Oct 5;22(10):e21955
[FREE Full text] [doi: 10.2196/21955] [Medline: 32924962]
51. Oehmke J, Oehmke T, Singh L, Post L. Dynamic Panel Estimate-Based Health Surveillance of SARS-CoV-2 Infection
Rates to Inform Public Health Policy: Model Development and Validation. J Med Internet Res 2020 Sep 22;22(9):e20924
[FREE Full text] [doi: 10.2196/20924] [Medline: 32915762]
52. Post L, Kulasekere D, Moss C, Murphy R, Achenbach C, Ison M, et al. South Asia SARS-CoV-2 Surveillance System:
The Race to the Top Using Longitundinal Trend Analysis. JMIR Preprints. Preprint posted online Nov 13, 2020 2021. [doi:
10.2196/preprints.25753]
53. Post L, Argaw S, Jones C, Moss C, Resnick D, Singh L, et al. A SARS-CoV-2 Surveillance System in Sub-Saharan Africa:
Modeling Study for Persistence and Transmission to Inform Policy. J Med Internet Res 2020 Nov 19;22(11):e24248 [FREE
Full text] [doi: 10.2196/24248] [Medline: 33211026]
https://www.jmir.org/2021/2/e26081 J Med Internet Res 2021 | vol. 23 | iss. 2 | e26081 | p. 11
(page number not for citation purposes)
XSL• FO
RenderXJOURNAL OF MEDICAL INTERNET RESEARCH Oehmke et al
54. Post LA, Issa TZ, Boctor MJ, Moss CB, Murphy RL, Ison MG, et al. Dynamic Public Health Surveillance to Track and
Mitigate the US COVID-19 Epidemic: Longitudinal Trend Analysis Study. J Med Internet Res 2020 Dec 03;22(12):e24286
[FREE Full text] [doi: 10.2196/24286] [Medline: 33216726]
55. Metropolitan and Micropolitan Statistical Areas Population Totals and Components of Change: 2010-2019. The United
States Census Bureau. URL: https://www.census.gov/data/tables/time-series/demo/popest/
2010s-total-metro-and-micro-statistical-areas.html [accessed 2020-10-31]
56. Teutsch S, Thacker S. Planning a public health surveillance system. Epidemiol Bull 1995 Mar;16(1):1-6. [Medline: 7794696]
57. Home - Johns Hopkins Coronavirus Resource Center. Johns Hopkins University Coronavirus Resource Center. URL: https:/
/coronavirus.jhu.edu/ [accessed 2020-10-31]
58. Hansen LP. Large Sample Properties of Generalized Method of Moments Estimators. Econometrica 1982 Jul;50(4):1029.
[doi: 10.2307/1912775]
59. Arellano M, Bond S. Some Tests of Specification for Panel Data: Monte Carlo Evidence and an Application to Employment
Equations. The Review of Economic Studies 1991 Apr;58(2):277-297. [doi: 10.2307/2297968]
60. Gaspar E, Goulding A, Seal E, Vonderhaar J. How Texans celebrated July Fourth during the coronavirus pandemic. The
Texas Tribune. 2020 Jul 05. URL: https://www.texastribune.org/2020/07/05/july-4-texas-coronavirus/ [accessed 2021-01-26]
61. Montgomery D, Fernandez M. 44 Texas Students Have Coronavirus After Spring Break Trip. The New York Times. 2020
Apr 01. URL: https://www.nytimes.com/2020/04/01/us/coronavirus-texas-austin-spring-break-cabo.html [accessed
2020-11-13]
62. Mangrum D, Niekamp P. College Student Contribution to Local COVID-19 Spread. SSRN Journal. Preprint posted online
May 21, 2020 2021 [FREE Full text] [doi: 10.2139/ssrn.3606811]
63. Visiting Beaches and Pools. Centers for Disease Controls and Prevention. URL: https://www.cdc.gov/coronavirus/2019-ncov/
daily-life-coping/beaches-pools.html [accessed 2021-01-26]
64. Carter S. Dallas County Adds 5,000 New COVID-19 Cases to July’s Count. Dallas Observer. 2020 Aug 18. URL: https:/
/www.dallasobserver.com/news/dallas-county-counts-5000-additional-cases-thanks-to-covid-19-testing-backlog-11935823
[accessed 2021-01-26]
65. Minneapolis, MN Weather History. Weather Underground. URL: https://www.wunderground.com/history/monthly/us/mn/
minneapolis [accessed 2020-11-01]
66. Millman J. Cuomo Imposes Curfew on NY Bars, Restaurants and Gyms, Limits Private Home Gatherings to 10. NBC New
York. 2020 Nov 12. URL: https://www.nbcnewyork.com/news/coronavirus/
new-ny-nj-cases-soar-nearly-50-in-a-week-u-s-could-hit-20-million-cases-by-christmas/2716714/ [accessed 2021-01-26]
Abbreviations
DPD: dynamic panel data
GMM: generalized method of moments
ISO: International Standards Organization
Edited by G Eysenbach; submitted 01.12.20; peer-reviewed by M Elbattah; comments to author 22.12.20; revised version received
12.01.21; accepted 20.01.21; published 09.02.21
Please cite as:
Oehmke TB, Post LA, Moss CB, Issa TZ, Boctor MJ, Welch SB, Oehmke JF
Dynamic Panel Data Modeling and Surveillance of COVID-19 in Metropolitan Areas in the United States: Longitudinal Trend Analysis
J Med Internet Res 2021;23(2):e26081
URL: https://www.jmir.org/2021/2/e26081
doi: 10.2196/26081
PMID:
©Theresa B Oehmke, Lori A Post, Charles B Moss, Tariq Z Issa, Michael J Boctor, Sarah B Welch, James F Oehmke. Originally
published in the Journal of Medical Internet Research (http://www.jmir.org), 09.02.2021. This is an open-access article distributed
under the terms of the Creative Commons Attribution License (https://creativecommons.org/licenses/by/4.0/), which permits
unrestricted use, distribution, and reproduction in any medium, provided the original work, first published in the Journal of
Medical Internet Research, is properly cited. The complete bibliographic information, a link to the original publication on
http://www.jmir.org/, as well as this copyright and license information must be included.
https://www.jmir.org/2021/2/e26081 J Med Internet Res 2021 | vol. 23 | iss. 2 | e26081 | p. 12
(page number not for citation purposes)
XSL• FO
RenderXYou can also read