Breeding Stage and Environmental Factors Affect Prey Selection by Greater Crested Terns Off Southeast Australia
←
→
Page content transcription
If your browser does not render page correctly, please read the page content below
Breeding Stage and Environmental Factors Affect
Prey Selection by Greater Crested Terns Off
Southeast Australia
Katrin Quiring ( katrin.quiring@students.mq.edu.au )
Macquarie University https://orcid.org/0000-0002-3550-6031
Gemma Carroll
University of Washington
Eckhard Heymann
Georg-August-Universitat Gottingen
Curtis Champion
Southern Cross University
Robert Harcourt
Macquarie University
Original paper
Keywords: Thalasseus bergii, greater crested tern, seabird, marine predator, diet composition, diet
sampling, non-invasive monitoring, digital photography
Posted Date: February 15th, 2021
DOI: https://doi.org/10.21203/rs.3.rs-193145/v1
License: This work is licensed under a Creative Commons Attribution 4.0 International License.
Read Full License
Version of Record: A version of this preprint was published at Marine Biology on August 18th, 2021. See
the published version at https://doi.org/10.1007/s00227-021-03947-3.
Page 1/26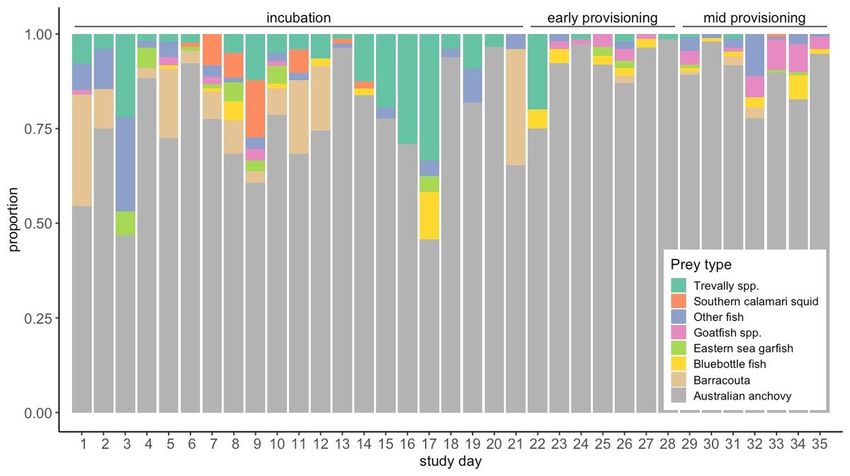
Abstract
Variation in the diet of marine predators such as seabirds can be used to track environmentally-driven
changes in ocean ecosystems. However, studies of predator diet must account for intrinsic influences on
prey selection, such as changing nutritional requirements during breeding. Using digital photography, we
investigated how the type and size of prey brought back to the colony by greater crested terns
(Thalasseus bergii) changed in relation to breeding stage, and to variation in oceanographic conditions
around Montague Island, Australia (36°15’S, 150°13’E). 2469 prey items were identified to species or
family level over 35 consecutive days of photo-sampling in 2018. Australian anchovy (Engraulis
australis), a surface-schooling clupeid fish, was the most abundant prey returned to the colony during all
breeding stages (84.5%). The proportion of anchovy increased from 77.0% when birds were provisioning
their adult partners during incubation, to 92.4% when they were provisioning chicks, suggesting selective
foraging behaviour on this energy-dense species as a means to facilitate rapid chick growth. Anchovy
size was largest during incubation (91.1 ± 14.9 mm), smallest during early chick provisioning (71.8 ± 11.0
mm), and increased slightly during mid-provisioning (79.6 ± 11.9 mm), indicating adaptive prey selection
that is matched to the physical requirements of different breeding stages. The proportion of anchovy prey
was also influenced by extrinsic environmental factors, with anchovy becoming more dominant with
increasing local sea surface temperatures, up to ~17.5°C. Our findings highlight the importance of
examining both intrinsic and extrinsic determinants of diet composition across breeding stages in seabird
populations.

Introduction
Upper trophic-level predators such as seabirds can act as sentinels of changes in marine ecosystems,
with their demography, behaviour and physiology reflecting variability in oceanographic and ecological
conditions (Hazen et al. 2019). For example, temporal changes in the occurrence, abundance and size of
prey that seabirds consume can be used as indicators of food availability and ecosystem structure
(Suryan et al. 2002; Parsons et al. 2008), and can provide an early warning of anthropogenic impacts on
food webs (Green et al. 2015). Monitoring seabird diets can therefore be an important tool to inform
conservation biology and ecosystem-based fisheries management (e.g. Lorentsen et al. 2018; Thayne et
al. 2019; Hazen et al. 2019).

During the breeding season, the foraging range of seabirds is constrained by central-place foraging,
which requires individuals to return to the colony between foraging trips to incubate eggs or provision
their young (Cairns 1988). This means that birds must forage efficiently on available prey that is within a
relatively short distance of the colony. Optimal foraging theory for central-place foraging predicts that
single-prey loaders (species including guillemots and terns that carry a single whole prey item per
foraging trip back to the colony) should maximise the energy load per unit foraging by providing larger, or
energetically richer prey to their chick than they feed themselves (Orians and Pearson 1979). For instance,
adult crested terns (Sterna bergii) conduct short foraging trips close to the colony to provision their
offspring several times a day with small single prey items (McLeay et al. 2010). This behaviour is
                                                 Page 2/26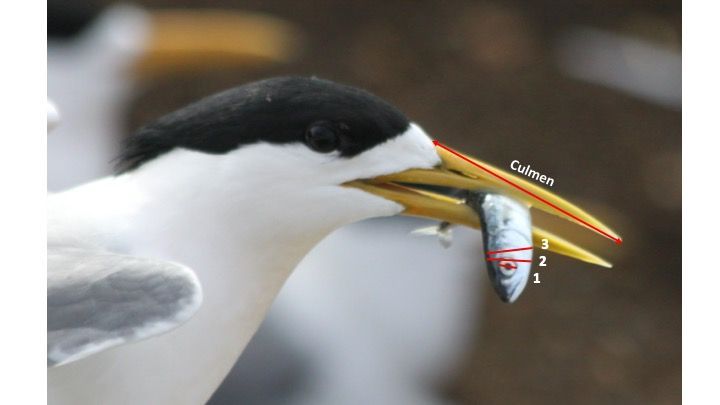
assumed to be adjusted to energetic requirements and ingestion capabilities of chicks. Therefore, during
provisioning, single-prey loaders should bring back small fatty fish that are energy dense, selecting
increasingly large fish as the chick grows (Batchelor and Ross 1984). This contrasts with the foraging
strategy of multiple-prey loaders (e.g. auks carry multiple prey items per foraging trip in the bill;
Procellariiformes regurgitate stomach oil), which do not have the same constraints on the selection of
individual prey items, but should maximise the energy load per foraging trip, especially if they travel large
distances from the breeding colony (Orians and Pearson 1979).

While intrinsic constraints imposed by provisioning requirements may influence prey selection during
breeding, the availability of prey also varies with extrinsic environmental conditions. Temporal variation in
oceanographic variables can have a strong effect on the foraging success of seabirds, which can impact
their body condition, growth and ultimately reproductive performance (Harwood et al. 2015). This is
particularly true when birds undertake central place foraging during breeding, as they are restricted to
finding prey within a limited distance from the colony and cannot move to more favourable foraging
areas. For instance, a long-term study on king penguins suggests that anomalies in sea surface
temperature (SST) adversely affected breeding success as birds had to dive deeper and farther from the
colony to forage on favoured prey (Bost et al. 2015). Similarly, a shift in the diet of black guillemots
(Cepphus grylle) from Arctic cod (Arctogadus glacialis) to demersal fish during a period of decreasing sea
ice and increasing SST, led to slower chick growth, low fledgling mass and an increase in chick starvation
(Divoky et al. 2015). In addition, prey availability may be altered at shorter time scales, such as in
response to weather (White 2008). Prey capture under adverse weather conditions can be mediated by
poor flight performance, or reductions in prey detectability or catchability (Elliott et al. 2014; Kogure et al.
2016). There is evidence that, for example, high wind speeds influence foraging success in seabirds, as
indicated by a decrease in dominant prey, as well as a reduction in prey energetic value and size (Stienen
et al. 2000; Howells et al. 2017). Accordingly, the interplay of both intrinsic (i.e. physical requirements of
chicks vs. adults) and extrinsic (environmental variability) processes affecting diet composition should
be accounted for when interpreting seabird diet data.

Some seabird species bring whole fish back to the colony in their bill to provision their chick or partner at
the nest. In the past, experienced researchers have used binoculars to directly identify prey types, a
technique that facilitates large samples being collected over short periods, and allows documentation of
seasonal variation in prey choice (Rodway and Montevecchi 1996). While this sampling approach is
feasible in low diversity ecosystems where birds bring back only a few types of prey, it is challenging in
complex food webs where birds consume a broad suite of prey types or carry multiple prey items in their
bill (Barrett et al. 2007). This method is limited by observer bias that can result in the misidentification of
prey and can undermine taxonomic resolution, especially when there are no independent means by which
to verify observations (Larson and Craig 2006). Recent advances in digital photography overcome many
traditional observer-based limitations, with the potential to provide a verifiable, non-invasive tool to study
seabird diets. Photographing birds with prey at the colony allows researchers to identify a large number
of prey items with greater taxonomic precision and to estimate the size of prey being selected, while
facilitating re-analysis and verification of species if necessary (Gaglio et al. 2017).
                                                    Page 3/26
Greater crested terns (Thalasseus bergii) are small coastal seabirds with an extensive breeding range that
encompasses the Australian coastline. Terns are nearshore foragers that mostly acquire food by dipping
onto the sea surface or diving up to one metre below the surface (Crawford et al. 2005). During breeding,
they are central place foragers with adult pairs taking turns to leave the colony to provision themselves
and to bring prey back for their partner or offspring. During incubation, a single-prey item is brought to the
partner for display or as a gift in courtship. Assuming that the prey brought back for the partner is
equivalent to the prey consumed by birds at sea, this is an indication of the diet composition of the adult
population. Once the chick hatches, both parents deliver single-prey items to their offspring. The bill-
loading behaviour of terns makes it possible to quantify trends in prey type and size using a digital
camera and a telephoto lens without disturbing the colony. Digital photography has previously been used
to describe the diet of T. bergii in South Africa, doubling the known diversity of prey species compared to
traditional regurgitate sampling, and providing accurate and precise measurements of prey length (Gaglio
et al. 2017).
This study aims to identify intrinsic (i.e. physical requirements of chicks vs. adults) and extrinsic
(environmental) determinants of diet composition of greater crested terns at a key southern-eastern
Australian breeding site, Montague Island, during the 2018 breeding season. Specifically, we use digital
photography as a non-invasive sampling technique to assess variation in diet composition (prey type and
size) between breeding stages (incubation and chick provisioning), and to determine whether short-term
variability in environmental covariates influences diet composition. First, we investigate the trade-off
made by single-prey loaders between maximising energy intake per foraging trip, and ensuring that prey
can be physically swallowed by the chick (Orians and Pearson 1979). We predict that (1) the proportion
of anchovy in the diet will increase during provisioning stages, because this is an abundant, lipid-rich prey
that can facilitate the rapid growth of small chicks (Batchelor and Ross 1984). Similarly, we predict that
(2) anchovy standard length (SL) will decrease during early provisioning when chicks are small, then
increase during mid-provisioning as parents adjust prey size in accord with the ingestion capabilities of
growing chicks. Second, we analyse shifts in diet composition of greater crested terns in response to
short-term variation in environmental variables. Specifically, we predict that (3) the proportion of anchovy
will decrease under adverse environmental conditions such as strong winds, high SST or high waves,
which are factors likely to influence the availability or catchability of surface-schooling prey.
Methods
Study site and species
This study was undertaken on Montague Island (36°15’S, 150°13’E), an 81 ha nature reserve located
approximately 9 km off the coast of southeast New South Wales, Australia. Greater crested terns nest in
the open on the island at high densities. The tern colony on Montague Island comprises multiple sub-
colonies; this study was conducted on the largest and most accessible one, consisting of ca. 1000
breeding pairs in 2018 (Fig. 1a; counted from a wide-angle photograph of the colony taken on 20 October
2018). The study was conducted over 35 consecutive days from 2 October to 5 November during the
Page 4/262018 greater crested tern breeding season. As chicks hatch synchronously across the colony, the first
chick sighting was selected as the day of hatching and the start of provisioning (here: 23 October 2018 -
study day 22). Breeding stages were classified as incubation, early provisioning and mid provisioning,
and the study covered the full period from incubation to mid provisioning. During incubation, partners
alternatively incubate the nest and bring single-prey items to their mate for courtship and pair-bonding.
Early provisioning comprised the week following hatching during which both parents provision the chick
in the nest cup, and mid provisioning the subsequent week when chicks start to move around the nest
(Gaglio et al. 2018).
Photographic sampling
Greater crested tern diet was investigated using digital photography to assess differences between adults
and chicks in the size and type of prey consumed over the course of the study period. Adult terns carrying
prey in their bill were photographed as they returned to the colony (Fig. 1a). Photographs were taken
using a Canon (Tokyo, Japan) 50D camera fitted with a Canon EF 70-300mm f/4.0-5.6 IS USM tele zoom
lens. Camera settings were mostly applied following Gaglio et al (2017), with the following settings: i)
shutter speed priority 1/2500–1/4000 s depending on light conditions, ii) automatic ISO, iii) high-speed
continuous shooting, iv) autofocus on AI servo (autofocus system for continuous tracking of moving
subjects), and v) large Jpeg file format. The tele zoom lens was set to autofocus with the image stabiliser
on.
Every day, photos of birds arriving with prey at the colony were taken continuously during three two-hour
sessions (morning session from 0700–0900 hr, midday session from 1100–1300 hr and afternoon
session from 1500–1700 hr AEST; after daylight savings from 0800–1000 hr, 1200–1400 hr and 1600–
1800 hr AEDT). Photos were taken from a different vantage point during each session to account for sun
position. Photos were taken as a photo-set consisting of three images, with the sharpest selected for prey
identification and measurements. The distance between the vantage points and the closest bird was
approximately 5 m. The birds did not show any sign of stress or disturbance due to the presence of the
photographer.
Identification of prey species
All blurred and unclear images (due to e.g. distance, position of prey in the bill, lighting etc.) were
excluded from the analyses. From the remaining photographs, prey was identified to the highest possible
taxonomic resolution, based on morphological characteristics (Fig. 1b-k). Fish identification was
undertaken by comparing photographs with published images and fish identification guides from the
Australian Museum (https://australian.museum/learn/animals/fishes), and subsequently verified by
multiple species experts from the NSW Department of Primary Industries and the University of New South
Wales, Australia.
Estimation of anchovy size
Page 5/26Australian anchovy (E. australis) is a common species in the diet of crested terns in Australia (McLeay et
al. 2009a). Therefore, this species was chosen as a standard by which to compare the size of prey
brought back to the colony during different breeding stages. However, with prey tending to flex in the bill,
direct measurements of standard length (SL; the length from the tip of the snout to the posterior end of
the hypural plate) from images may underestimate true fish length (Gaglio et al. 2017). Nevertheless,
accurate estimates of SL can be obtained by extrapolating from measurements of individual body parts
such as eye diameter, head width and operculum width that are easier to measure from photographs.
Accordingly, for each image, the ‘line selection tool’ in the image analysis software IMAGEJ (Schneider et
al. 2012) was used to estimate eye diameter, head and operculum width of each fish by scaling the pixel
length in the image to the mean culmen length of crested terns (61.2 mm; Crawford et al. 2005). Using log
linear allometric regressions, three estimates of SL were obtained (see Table S1 in Gaglio et al. 2017):
1. Eye diameter (E): SL = -68.16 + 91.95 x ln(E)
2. Head width (H): SL = -168.70 + 112.29 x ln(H)
3. Operculum width (O): SL = -230.44 + 121.60 x ln(O)
The arithmetic mean of these three measurements was used in further analyses including anchovy SL.
An example of the application in IMAGEJ is provided in Fig. 2 and detailed information on the accuracy
and precision of the methodology is given in Gaglio et al (2017).
Importantly, Gaglio et al (2017) used the European anchovy (E. encrasicolus) to create regressions for
anchovy eye diameter, head and operculum width, and these equations were applied to measurements of
Australian anchovy in this study. The morphometric characteristics of both species are very similar,
although the European anchovy is slightly larger than the Australian anchovy (average length: 13.5 cm
vs. 12 cm; Whitehead et al. 1988). Since this study aims to compare relative fish length within the sample
rather than illustrating variability in absolute fish length, regression equations calculated for European
anchovy were used with the caveat that these measurements may consistently bias the true length of
Australian anchovy photographed in this study.
Environmental factors
Key environmental variables that are likely to influence either the distribution or abundance of prey
species in the greater crested terns’ foraging range, and/or the terns’ ability to catch them were selected
for analysis. These included wind speed, sea surface temperature (SST) and wave height. Wind speed
(km/h) was recorded by the Australian Bureau of Meteorology weather station located at the lighthouse
on Montague Island (www.bom.gov.au). Wind measurements were made using an automatic
anemometer with an accuracy of +/- 5% of the wind speed for wind speeds greater than or equal to 10
m/s. Wind data were downloaded at a 30 min resolution, each measurement representing the average of
the 10 min period prior to the observation time.
Gap-free daily records of satellite-derived SST at a 0.05° x 0.05° spatial resolution were measured by the
UK Met Office’s Operational Sea Surface Temperature and Ice Analysis (OSTIA) system (downloaded from
Page 6/26marine.copernicus.eu). Based on previous observations of the tern’s foraging range from Montague
Island (O’Hara 2016), SST values were averaged across an area spanning 35° to 37° north to south, from
the coast out to the edge of the continental shelf (i.e. 200 m depth isobath). Because SST was available
at a daily temporal resolution, daily values were assigned to multiple photography sessions within a day.
Wave height (m) was recorded by the NSW Department of Planning, Industry and Environment’s (DPIE)
Batemans Bay offshore Waverider buoy (35°44'25”, 150°19'03”; https://mhl.nsw.gov.au/Station-BATBOW;
approximately 53 km north of Montague Island). Data were recorded in bursts (lasting approximately 34
minutes long starting on the hour) at 0.5-second intervals. Wave height for each of these periods is
defined as the mean height of the largest 33% of waves.
Previous GPS tracking work on Montague Island showed that tern foraging trips last an average of two
hours (O’Hara 2016). Hence any photo taken at the colony during a two-hour sampling period could
reflect foraging conditions up to two plus hours earlier than the actual sampling time. Therefore, wind
and wave data were assigned to a photo session by taking an average of each variable across a four-
hour period starting two hours prior to each session.
Data analysis and statistics
The number of each prey species as a proportion of the total number of prey photographed throughout
the study period was calculated to quantify the diet composition of greater crested terns during the 2018
breeding season on Montague Island. Key prey species, i.e. species making up > 1% of the diet, were
identified to simplify graphical illustrations and statistical analyses. The proportion of each prey type was
calculated for each two-hour photo session, and linked to information on breeding stage (incubation,
early provisioning, mid provisioning) to compare prey brought back for adults (during incubation), and for
chicks (during provisioning stages).
A chi-squared goodness-of-fit test was conducted to assess differences in diet composition between
incubation and chick rearing. A generalised linear mixed model (GLMM) with beta error structure and logit
function was used to investigate the effect of breeding stage on the proportion of anchovy returned to the
breeding colony by adult terns. Prior to analysis, the response variable (anchovy proportion) was
compressed to avoid absolute values of zero or one by taking y = (y*(n-1) + 0.5)/n, where n is the sample
size (Smithson and Verkuilen 2006). The model was fitted in R using the package ‘glmmTMB’ (version
1.0.1; Brooks et al. 2017). Similarly, a linear mixed model (LMM; R package ‘lme4’; Bates et al. 2015) was
used to investigate the effect of breeding stage on the dependent variable anchovy SL. Each of the
models included breeding stage (three levels: incubation, early provisioning, mid provisioning) as fixed
term and study day (N = 35 days) as crossed random effect to account for the repeated three-session per
day design. Finally, a post-hoc test was performed using the package ‘emmeans’ (version 1.4.6; Lenth
2020) to investigate the effect within each breeding stage category. Results were Tukey-adjusted for
multiple testing. For all analyses, model assumptions were checked following Zuur et al (2009).
Page 7/26To visualise differences in prey composition in relation to breeding stage, a non-metric multidimensional
scaling plot (NMDS) was generated using the R package ‘vegan’ (Oksanen 2011). NMDS is an ordination
technique to represent the position of data points in multidimensional space using distance measures
and a reduced number of dimensions (typically 2). The Bray-Curtis dissimilarity index was used to create
a distance matrix that reflects the multidimensional distance between data points with objects grouped
closer together being more similar. Ellipses were plotted to depict the centroid and inertia of each
breeding stage.
Generalised additive mixed models (GAMMs) using a beta regression and logit function were used to
assess the influence of environmental variables (SST, wave height, wind speed) on the proportion of prey
species in the diet. GAMMs, as an extension to GLMMs, allow an estimation of potential non-linear
relationships between continuous explanatory variables and the response. The models were fitted using
the R package ‘mgcv’ (version 1.8–31; Wood 2006). Smoother terms were applied to explanatory
environmental variables and were generated using regression splines. Explanatory variables also
included breeding stage as a fixed effect and study day as crossed random effect to account for
intraclass correlations among day-specific sampling events. An alpha level of 0.05 was used to determine
statistical significance. All statistical analyses were carried out in R (v3.5.3; R Development Core Team
2017).
Results
Diet composition
Over the 35 consecutive days of photo sampling, 3280 photo-sets were taken, yielding images of 2469
prey items identifiable to species or family level. 1265 prey items were identified during incubation and
1204 items during provisioning (early provisioning: n = 482, mid provisioning: n = 722 prey items). Single
prey items brought back to the colony were almost exclusively fish, with only one cephalopod species
identified during the 2018 breeding season (Table 1).
Seven main prey types were identified of which Australian anchovy (84.5%) was the dominant species
followed by barracouta (Thyrsites atun; 4.9%), trevally spp. (Centrolophidae spp.; 3.5%), goatfish spp.
(Mullidae spp.; 1.9%), bluebottle fish (Nomeus gronovii; 1.4%), southern calamari squid (Sepioteuthis
australis; 1.1%) and eastern sea garfish (Hyporhamphus australis; 1.1%; Table 1). Remaining prey items
making up a total abundance of < 1% over the breeding season were summarised as ‘other fish’ to
simplify graphical illustration.
Page 8/26Table 1
Numbers and proportions of prey species photographed in the bills of greater crested terns returning to
the colony on Montague Island in 2018 according to the breeding stage of the terns. A total of 2469 prey
items were identifiable to species or family level of which 1265 prey were identified during incubation
(adult diet) and 1204 during provisioning stages (chick diet).
Common Scientific name Family adult % chick % total %
name
N N N
Australian Engraulis Engraulidae 974 77.0 1112 92.4 2086 84.5
anchovy
australis
Barracouta Thyrsites atun Gempylidae 114 9.0 6 0.5 120 4.9
Trevally Indet. spp. Centralophidae 76 6.0 10 0.8 86 3.5
spp.
Goatfish Indet. spp. Mullidae 7 0.6 40 3.3 47 1.9
spp.
Bluebottle Nomeus Nomeidae 12 0.9 22 1.8 34 1.4
fish gronovii
Eastern sea Hyporhamphus Hemiramphidae 20 1.6 7 0.6 27 1.1
garfish
australis
Southern Sepioteuthis Loliginidae 27 2.1 1 0.1 28 1.1
calamari
squid australis
Redbait Emmelichthys Emmelichthyidae 22 1.7 0 0.0 22 0.9
nitidus
King gar Scomberesox Scomberesocidae 7 0.6 1 0.1 8 0.3
saurus
Silver Scorpis Scorpididae 5 0.4 2 0.2 8 0.3
sweep lineolata
Pilotfish Naucrates Carangidae 1 0.1 1 0.1 2 0.1
ductor
Flying fish Indet. spp. Exocoetidae 0 0.0 1 0.1 1 0.04
spp.
Anchovy was the most common prey during all breeding stages but the diet was more diverse during
incubation compared to early provisioning (Fig. 3–4). During incubation, in addition to anchovy, other
prey such as barracouta, trevallies and southern calamari squid were frequently brought back to the
colony but their abundance decreased once chicks hatched. In contrast, species such as bluebottle fish
and goatfish occurred more frequently in the diet of crested terns provisioning chicks, compared to
incubation (Table 1).
Page 9/26There was a significant difference in the proportion of anchovy between incubation (adult diet) and chick
provisioning (Chi-square test, X = 13.72, P < 0.01), with terns showing a lower preference for anchovy
when bringing prey back to the adult partner for courtship or display. Specifically, the mean proportion of
anchovy in the diet increased significantly from 77.0% to 92.9 % once chicks hatched (early provisioning).
During mid provisioning the proportion of anchovy was 91.9%. This was significantly higher than during
incubation, but not significantly different from early provisioning (Fig. 5a). Statistical results for
differences in anchovy proportions between breeding stages are summarised in Table 2.
Table 2
Effect of breeding stage (incubation, early provisioning, mid provisioning) on the proportion of anchovy in
the diet of greater crested terns in 2018. Mean (%) anchovy proportion and Tukey test adjusted p-values
from comparisons across breeding stages are presented.
Dependent Breeding Mean Estimate Std. z-ratio p-value p-value
variable stage (%) Error
Early Mid
prov. prov.
Anchovy Incubation 77.0 -0.957 0.277 -3.459 < 0.01 0.046
proportion
Early prov. 92.9 -0.648 0.268 -2.414 0.62
Mid prov. 91.9 0.309 0.332 0.931
Anchovy size
Based on measurements from 423 suitable images, the standard length (SL) of anchovies brought back
to the colony ranged from 19.7 mm to 143.4 mm. Anchovies were largest during incubation when birds
were bringing fish back for their partner (mean ± SD = 91.1 ± 14.9 mm, n = 193). There was a significant
decrease in anchovy SL to a mean size of 71.8 ± 11.0 mm, n = 84 during early provisioning (Fig. 5b),
suggesting a preference for smaller sized fish when provisioning small chicks. Anchovy SL increased
slightly to 79.6 ± 11.9 mm, n = 146 during mid provisioning which was significantly smaller than
incubation, but not significantly different from the early provisioning stage (Table 3).
Table 3
Effect of breeding stage on anchovy standard length (mm) estimated from photo-samples (n = 423) of
greater crested terns in 2018. Mean (SD) and Tukey test adjusted p-values from comparisons across
three breeding stages, incubation (n = 193), early provisioning (n = 84), and mid provisioning (n = 146) are
presented.
Dependent Breeding Mean (SD) Estimate Std. z- p-value p-value
variable stage mm Error ratio
Early Mid
prov. prov.
Anchovy SL Incubation 91.1 (14.9) 18.24 5.18 3.52 < 0.01 0.05
Early prov. 71.8 (11.0) 12.07 4.93 2.45 – 0.58
Mid prov. 79.6 (11.9) -6.17 6.15 -1.00 – –
Page 10/26Diet composition in relation to environmental factors
The GAMM revealed that the proportion of anchovy in the diet of greater crested terns increased with
warmer SSTs, with the rate of increase slowing slightly at SSTs above 17.5°C (Fig. 6a). None of the
environmental variables wind speed or wave height had a significant influence on the proportion of
anchovy returned to the breeding colony (Table 4).
Table 4
Effect of environmental variables (SST, wave height, wind speed) on the proportion of anchovy in the diet
of greater crested terns using generalised additive mixed models (GAMMs). GAMM results include
breeding stage as fixed effect. Shown are the estimated degrees of freedom (edf), chi square and p-
values for each environmental parameter, as well as the percent deviance explained as measure of model
performance.
Dependent variable Environmental variable edf Chi-square p-value Deviance explained
(smooth term)
Anchovy proportion SST 1.54 10.57 0.02 33 %
Wave height 1.75 1.68 0.41 36.2 %
Wind speed 2.22 3.67 0.22 44.7 %
Discussion
Variation in the diet of marine predators can give important insights into variability in marine ecosystems
(Hazen et al. 2019). However, when making inferences from predator diets, it is important to disentangle
intrinsic drivers such as provisioning requirements on prey selection from extrinsic drivers such as
environmental influences on prey availability. This study quantified the type and size of prey exploited by
a marine predator, the greater crested tern, during the 2018 breeding season on Montague Island,
Australia using photography of prey items brought back to the colony. In order to understand the interplay
of intrinsic and extrinsic processes determining diet composition of this colonial seabird, prey selection
relating to constraints imposed by breeding stage were investigated alongside the effects of daily
variability in environmental conditions.
Prey composition and size
Consistent with findings on diet composition of crested terns from diverse geographic locations and
oceanographic systems, small surface-schooling clupeids, in this case anchovies, were the most
abundant prey returned to the colony during the breeding season (Walter et al. 1987; Chiardia et al. 2002;
McLeay et al. 2009a; Gaglio et al. 2018). Despite the dominance of anchovy in the diet during this study,
greater crested terns still varied the type of prey caught at different stages of the breeding season. This
flexibility and the differences in diet composition between adults and chicks are likely to reflect the need
for terns to select appropriately sized prey to feed chicks during provisioning, as well as variation in the
Page 11/26availability of different prey types within the terns’ foraging range at distinct times during the study
period.
Barracouta - the second most abundant prey in the diet in our study – is also an important prey species
of crested terns in South Australia (McLeay et al 2009a). Barracouta form large schools that feed on krill,
squids and small fishes such as anchovy (Bray and Schultz 2020). Barracouta in southern NSW spawn in
late winter (July-August) which may explain the occurrence of smaller (juvenile) barracouta in the diet of
adult crested terns at the onset of the spring breeding season, but they may be too large for small chicks
to swallow later in the season. Some demersal fish species, like bluebottle fish, are pelagic as juveniles,
occurring near the sea surface where they are captured by crested terns at this life stage (Bray 2020). The
southern calamari squid, in contrast, is a demersal species found in shallow inshore waters from the
surface to 10 m depth (Norman 2000), making them available to seabirds foraging near the shore.
The proportion and size of anchovy returned to the breeding colony varied between incubation and chick
provisioning, with chicks consuming a significantly higher proportion of anchovy than adults during early
and mid provisioning. The high nutritional quality of clupeids like anchovy (Batchelor and Ross 1984,
Pichegru et al. 2007) has been suggested to explain ontogenetic differences in diet composition between
adults and chicks in greater crested terns in South Australia and the Benguela system in southwest Africa
(McLeay et al. 2009b; Gaglio et al. 2018). Similar trophic segregation between adult and chick diets is
found in other seabird species including great skuas (Stercorarius skua), sooty terns (Onychoprion
fuscatus) and cape petrels (Daption capense) (Cherel et al. 2008; Fijn et al. 2012; Votier et al. 2003). We
assume therefore that crested terns in this study selectively foraged higher trophic level (high quality)
prey to provide their offspring in order to facilitate chick growth, which was different from the prey
selected for an adult partner during incubation.
The differences in prey selection in this study highlight the ability of seabirds to make flexible foraging
decisions based on prey quality, in order to maximise the growth and survival of their offspring. Previous
work has shown that diet composition had a significant effect on chick growth and survival in kittiwakes
with higher proportions of lipid-rich sandeel positively affecting daily growth rates in chicks (Christensen-
Dalsgaard et al. 2018). Furthermore, an experimental study showed that feeding nestlings a lipid-poor
diet impaired chick mass and cognitive abilities which likely accounted for an increase in mortality and
low recruitment (Kitaysky et al. 2006). Similarly, the “junk-food hypothesis” has been proposed as the
cause of breeding failure in a colony of common guillemots (Uria aalge) in the North Sea, following a
switch in chick diets from high quality sandeel to sprat which is of significantly lower energy density
(Wanless et al. 2005). In order to determine whether anchovy served as high-quality food facilitating
offspring growth and survival in terns on Montague Island, future research should investigate chick body
condition in relation to the proportion of anchovy returned to the colony each day. Although poorly
studied and applied, methods of quantifying body condition non-invasively have been tested in free-living
birds, for instance using thermal cameras to remotely link body temperature to physiological state (Jerem
et al. 2018).
Page 12/26Anchovies were smallest during chick rearing. Due to their relatively small gullet, hatchlings are limited in
the size of prey they can swallow and this means parents need to select prey according to the chick’s
capability. As chicks grow, parents may need to adjust to the increasing energetic requirements. As
predicted by central-place foraging theory for single-prey loaders, adults may either increase the delivery
rate or provide larger prey to growing chicks. The observed increase in anchovy size with chick age
supports previous findings that there is size-selective predation by adult terns through the breeding
season in response to changing energetic demands of nestlings (Hulsman et al. 1989; Shealer 1998;
McLeay et al. 2009a; Gaglio et al. 2018). However, while these findings suggest active prey selection by
adult terns in response to breeding stage, the influence of spatio-temporal availability of prey on diet
composition should not be discounted.
Environmental factors
Environmental characteristics, such as SST, drive the distribution and abundance of schooling fish, and
thus the availability of prey to upper trophic levels in the ocean (Bertrand et al. 2008). In this study, SST
was positively correlated with the proportion of anchovy returned to the breeding colony. In an earlier
study at the same site, Carroll et al (2016) concluded that reduced prey capture of forage fish by little
penguins (Eudyptula minor) associated with very low SSTs might reflect a period early in the season
when water temperature had not been warm enough to facilitate phytoplankton growth, resulting in a
lower local abundance of planktivorous fish. Likewise, SST > 21°C impaired prey capture success at the
end of the penguin’s breeding season, related to a stronger influence of the warm East Australian Current
at this time (Phillips et al. 2020). Montague Island penguins have been shown to match the distribution
of schooling forage fish like anchovy around the island when foraging, indicating that their prey capture
success reflects local changes in prey availability that might be important for other sympatric predators
such as greater crested terns (Carroll et al. 2017). Range-restricted species, such as breeding seabirds,
may thus be particularly sensitive to the local availability of key prey species at crucial times in the
breeding cycle (Crawford et al. 2006).
Breeding phenology in birds is likely timed to coincide with periods of peak resource availability. The
prevalence of anchovy in the diet increased with SST in this study, and SST was seasonally elevated
during chick provisioning stages (see online resources Fig. 1). It is possible that the timing of breeding is
linked to elevated levels of production, indicated by greater proportions of energy-rich prey (e.g. anchovy)
in the diet during chick provisioning. In support of the latter, anchovy abundance and availability to
Peruvian seabirds increased during the period of chick provisioning with a peak around the time of
fledging, suggesting breeding timing to be adjusted to optimal environmental conditions facilitating chick
or fledgling survival (Passuni et al. 2016). Importantly, the extent to which a dietary shift in this study can
truly be linked to prey availability and its influence by environmental covariates such as SST would
require additional research on estimates of fish stock composition and abundance around Montague
Island by, for example, local fishery assessments or acoustic surveys (e.g. Green et al. 2015; Carroll et al.
2017; Thayne et al. 2019).
Page 13/26Conclusion
This study shows variability in the type and size of prey exploited by greater crested terns during the
breeding season, indicating selective foraging behavior towards relatively energy-rich and smaller sized
prey during chick provisioning. SST was positively correlated with the proportion of anchovy prey items,
suggesting a link between extrinsic factors and prey availability in this marine ecosystem. While intrinsic
processes require selective foraging behaviour regarding the type and size of prey required to meet the
changing energetic demands of chicks, environmental conditions inherently dictate the availability of
prey in the ocean. This supports the notion that breeding phenology in crested terns is timed to coincide
with peak abundances of key prey and highlights the importance of examining both intrinsic and extrinsic
determinants of diet composition and variability in seabird populations. The ultimate goal should be to
simultaneously examine seabird diet composition and breeding parameters (e.g. chick body condition
and survival) in response to oceanographic indices, as well as the spatial and temporal availability of
prey in the ocean (Hazen et al. 2019). Compiling this knowledge is important for sustainably managing
fisheries and to predicting anthropogenic impacts on marine populations in the future.
Declarations
Acknowledgements
KQ received the opportunity to visit Australia and conduct the study through a graduate student exchange
program between Georg-August-University Göttingen and Macquarie University. We thank Lachlan Phillips
for his assistance in the field and the NSW National Parks and Wildlife Service for their ongoing
commitment to this project and for logistical support on Montague Island. We also thank the reviewers.
Authors’ contributions
RH, GC, KQ conceived the ideas and designed the study; KQ collected the data; KQ and CC processed
photographs and collated data; KQ and GC analysed the data and led the writing of the manuscript. All
authors contributed critically to the drafts and gave final approval for publication.
Funding
This project was funded by an Australian Research Council Linkage Grant to Ian Jonsen, GC, RH and
others (LP160100162).
Data availability
The datasets generated and/or analysed during the current study are available from the corresponding
author on reasonable request.
Compliance with ethical standards
Page 14/26Conflicts of interest
The authors declare that they do not have conflicts of interest or competing interests.
Ethics approval
This project was conducted under NSW NPWS Scientific Licence SL170064 at Macquarie University
Animal Research Authority 2014-057. All applicable international, national, and institutional guidelines for
the care and use of animals were followed.
References
Barrett RT, Camphuysen K, Anker-Nilssen T et al (2007) Diet studies of seabirds: a review and
recommendations. ICES J of Mar Sci 64:1675-1691.
Batchelor AL, Ross GJB (1984) The diet and implications of dietary change of Cape gannets on Bird
Island, Algoa Bay. Ostrich 55:45-63.
Bates D, Mächler M, Bolker B, Walker S (2014) Fitting linear mixed-effects models using lme4. J Stat
Softw 67:1-48.
Bertrand A, Gerlotto F, Bertrand S et al (2008) Schooling behaviour and environmental forcing in relation
to anchoveta distribution: An analysis across multiple spatial scales. Prog Oceanogr 79:264-277.
Bost CA, Cotté C, Terray P et al (2015) Large-scale climatic anomalies affect marine predator foraging
behaviour and demography. Nat Commun 6:8220.
Bray DJ & Schultz S (2020) Thyrsites atun in Fisheries of Australia.
http://136.154.202.208/home/species/711. Accessed 01 Aug 2020.
Bray DJ (2020) Nomeus gronovii in Fishes of Australia. http://136.154.202.208/home/species/2927.
Accessed 02 Aug 2020.
Brooks ME, Kristensen K, van Benthem KJ et al (2017). glmmTMB balances speed and flexibility among
packages for zero-inflated generalized linear mixed modeling. R J 9:378-400.
Cairns DK (1988) Seabirds as indicators of marine food supplies. Biol Oceanogr 5:261-271.
Carroll G, Everett JD, Harcourt R et al (2016) High sea surface temperatures driven by a strengthening
current reduce foraging success by penguins. Sci Rep 6:1-13.
Carroll G, Cox M, Harcourt R et al (2017) Hierarchical influences of prey distribution on patterns of prey
capture by a marine predator. Funct Ecol 31:1750-1760.
Page 15/26Cherel Y, Le Corre M, Jaquemet S et al (2008) Resource partitioning within a tropical seabird community:
new information from stable isotopes. Mar Ecol Prog Ser 366:281-291.
Chiaradia A, Dann P, Jessop R et al (2002) The diet of crested tern (Sterna bergii) chicks on Phillip Island,
Victoria, Australia. Emu 102:367-371.
Christensen-Dalsgaard S, May RF, Barrett RT et al (2018) Prevailing weather conditions and diet
composition affect chick growth and survival in the black-legged kittiwake. Mar Ecol Prog Ser 604:237-
249.
Crawford RJM, Hockey PAR, Tree AJ (2005) Swift Tern Sterna bergii. In: Hockey PAR, Dean WRJ, Ryan PG
(eds) Roberts Birds of Southern Africa. Trustees of the John Voelcker Bird Book Fund, Cape Town, South
Africa, pp 453-455.
Crawford RJM, Barham PJ, Underhill LG et al (2006) The influence of food availability on breeding
success of African penguins Sphensicus demersus at Robben Island, South Africa. Biol Conserv 132:119-
125.
Divoky GJ, Lukacs PM, Druckenmiller ML (2015) Effects of recent decreases in arctic sea ice on an ice-
associated marine bird. Prog Oceanogr 136:151-161.
Elliott KH, Chivers LS, Bessey L et al (2014) Windscapes shape seabird instantaneous energy costs but
adult behavior buffers impact on offspring. Mov Ecol 2:17.
Fijn RC, Van Franeker JA, Trathan PN (2012) Dietary variation in chick-feeding and self-provisioning Cape
Petrel Daption capense and Snow Petrel Pagodroma nivea at SignyIsland, South Orkney Islands,
Antarctica. Mar Ornithol 40:81-87.
Gaglio D, Cook TR, Connan M, Ryan PG, Sherley RB (2017) Dietary studies in birds: testing a non‐invasive
method using digital photography in seabirds. Methods Ecol Evol 8:214-222.
Gaglio D, Cook TR, McInnes A, Sherley RB, Ryan PG (2018) Foraging plasticity in seabirds: A non-invasive
study of the diet of greater crested terns breeding in the Benguela region. PloS One 13:e0190444.
Green DB, Klages NT, Crawford RJ et al (2015) Dietary change in Cape gannets reflects distributional and
demographic shifts in two South African commercial fish stocks. ICES J Mar Sci 72:771-781.
Harwood LA, Smith TG, George JC et al (2015) Change in the Beaufort Sea ecosystem: diverging trends in
body condition and/or production in five marine vertebrate species. Prog Oceanogr 136:263-273.
Hazen EL, Abrahms B, Brodie S et al (2019) Marine top predators as climate and ecosystem
sentinels. Front Ecol Environ 17:565-574.
Page 16/26Howells RJ, Burthe SJ, Green JA et al (2017) From days to decades: short-and long-term variation in
environmental conditions affect offspring diet composition of a marine top predator. Mar Ecol Prog
Ser 583:227-242.
Hulsman K, Langham NPE, Bluhdorn D (1989) Factors affecting the diet of crested terns, Sterna bergii.
Wildl Res 16: 475-489.
Jerem P, Jenni-Eiermann S, Herborn K et al (2018) Eye region surface temperature reflects both energy
reserves and circulating glucocorticoids in a wild bird. Scientific reports 8: 1-10.
Kitaysky AS, Kitaiskaia EV, Piatt JF et al (2006) A mechanistic link between chick diet and decline in
seabirds? P Roy Soc B 273: 445-450.
Kogure Y, Sato K, Watanuki Y et al (2016) European shags optimize their flight behavior according to wind
conditions. J Exp Biol 219:311-318.
Larson K, Craig D (2006) Digiscoping vouchers for diet studies in bill-load holding
birds. Waterbirds 29:198-203.
Lenth R (2020) emmeans: Estimated Marginal Means, aka Least-Squares Means. R package version
1.4.6.
Lorentsen SH, Anker-Nilssen T, Erikstad KE (2018) Seabirds as guides for fisheries management:
European shag Phalacrocorax aristotelis diet as indicator of saithe Pollachius virens recruitment. Mar
Ecol Prog Ser 586:193-201.
McLeay LJ, Page B, Goldsworthy SD et al (2009a) Size matters: variation in the diet of chick and adult
crested terns. Mar Biol 156:1765-1780.
McLeay LJ, Page B, Goldsworthy SD et al (2009b) Demographic and morphological responses to prey
depletion in a crested tern (Sterna bergii) population: can fish mortality events highlight performance
indicators for fisheries management? ICES J Mar Sci 66:237-247.
McLeay LJ, Page B, Goldsworthy SD et al (2010) Foraging behaviour and habitat use of a short-ranging
seabird, the crested tern. Mar Ecol Prog Ser 411: 271-283.
Norman M & Reid A (2000) A Guide to Squid, Cuttlefish and Octopuses of Australasia. CSIRO Publishing,
Victoria.
O’Hara D (2016) Increased spatial resource partitioning among a multispecies seabird colony in a lower
productivity year. Master thesis, Macquarie University, Sydney.
Oksanen J (2011) Multivariate analysis of ecological communities in R: vegan tutorial. R package version
1:1-43.
Page 17/26Orians GH, Pearson NE (1979) On the theory of central place foraging. In: Horn DJ, Mitchell RD, Stairs GR
(eds) Analysis of ecological systems, Ohio State University Press, Columbus, pp 157-177.
Parsons M, Mitchell I, Butler A et al (2008) Seabirds as indicators of the marine environment. ICES J Mar
Sci 65:1520-1526.
Passuni G, Barbraud C, Chaigneau A et al (2016) Seasonality in marine ecosystems: Peruvian seabirds,
anchovy, and oceanographic conditions. Ecology 97:182-193.
Phillips LR, Carroll G, Jonsen I et al (2020) A water mass classification approach to tracking variability in
the East Australian Current. Front Mar Sci 7:365.
Pichegru L, Ryan PG, van der Lingen CD et al (2007) Foraging behaviour and energetics of Cape gannets
Morus capensis feeding on live prey and fishery discards in the Benguela upwelling system. Mar Ecol
Prog Ser 350:127-136.
Rodway MS, Montevecchi WA (1996) Sampling techniques for assessing the diets of Atlantic puffin
chicks. Mar Ecol Prog Ser 144:41-55.
Schneider CA, Rasband WS, Eliceiri KW (2012) NIH Image to ImageJ: 25 years of image analysis. Nat
Methods 9:671.
Shealer DA (1998) Size-selective predation by a specialist forager, the Roseate tern. Auk 115:519-525.
Smithson M & Verkuilen J (2006) A better lemon squeezer? Maximum-likelihood regression with beta-
distributed dependent variables. Psychol Methods 11:54.
Stienen EW, Van Beers PW, Brenninkmeijer A et al (2000) Reflections of a specialist: patterns in food
provisioning and foraging conditions in Sandwich Terns Sterna sandvicensis. Ardea 88:33-49.
Suryan RM, Irons DB, Kaufman M et al (2002) Short-term fluctuations in forage fish availability and the
effect on prey selection and brood-rearing in the black-legged kittiwake Rissa tridactyla. Mar Ecol Prog
Ser 236:273-287.
Thayne MW, Santora JA, Saenz B et al (2019) Combining seabird diet, acoustics and ecosystem surveys
to assess temporal variability and occurrence of forage fish. J Mar Syst 190:1-14.
Votier SC, Bearhop S, MacCormick A et al (2003) Assessing the diet of great skuas Catharacta skua,
using five different techniques. Polar Biol 26:20-26.
Walter CB, Cooper J, Sulter W (1987) Diet of swift tern chicks in the Saldanha Bay Region, South Africa.
Ostrich 58:49-53.
Wanless S, Harris MP, Redman P et al (2005) Low energy values of fish as a probable cause of major
seabird breeding failure in the North Sea. Mar Ecol Prog Ser 294: 1-8.
Page 18/26White TCR (2008) The role of food, weather and climate in limiting the abundance of animals. Biol
Rev 83:227-248.
Whitehead PJP, Nelson GJ, Wongratana T (1988) Clupeoid fishes of the world (Suborder Clupeoidei). An
annotated and illustrated catalogue of the herrings, sardines, pilchards, sprats, shads, anchovies and
wolf-herrings. FAO Fish Synop 125:305-579.
Wickham H (2016) ggplot2: elegant graphics for data analysis. Springer-Verlag, New York.
Wood SN (2006) Generalized additive models: an introduction with R. Chapman and Hall, New York.
Zuur A, Ieno EN, Walker N, Saveliev AA, Smith GM (2009) Mixed effects models and extensions in ecology
with R. Springer Science & Business Media, New York.
Figures
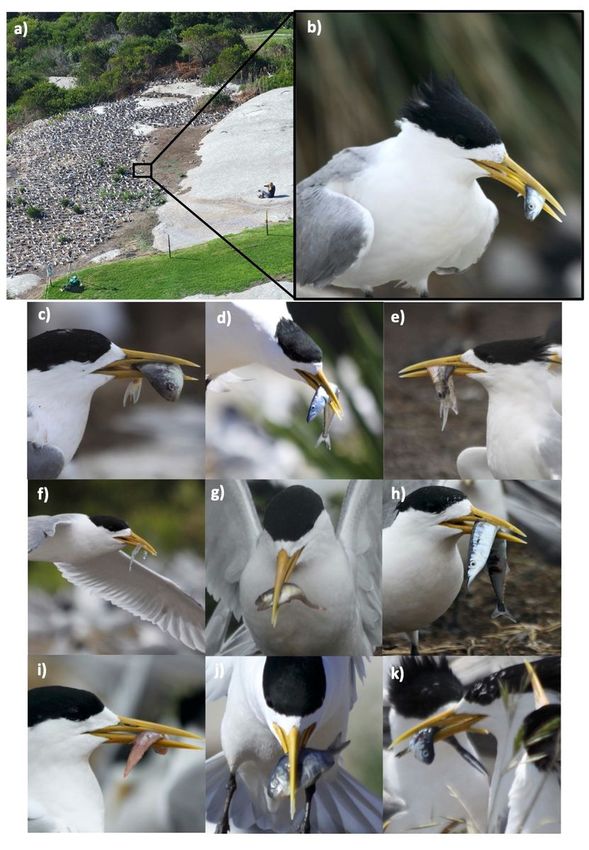
Page 19/26Figure 1
a) Photo of the greater crested tern colony taken from a lighthouse on Montague Island showing the
photographer at vantage point 1 capturing photo-sets of adult terns carrying single-prey items to the
colony at a distance that does not cause disturbance to nesting birds. b) The resulting close-up image of
the prey used for identification and measurements. From b) to k) Examples of tern prey items: b)
Australian anchovy, Engraulis australis; c) Trevally spp. (juvenile), Centrolophidae spp.; d) Barracouta,
Page 20/26Thyrsites atun; e) Southern calamari squid, Sepioteuthis australis; f) Eastern sea garfish, Hyporhamphus
australis; g) Redbait, Emmelichthys nitidus; h) King gar, Scomberesox saurus; i) Goatfish spp. (juvenile),
Mullidae spp.; j) Silver sweep, Scorpis lineolata; k) Bluebottle fish, Nomeus gronovii. Photo credit: Katrin
Quiring, Lachlan Phillips
Figure 2
Example of the application (in IMAGEJ) of the ‘line selection tool’ to measure the linear distances for the
three morphometric parameters: (1) eye diameter, (2) head width and (3) operculum width. Measurements
were adjusted by scaling pixel length to the mean culmen length of greater crested terns. Method adapted
from Gaglio et al (2017)
Page 21/26Figure 3
Daily variation in greater crested tern diet across study period (n= 35 days) and breeding stages:
incubation (study day 1-21), early provisioning (study day 22-28), mid provisioning (study day 29-35).
Depicted are the seven main prey species (Australian anchovy, barracouta, bluebottle fish, eastern sea
garfish, goatfish spp., southern calamari squid, trevally spp.) and other fish returned to the breeding
colony
Page 22/26Figure 4
Non-metric multidimensional scaling plot (NMDS) of daily mean diet proportions showing differences in
prey composition across three breeding stages (incubation, early provisioning, mid provisioning) by
greater crested terns on Montague Island. Sample points represent each study day marked in different
colours depending on breeding stage (see legend). Position of points is related to the relative daily
contribution of each of the seven main prey species (Australian anchovy, barracouta, bluebottle fish,
eastern sea garfish, goatfish spp., southern calamari squid, trevally spp.) and other fish (OF) returned to
the breeding colony. Ellipses highlight the centre of gravity and inertia of each breeding stage
Page 23/26Figure 5 (a) The proportion of anchovy and (b) anchovy standard length (mm) in the diet of greater crested terns across three breeding stages (incubation, early provisioning, mid provisioning) on Montague Island in the 2018 breeding season. Box plots show the median and first and third quartile; whiskers extend to the 1.5 times the interquartile range. Black dots represent outliers. Significance levels are depicted as * for p ≤0.05 and ** for p
Figure 6

Partial effects of environmental covariates (SST, wave height and wind speed) on the proportion of
anchovy returned to the breeding colony in 2018. s(x,y) is the smoothing term, with x the explanatory
variable and y the estimated degrees of freedom of the smoothing term. Pointwise 95% confidence
intervals are shown for each model fit

                                                Page 25/26
Supplementary Files
This is a list of supplementary files associated with this preprint. Click to download.
OnlineResource1.pdf
Page 26/26You can also read