NOCTURNAL BEHAVIOR OF RAPTORS AT WIND ENERGY FACILITIES
←
→
Page content transcription
If your browser does not render page correctly, please read the page content below
NOCTURNAL BEHAVIOR OF RAPTORS
   AT WIND ENERGY FACILITIES

                   by

           James H. Castle

         A thesis submitted to

       Sonoma State University

in partial fulfillment of the requirements
             for the degree of

        MASTER OF SCIENCE

                   In

                Biology

                        Dr. Daniel E. Crocker, Chair

                        Dr. David Stokes

                        Dr. Scott A. Shaffer

                        Date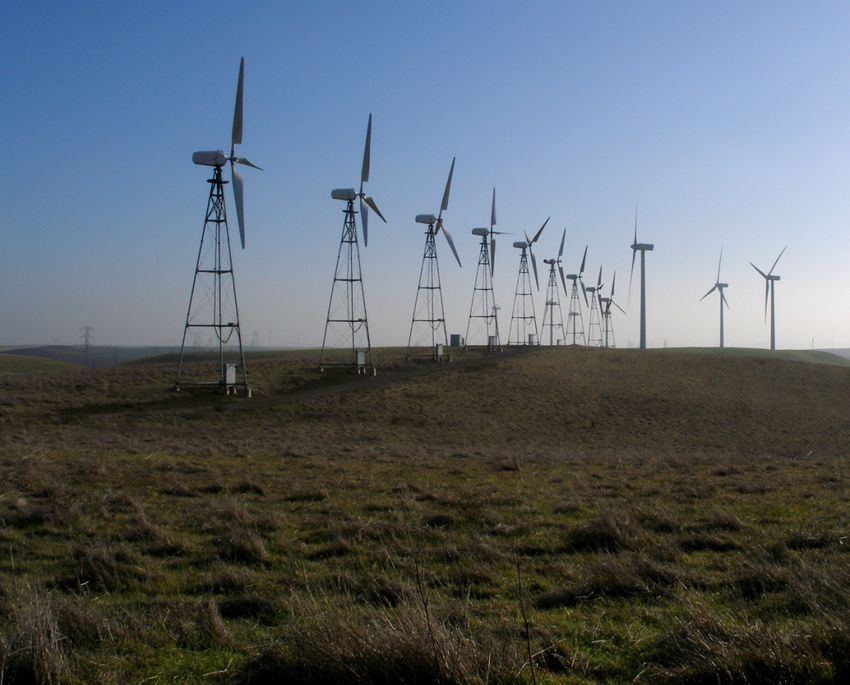
Copyright 2007

By James H. Castle

        ii
AUTHORIZATION FOR REPRODUCTION
                          OF MASTER'S THESIS

I grant permission for the reproduction of this thesis in its entirety, without further
authorization from me, on the condition that the person or agency requesting
reproduction absorb the cost and provide proper acknowledgment of authorship.

DATE: May 4, 2007
                                                    _____________________
                                                             Signature

                                                      1261 Leland Valley East
                                                      Quilcene, WA 98376

                                           iii
Nocturnal Behavior of Raptors
                            at Wind Energy Facilities

                                    Thesis by
                                 James H. Castle

                                   ABSTRACT

Wind power is an environmentally clean, efficient and economical form of
alternative energy, however its use has been associated with avian mortality.
I conducted an observational study of the nocturnal behavior and habitat use by
raptors around wind turbines using night vision devices. Between 20 September
2006 through 8 November 2006 there were 42 individual raptors observed during
210 10/20 minute point count events. Eight of these raptors were diurnal and 34
were nocturnal. Most of the diurnal raptors were found within the area around
wind turbines that posed a high mortality risk. 36 percent of the nocturnal raptors
were in high mortality risk areas. I used logistic regression to model use of
raptors around wind turbines from presence/absence data and found that percent
of lunar illumination, ambient temperature and vegetation grouping were
significant predictors of raptor presence. Multinomial logistic regression was
used to model flight/perching behaviors. Duration of occupancy was significantly
affected by flight behavior. Raptor species and vegetation grouping significantly
affected perching behavior. These data indicate that raptors are active at night.
Further studies need to be conducted to correlate time of mortality with nocturnal
behavior and habitat use by raptors around wind turbines that would provide
information for management and conservation of these raptor species.

Chair:

_________________________
      Signature

MS Program: Biology
Sonoma State University                Date: __________________

                                        iv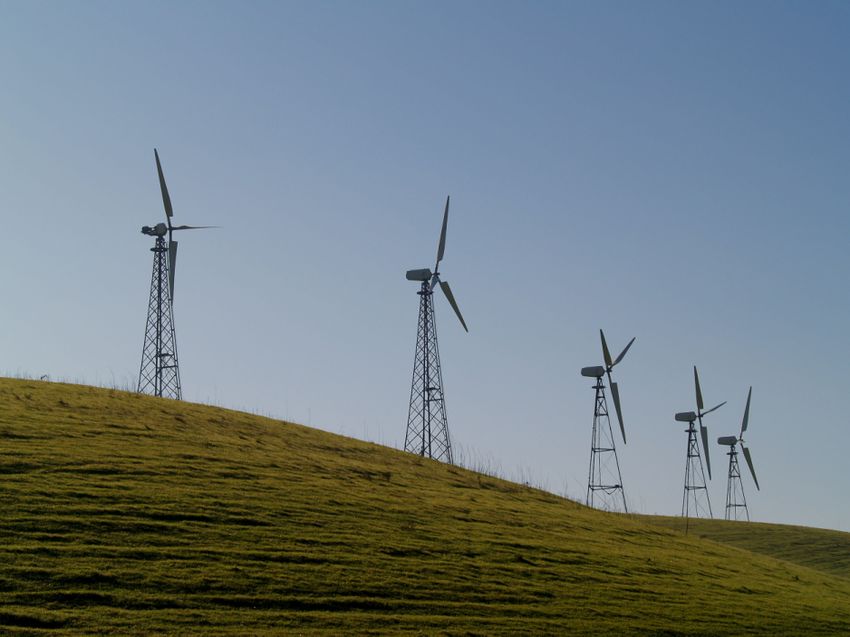
Table of Contents

Introduction……………………………………………………………....1

Study Area……………………………………………………………….5

Methods………………………………………………………………….6

Results………………………………………………………………….13

Discussion……………………………………………………………...15

Management Implications…………………………………………….20

Acknowledgments……………………………………………………..22

Literature Cited………………………………………………………...23

Table and Figures……………………………………………………..29

                           v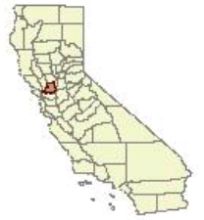
2

(Russell, 1991; DeCandido and Allen, 2006). However, little is known about the

mortality and behavior of raptors at night near wind turbine facilities. Therefore, a

better understanding of the nocturnal mortality threat to raptors posed by wind

turbines, and the mechanisms of those mortality risks, may be useful in

improving management and design of wind generation facilities to minimize

impacts to raptors.

 I used night-vision devices (NVD) to observe the nocturnal presence, activity,

and behavior of nocturnal (owls) and diurnal (hawks and kestrels) raptors at a

commercial wind turbine facility to address the following questions.

Are raptors (nocturnal and diurnal) active in using the areas around wind turbines

at night? Are raptors exhibiting nocturnal behaviors, such as flying near turbines

or perching on turbines that put them at risk? Are raptors flushed off wind

turbines when the turbines are powered up at night? (Thelander, 2005 pers.

comm.)

  If nocturnal behavior of raptors at wind energy facilities poses a significant

mortality risk, then information from this study may lead to potential conservation

and management solutions.

Raptor Species

Raptor species found on the study site are shown in Table 1. Five raptor

species differing morphologically, behaviorally and ecologically (Johnsgard 1990,

2002; Bleidstein, 1987), were studied: Red-tailed Hawk and American Kestrel

(diurnal), Barn Owl and Great Horned Owl (nocturnal) and Burrowing Owl
1

Wind power has been cited as a clean, economical and important form of

alternative energy (AWEA, 2007; NREL, 2006; Alvarez-Farizo and Hanley, 2002;

Kennedy, 2005; Krewitt and Nitsch, 2003). However, wind energy facilities (e.g.

Altamont Pass Wind Resource Area) have been shown to cause high avian

mortality and raptors appear to be one group of birds most affected by wind

turbine operations (Thelander and Smallwood, 2004; WEST Inc, 2006).

Examples of the types of injuries to raptors that are attributed to wind turbines

include decapitation, broken wings and legs, and severed torso, wings, tail, and

legs (Thelander and Smallwood, 2004).

  The particularly high risk to raptors is apparently a consequence of flight and

perching behaviors characteristic of the group (Thelander and Smallwood 2004),

resulting from raptors using the habitat and winds found around wind turbines.

Previous studies have found raptor mortality associated with wind turbines (Bryne

1983; Orloff and Flannery, 1992, 1996; Howell and Noone, 1992; Gauthreaux,

1994; Howell, 1997; Johnson et al., 2006). These studies quantified mortality,

but did not address issues concerning how, when, or why raptors are killed by

wind turbines, or the behaviors that contribute to increased raptor mortality risk.

Raptor mortality due to the interaction of wind turbines may occur because

raptors cannot see, hear or avoid the physical forces generated by wind turbines.

Mortality risk may be enhanced at night, when nocturnal raptors, such as owls,

are active. Furthermore, light and wind conditions during the night may present

different mortality risks. Even nominally, diurnal raptors may be active at night
3

(generally considered diurnal, but active day and night). These raptors were

selected because of their differences in size and shape, which allows then to be

identified at night. These differences include light/dark patterns and silhouette

(size and shape) profiles that can be differentiated using night vision devices

(NVD).

  Mathematical models have been developed to predict the probability of a bird

collision with a wind turbine and to develop safe turbine designs (Tucker, 1996).

Wind turbine strikes may occur because raptors experience forces that cannot be

aerodynamically/energetically compensated for by the raptor in the presence of

wind turbines. Aerodynamic forces generated by the wind turbines lead to

disruptions in pitch, roll and yaw control, that can cause the bird to be rotated

upside down, tumbled, and in general, lose their ability to maintain a controlled

flight posture. These forces include wind shear, helical vortex wakes and wake

structures (Spera, 1998; Burton et. al., 2001).

  Wind shear may occur when the raptor is flying in proximity to the front of the

rotating wind turbine blades, forcing the raptor to the ground due to a loss of lift.

Helical vortex wakes occur at the terminal end of the wind turbine rotating blades

(Spera, 1998), tumbling the raptor into the wake structure/rotating blade. Wake

structures are chaotic forces occurring on the downwind side of the rotating

blades (Spera, 1998), causing the raptor to be tumbled, losing both lift and yaw

control and thrown into the ground or rotated into a rotating blade. Two other

causes of raptor collisions with wind turbines are interference with vision (motion
4

smear) and hearing interference (i.e. avoiding rotating blades) (McIsaac, 2000;

Hodos, 2003; Dooling, 2002). Motion smear occurs when the image (i.e. rotating

blade) on the back of the retina becomes larger as the bird flies closer to the

rotating blade, causing the terminal end of the blade to disappear, and the raptor

to be struck or experience a wind vortex while attempting to fly around the turbine

(Hodos, 2003). This is where most mortality occurs (Thelander and Smallwood,

2004). Hearing interference may be caused by the ability of the raptor to detect

the sounds (signal-to-noise ratio) produced by rotating wind turbines (Dooling,

2002), and may contribute to a mortality. In addition to risks associated with

flight, raptors may be using the wind turbines as perches, which would provide a

platform for hunting.

  I investigated the nocturnal behavior and activity of raptors within a commercial

wind turbine facility with Horizontal-axis Wind Turbines (HAWT) (Figure 1), using

Generation lll (Gen lll) Light Intensifying Night Vision Devices (Figure 2). Light

Intensifying Night Vision Devices work by converting electrons to high-energy

photons and, passing them through an imaging tube, microchannel plate (MCP),

and onto a phosphor screen, producing a visible image (Bass et. al., 1995). NVD

have been used to study birds (Russell, 1991; Henson and Cooper, 1994;

Russell et. al, 1991; Black and Collopy, 1982; King and King, 1994). I selected

Generation lll NVD because advancements in light-intensifying technology,

improvement of the light intensifying tube, optical resolution, coating and density

of glass (Biass and Gourley, 2001; Efkeman, 2006 pers. comm.), have made it
5

possible to identify most raptors to species at distances of at least 150 meters.

Additionally, Gen lll NVD produce low “visual noise” because of the

improvements in the MCP (Bass, et.al, 1995), allowing light to be intensified over

50,000 – 100,000 times, and changes in the imaging tube from tri-alkaline

cathode to gallium arsenide cathode (Biass and Gourley, 2001). These

characteristics along with high quality optics allow Gen lll NVD to produce an

extraordinarily clear image. The use of NVD does not require direct interaction

such as capturing and marking the raptors, which reduces bias of flight/perching

behavior.

  Other techniques considered for this study included Radar and Radio-

telemetry. Radar is capable of providing an avian signature, but has some

limitations (Kunz, et al., 2007). If the bird hovers, contours or flies close to the

ground or a stationary object, the signature may drop off due to ground bounce

(Cooper, 2005 pers. comm.). Current Radio-telemetry methods do not have the

fine scale capabilities needed to track birds in close proximity to wind turbines

(Kenward, 2001).

Study Area

I conducted observational field studies at the EnXco 5 site in the Montezuma Hills

near Birds Landing, California, a commercial wind generation facility operated by

the EnXco Corporation. The site (Figure 3) is northeast of San Francisco near

Highway 12 between Suisun and Rio Vista, California. The terrain consists of low

rolling clay hills, dominated by agricultural land with grain/hay crops in the
6

summer and wheat and sheep grazing in the winter. This site was chosen

because of it accessibility and the presence of raptor species.

Methods

Plot 1 consisted of six General Electric 1.5 MW turbines that were divided into

two sections, because these larger turbines required a different survey design

than the smaller Kenetech 56 (100) turbines. These turbines were arranged in

two groups of three turbines per group and were 100 meters apart. Their towers

are 80 meters high and their blades have a 77 meter rotor diameter. These

turbines have a maximum blade tip speed of 294 kph. Plots 2 -6 consisted of 37

Kenetech (56) 100 kW wind turbines arranged in linear strings (6 -9 turbines per

row), 30 meters apart. Their towers are 18.5 and 24.6 meters high and their

blades have a 17.5 meter rotor diameter. These turbines have a maximum blade

tip speed of 246 kph.

  I used a complex survey combining several survey methods to quantify

presence/absence, flight/perching of raptors observed during the survey period.

The double sampling technique, where two observers are recording data of the

same area or plot (Thompson, 1992) was used to reduce bias in detecting

raptors and provide a complete visual coverage of the plot. I used the Visual

Corridor Observation (VCO) design (Gauthreaux 1996), (Figure 4), to observe

raptors within study plots; this design allowed the two observers to view the area

from 0 - 50 meters away from a point parallel to the wind turbines. I integrated 10

and 20 minute point-counts (PCs) (Ralph, 1995), to measure occupancy
7

(Mackenzie et. al, 2006) of raptors, the time at which a raptor remains in the plot,

measured in minutes and seconds was used to account for activity around the

wind turbine. The longer the raptor remained in the area around a wind turbine

the higher the mortality risk. One observer was located at each end of the

turbine string, at synchronized points. Two 10 minute raptor point-counts, one on

each side of the turbine string were conducted with a 5 minute break between

counts. This break allowed the observers to locate the next observation point

and provided a short break from observing through the NVD. There were four

permanent observation points per turbine string (A-D), arranged in a clockwise

pattern at the end of the turbine string using the VCO design beginning from

where the road entered the plot. The variable circular plot (VCP) design

(Reynolds, 1980) was integrated with instantaneous sampling (Martin and

Bateson, 1993), a method used to determine the point at which a raptor is first

detected within the plot, between 50 and 150 meters from the observers point (A-

D). These observation points were located where the observer could view all of

the turbines within the string and where the observer could scan one side of the

plot (Figures 5 and 6).

  I arrived by vehicle at each at each plot several hours before dark to determine

presence of raptors. After dark, I observed and recorded raptors using the area

before conducting the 10 or 20 minute PC. Before approaching a plot, I scanned

with NVD to reduce the possibility of missing a raptor perched on a wind turbine

from within the plot as I approached the plot to conduct surveys.
8

  I selected a total of six plots, consisting of a string of turbines, and the area

around the turbines out to a distance of 150 meters. These plots represent a

cross-section of the wind turbine field; this cross-section included both types of

turbines and included turbine groups and strings from the northwest edge to the

southeast edge of the entire EnXco 5 site. I selected three levels (low, medium

and high) of raptor occurrence determined by pre-survey estimates. These

estimates were determined by observing raptors during the daytime before

conducting the nocturnal surveys and consulting with EnXco managers familiar

with raptors at this site.

  Having trained observers familiar with the study species and flight/perching

behavior (Kepler and Scott, 1981) and the NVD (Stark, 2006 pers. comm.) was

necessary for an accurate survey. The same two observers (James Castle and

Charlene Burge) surveyed all study plots. Both had at least five years of

experience with the natural history, taxonomy and observing the study species

and both had training in observing the study species using NVD.

  The arrangement of turbines at site 1 required a modification of methods,

because of the larger 1.5 MW turbines. I used the VCO method with modified

observation points, that were 300 meters from the center of the wind turbine plot

and located to provide an equal view for the observer on each side of the

turbines. I used 20 minute point counts to normalize survey effort between all

plots. This normalization of survey effort was important in order to compare my

results with other studies (Mackenzie et. al, 2006). I used fixed-point field
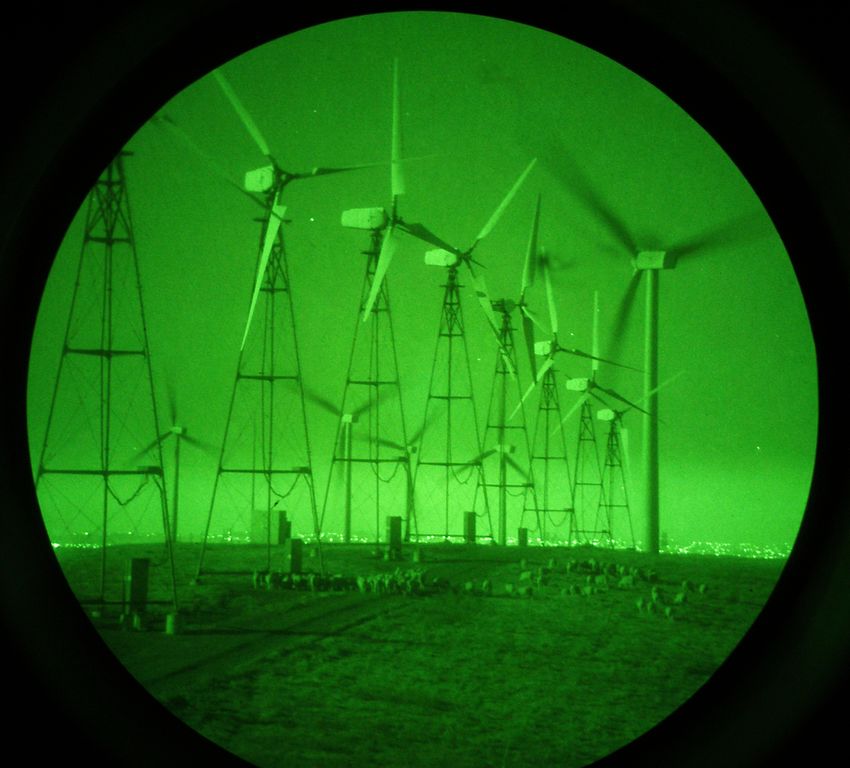
9

markers to establish distances out from the center of the turbine field and used

100 meter PC protocols. In some cases, these distances were measured from

objects in the plot such as another turbine string, a road corner or a solitary hay

bale. Two small pocket lights (visible to both observers) were placed (plots 2-6)

on an eight foot wooden stake, supported by a four foot metal fence stake at 50

meters to delineate a zone of high risk. Mortality risk becomes greater as the

raptor moves closer to the wind turbines due to motion smear (Hodos, 2003), and

studies indicate that some diurnal raptors may experience the effect of noise

interference from wind turbines at 50 meters (Dooling, 2002). In addition, when

flying within 50 meters of a wind turbine string, there may be little time for the

raptor to avoid rotating turbine blades, based on their flight behavior especially if

the wind is fluctuating.

  A total of 80 hours of nocturnal raptor surveys were conducted including 208

point observations in plots 1 - 6 between 20 September and 10 November 2006

between the hours of 6 p.m. and 12 a.m. (PDT). Start time for nocturnal surveys

varied, beginning at the end of civil (nautical) twilight in the western sky

(Ekferman, 2007, pers. comm). In September, surveys began after 9 pm and in

November at 6 pm.

  Nocturnal observations were made using Star Tron Pocket Scope Model 7B

Generation lll Light Intensifying Night Vision Device (NVD) with a 75mm, f1/4

waterproof objective lens, providing 2.78X magnification. An image of the

Kenetech 56 (100) wind turbines demonstrates the resolution of this NVD (Figure

7).
10

  I developed ethograms for flight and perching behavior specific to this study. I

grouped flight behavior into the following categories: flying (forward flapping

flight, gliding, soaring and contouring), flushed (raptor flew returning to the same

or nearby perch within 10 seconds), flying and hunting, and flying (forward

flapping flight, gliding) after being flushed (not returning to the perch). I grouped

perching behavior, according to perching location, into eight categories. These

were ground perching with high mortality risk (within 50 meters of turbine),

ground perching with low mortality risk (outside of 50 meters from turbine), fence

post, electrical boxes (between turbines or under turbine), turbine superstructure

(tower) (lower, middle and upper sections), distribution power pole, transmission

crossarm of tower and nacelle (cover on the turbine power train, located at top of

turbine).

   I recorded flight and perching behavioral data for species observed during 10

and 20 minute PC. Weather data [temperature (wind chill factor) and average

wind speed] was measured at each plot, before each observation using a Kestrel

2000 portable weather station. Percent of cloud cover was estimated from

horizon to horizon (180 degree arc across the sky). Illumination on the plots

(artificial ambient light and moon light) was categorized as present/absent.

Percent lunar illumination (0 -100) was determined from astronomical data for the

San Francisco Bay area (Thorsen, 2006). Vegetation in the area of the study

plots was visually assigned to four categories: 1). Little vegetation < 10% cover,

fallow, bare ground. 2). Vegetation < 15 cm. high, heavy grazing, weedy and/or
11

cut fallow hay field, some denuded areas. 3). Average vegetation, 15 -30 cm.

high, medium grazing, some denuded areas. 4). Greatest amount of vegetation,

vegetation > 30 cm. high with 100% coverage on land around the roads and

turbine structure.

  Communication between observers was maintained using Motorola Talkabout

Model T5710 hand-held radios. All distance measurements (observation points to

turbine, reference lights to turbine, distances between turbines and distances of

structures [i.e. transmission/distribution towers/poles, fence post, etc]) were

made using a Leica Rangermaster 900 scan Laser Range Finder. Fixed point

objects (wind turbines, observer points and light distance references) were

delineated using a submeter GeoExplorer 3 GPS device.

    To determine the distance at which raptor species could be identified using

NVD, I conducted a calibration experiment a posteriori on 10 December 2006

using captive raptors at the Bird Rescue Center (BRC) in Santa Rosa, California

(CADFG and USFWS certified facility). Four raptor species (Red-tailed Hawk,

American Kestrel, Barn Owl and Great-horned Owl) were identified at known

distance (50 – 150 meters), established with Leica 900 scan LRF and under

constant light conditions with 100 percent cloud cover with available ambient

light. I estimated that lighting condition at BRC was approximately 50 percent

less light as compared to the lowest light conditions on the project site. These

experiments provided a reference for visual acuity and validation of species

identification at distance under lighting conditions that were lower than lighting
12 conditions during the study. The strength of inference of study designs used to generate system dynamics (models) range from strong (manipulative experiments) through constrained design studies to weak (observation studies). These observational studies (a priori/posteriori hypotheses) are used when natural variation could not be manipulated/constrained (MacKenzie et al, 2006). The general appearance (silhouette and size) of the raptor, wing beat duration and patterns of light and dark feathers provide information to key a raptor to species using NVD. Additionally, information as to the distribution of raptors spatially and temporally in the study area provides additional clues. For example, one may observe a Buteo, Falcon or Owl and further identify based on appearance, morphology or behavior. In my study I was able to identify an American Kestrel perched on a wind turbine at a distance greater then 50 meters, because the kestrel dove and presented a “drawn bow silhouette” unique to this species flight behavior (Smallwood and Bird, 1995). Statistical Analysis I analyzed all data using SPSS 11 for Macintosh OS X Tiger Platform (SPSS, 2005). Logistic Regression was selected as the statistical method to model these data (Zar, 1996; Glantz and Slinker, 2001). I used presence/absence to determine if raptors were utilizing the area around wind turbines and flight/perching behavior to determine mortality risk. After screening variables for significance, models were selected using backward stepwise regression from a
13

global model with factors and covariates. Effects were retained in the model if

significant (p < 0.05).

Results

Calibration Experiment

The a posteriori calibration experimental data indicates that Red-tailed Hawks,

Great-horned Owl and Barn Owl could be identified from a distance of at least

150 meters using Gen III NVD. American Kestrels could be identified from a

distance at least 50 meters (Table 2).

Presence/Absence

Over a total of 80 nighttime observational hours, I observed 42 raptors. The most

commonly seen diurnal raptor was the Red-tailed Hawk and the most commonly

seen nocturnal raptor was the Barn Owl (Figure 8).

  The time after sunset (Thorsen, 2006), of raptors observed during point counts

ranges from one to four hours and indicates that all raptors species were seen

throughout the range of time (Figure 9). Date of observations of raptors during

point counts indicates that most diurnal raptors were seen earlier in the survey

and nocturnal raptors were seen throughout the survey (Figure 10).

  I tested a model predicting presence/absence with percent lunar illumination,

ambient temperature, wind speed and vegetation groupings as effects indicated,

significant positive effects of lunar illumination and ambient temperature on

presence of raptors (LR ! 2 = 8.0, 4.5; p = 0.005, 0.033). Vegetation grouping had

a significant effect, with increasing presence of raptors the vegetation increased
14

(LR ! 2 = 4.1, p = 0.044). Wind speed was not a significant predictor of the

presence of raptors (LR ! 2 = 0.08, p = 0.772).

Flight Behavior

I observed 38 raptors demonstrating various flight behaviors. Flying and flying

after being flushed (flying from a perch such as a wind turbine, fence post or

ground and not returning to that perch) were the most commonly observed flight

behaviors and flying while hunting was the least commonly observed flight

behavior (Figure 11). I tested a model that examined the effects of vegetation

grouping, duration of occupancy and lunar illumination on flight behavior. This

model revealed significant effects of the duration of occupancy on flight behavior

(LR ! 2 = 21.3, p = 0.011). Lunar illumination and vegetation grouping did not

significantly influence flight behavior (LR ! 2 = 51.1, 5.5; p = 0.246, 0.136) on

flight behavior. My behavioral observation suggests that nocturnal behaviors of

raptors around wind turbines pose a risk. One of the Red-tailed Hawks sighted

was observed flying approximately eight meters above the ground at 9 p.m.

between two Kenetech 56 (100) turbines that were operating. Two American

Kestrels were flushed from a Kenetech 56 (100) turbine when that turbine was

powered up. In both cases, diurnal raptors were exposed to turbine-related risk

because of nocturnal behavior.

Perching Behavior

I observed 30 raptors demonstrating various perching behaviors (Figure 12).

Perching on the ground in low risk areas was the most frequent observation and
15

perching on the nacelle was the least frequent observation of perching behavior.

I tested a model that examined the effects of species and vegetation grouping on

perching behavior. The model revealed a significant effect of species, most of

the diurnal raptors were seen in plots 5 and 6 (LR ! 2 = 24.9, p = 0.001) and a

marginally significant effect of vegetation grouping (LR ! 2 = 13.5, p = 0.060), on

perching behavior.

Discussion

My data suggest that both diurnal and nocturnal raptors are occupying the area

around wind turbines for movement, perching and hunting at night. This

nocturnal behavior and occupancy of raptors with wind turbine mortality risk was

not previously identified.

Presence/Absence

When comparing my presence/absence surveys at the EnXco 5 site to those

surveys conducted at APWRA (Thelander and Smallwood, 2004), there are a

comparable number of raptors present at the two sites, normalizing survey effort

(Mackenzie et. al, 2006). Between May 1998 and May 2003 there were 213 Red-

tailed Hawks, 70 Burrowing Owls, 59 American Kestrels, 50 Barn Owls and 18

Great-horned owls fatalities caused by wind turbine collisions at APWRA

(Thelander and Smallwood, 2004). Sixty percent of these raptors are Red-tailed

Hawks. These are five of the six most abundant mortalities reported in the

APWRA and species I observed during nocturnal surveys at my study site.

Comparing Red-tailed Hawks between sites and normalizing survey effort, there

were 213 Red-tailed Hawks fatalities in 5 years; this equals an average of about
16

43 Red-tailed Hawks per year or 3.6 Red-tailed Hawks per month. There were

two Red-tailed Hawk fatalities (found by wind facility technicians) during my

survey in the two month period, averaging one raptor per month, this implies that

0.25 percent less fatalities at my study site compared to APWRA, with

abundance of raptors between sites being equal. The survey effort between

sites was one and a half times the number of hours surveying (120 vs. 80), four

times the length of survey (8 months vs. 2 months) and one and a half longer on

point counts (30 vs. 20 min). Therefore, at APWRA 598 raptors were present

based on their survey effort. I observed 42 raptors, normalizing survey effort (42

raptors x 1.5 hours x 4 length of survey x 1.5 point count) = 378 raptors. This is a

maximum estimate of the raptors that could be seen based on normalizing

survey effort. This difference is 1.5 times greater in the APWRA compared to

EnXco 5 site. However this difference may be because surveys at APWRA were

conducted in the day, where observers could detect raptors at a greater distance

with unaided vision and using 8x25 binoculars a factor of three times the power

and binocular of the NVD that were 2.75x and monocular.

  With increasing lunar illumination, I observed a greater number of raptors.

Lunar illumination may increase the raptors, ability to detect prey more

effectively. Owls may spend significantly less time searching for prey as lunar

illumination increases (Clarke, 1983). These effects of search time with

increasing lunar illumination may apply to diurnal raptors if these raptors are

active at night. I suspect that increasing lunar illumination may give diurnal

raptors the opportunity to extend their hunting activity into night hours. Despite
17

low occupancy for diurnal raptors, these data suggest that diurnal raptors are

active at night, which may place them at higher mortality risk than previously

reported.

Ambient temperature had a positive influence on raptor presence. This may be

an effect of raptors being more active with increasing temperatures. Red-tailed

hawks may use thermals to reduce cost of transport to (Videler, 2006); this may

account for presence around wind turbines because of thermosensitivity, the

ability to regulate body temperature (Whittow, 2000) and compensate for the

reduced nocturnal temperatures, this may allow the raptor to maintain their

presence in the study area. Occupancy of the area by the raptor may be

influenced by transient thermal characteristics. Occupancy of kestrels may be

influenced by temperature and other environmental factors (Koplin et al, 1980).

Thermals occurring in the area afford the opportunity for the diurnal raptor to

utilize these for soaring and gliding. I found that as the ambient temperature

increased more diurnal raptors were seen.

  Vegetation grouping had a significant effect on occupancy. This may be

related to an increase in prey density with increasing cover (Preston, 1990).

Raptor occupancy may depend on density of prey items, however search time

may increase with increasing vegetation cover and this may relate to foraging

time. As the vegetation becomes denser, raptors may spend more time searching

for prey.

  Surprisingly, wind speed did not influence raptor occupancy. This may be due
18

to lack of significant variation in average wind speed (0-8m-s) during the study.

However, average wind speed was used in the model and actual wind speed

fluctuated over short time periods. Fluctuation in wind speed may increase

mortality risk if a raptor is flying in a high risk posture relative to the wind turbine.

For example, if a raptor is flying one or two meters below or above a rotating

blade and experiences a sudden wind fluctuation (up/downdraft). This may force

the raptor into the rotating blades.

Flight Behavior

Flight behavior was likely the most important variable considered, relative to

mortality risk to the raptor. The duration of occupancy of raptors in the plot

suggests that raptors were spending a significant portion of time flying within the

study site. Forward flapping flight behavior may cause the raptor to fly into the

turbine because of motion smear (Hodos, 2003) and/or hearing interference due

to increasing noise (signal-to noise ratio) generated by the rotating turbine

(Dooling, 2002). Gliding, soaring and contouring behavior may cause the raptor

to be exposed to vortex turbulence and/or wake structure.          Lunar illumination

and vegetation grouping did not significantly influence the raptor flight behavior.

Raptor flight activity has been reported to decrease with increases in wind speed

and decrease with decreased temperatures (Preston, 1981). I found as the

temperature increased and the wind speed decreased, I observed more raptors

present.
19

Perching Behavior

Perching behavior is another important component of raptor mortality risk.

Perching behavior is a function of the raptor location. Raptors selected perches

in high and low mortality risk locations. Species (diurnal and nocturnal) had a

significant impact on perching behavior and vegetation was marginally

significant. Vegetation has been linked to foraging and prey biomass, implying

that vegetation cover increases foraging effort in raptors (Preston, 1990). The

diurnal raptors appeared to perch on structures that afforded them the

opportunity to increase their attack speed and return to consume their prey.

These structures included wind turbines and utility structures such as distribution

poles and transmission towers. Nocturnal raptors chose all types of perches and

did not appear to have a preferred perch type.

  Wind variations that cause turbines to be powered up or down by operators at

random times may afford raptors the opportunity to perch on wind turbines while

the turbines are not operating; this may pose the greatest mortality risk because

of the proximity of the perched raptor to the rotating wind turbine blades, when

the turbine restarts. Risk increases in other perches (ground or within 50/100

meters of the turbine) as the raptor becomes closer to the wind turbine and if the

turbine is actively rotating. I found that 36 percent of the raptors were perching in

locations of high mortality risk.
20

  My study suggests that there is a raptor mortality risk, however I was not able

to measure mortality directly in this study for the following reasons. Mortality

surveys require a scavenger rate study to determine the frequency of the

mortality survey. Sheep occupied all study plots, except site 2. There was

concern that placing carcasses of birds on the site may create a health issue for

the livestock and since the research site is leased by the rancher this was of

concern to managers of the site.

Management Implications

I have demonstrated that diurnal raptors are present and active around wind

turbines at night. Nocturnal raptors are using the area around wind turbines, in

greater numbers but for the same purposes. This nocturnal activity may pose a

mortality risk to raptors. The nocturnal period has been largely ignored in studies

of avian mortality from wind turbines, primarily because there were inadequate

methods to study behavior of raptors at night. My results suggest several

possible management actions that should be investigated further. Vegetation

removal within 50 meters of wind turbines may reduce prey in areas that place

foraging raptors in high mortality risk situations. Although new turbines designs

are better for reducing perching opportunities, the lattice style turbines could be

modified to reduce perching and/or artificial perches could be constructed outside

of 50 meters. Finally, selected wind turbines (i.e. corners of strings) could be

turned off during periods of maximum lunar illumination, when raptors are most
21

active.

  This study has provided a foundation for further studies involving NVD and

other methods. Further advancements in NVD technology and greater

availability of this technology will provide more information that will allow and

managers to make better decisions at wind energy facilities. I recommend that

NVD are used in conjunction with Radar and mortality surveys be conducted with

NVD observations. With wind turbines having the potential to mitigate global

warming (Keith et. al, 2004), and the advancements in wind turbine design we

have the opportunity to develop alternative energy technologies that will provide

energy solutions for the future while avoiding unnecessary avian mortality.
22

Acknowledgements

I would like to thank the following individuals and associations for their assistance

with my work.

Charlene Burge - Biologist/Research Associate

Dr. James Walker and Mr. John Opris EnXco Corporation

Mr. Ed Efkeman U.S. Army Research, Development and Engineering Command

(RDECOM) Communications and Electronics Research, Development and

Engineering Center (CERDEC) Night Vision and Electronic Sensors Directorate

(NVESD).

Sonoma State University

Graduate Committee

Drs. Dan Crocker, Chair. Dave Stokes and Scott Shaffer

Dr. Bryant Hichwa and Mr. Steve Anderson Department of Physics and

Astronomy

Dr. Alexandra von Meier Department of Environmental Studies and Planning

Mr. Mike Hearty and Mr. JM Baeli Departments of Geography and Biology
23

Literature Cited

Alvarez-Farizo B. and N. Hanley. 2002. Using conjoint analysis to quantify public
preferences over the environmental impacts of wind farms. An example from
Spain. Energy Policy 30 107–116

AWEA. 2007. American Wind Energy Association publications. Washington,
D.C. [on-line] Available: awea.org

Bass, M. 1995. Handbook of Optics. Volume 1 Fundamentals, Techniques and
Design. 2nd Edition. 21.2-21.7
Image detectors and image tube intensified electronic imaging. McGraw-Hill Inc.

Biass E.H. and S. Gourley. 2001. Night Vision Technology Update. Armada
International. pp. 28-36.

Bildstein, K.L. 1987. Behavioral Ecology of Red-tailed Hawks (Buteo
jamaicensis), Rough –legged Hawks (Buteo lagopus), Northern Harriers (Circus
cyaneus), and American Kestrels (Falco sparverius) in Central Ohio. Ohio Biol.
Surv. Notes No. 18 viii + 53 p.

Black, B.B. and M.W. Collopy. 1982. Nocturnal Activity of Great Blue Herons in
a North Florida Salt Marsh. J. of Field Ornithol. 53(4): 403-406

Burton, T., D. Sharpe, N. Jenkins and E. Bossanyi . 2001. Wind Energy
Handbook. John Wiley & Sons, Ltd.

Byrne, S. 1983. Bird Movements and Collision Mortality at a Large Horizontal
Axis Wind Turbine. Cal-Neva Wildl. Trans. 76-83

Clarke, J.A. 1983. Moonlight!s Influence on Preditor/Prey Interactions Between
Short-eared Owls (Asio flammeus) and Deermice (Peromyscus maniculatus).
Behav. Ecol. Sciobiol. 13: 205-209. Springer-Verlag. 1983

DeCandido, R. and D. Allen. 2006. Nocturnal Hunting by Peregrine Falcons at
the Empire State Building, New York City. The Wilson Journal of Ornithology
118(1): 53-58.

Dooling, R. 2002. Avian Hearing anf the Avoidance of Wind Turbines. National
Renewable Energy Laboratory. Golden, Colorado. NREL/TP-500-30844. [on-
line] Available: at nrel.gov.
24

Gauthreaux S.A. Jr., 1994. The History of Wind-related Avian Research in the
U.S.A. 1994 National Avian-Wind Power Planning Meeting Proceedings.

______________. 1996 Suggested Practices for Monitoring Bird Populations,
Movements and Mortality in Wind Resource Areas. 1994 National Avian-Wind
Power Planning Meeting Proceedings.

Gauthreaux S.A. and C.G. Belser 2006. Effects of Artifical Lighting on Migratory
Birds. In Ecological Consequences of Artificial Night Lighting. Edited by
Catherine Rich and Travis Longcore. Island Press

Glantz, S.A. and B.K. Slinker. 2001. Primer of Applied Regression and Analysis
of Variance, second edition. McGraw-Hill Inc.

Hanson, P. and J.A. Cooper. 1994. Nocturnal Behavior of Breeding Trumpeter
Swans. The Auk 111(4): 1013 – 1018.

Hodos W. 2003. Minimization of Motion Smear: Reducing Avian Collisions with
Wind Turbines. Subcontractor Report. Period of Performance: July 12, 1999-
August 31, 2002. NREL/SR-500-249. National Renewable Energy Laboratory,
Golden Colorado. [online] Available: www.nrel.gov

Howell J.A and J. Noone. 1992. Examination of Avian Use and Mortality at U.S.
Windpower Wind Energy Development Site, Solano County, California. Final
Report to Solano County Department of Environmental Management, Fairfield,
CA.

Howell J.A. 1997. Bird Mortality at Rotor Swept Equivalents, Altamont Pass and
Montezuma Hills, California. Trans. West. Sect. Wildl. Soc. 33:24-29

Haug E.A. and B.A. Millsap and M.S. Martell. 1993. Western Burrowing Owl
(Athene cunicularia hypugaea). In Birds of North America, No. 61 (A. Poole and
F. Gill, Eds.). Philadelphia: The Academy of Natural Sciences; Washington,
D.C.: The American Orthnithologists! Union.
http://bna.birds.cornell.edu/BNA/account/Burrowing_Owl

Houston, C.S D.G. Smith and C. Rohner. 1998. Great Horned Owl (Bubo
virginianus) In Birds of North America, No. 372 (A. Poole and F. Gill, Eds.).
Philadelphia: The Academy of Natural Sciences; Washington, D.C.: The
American Orthnithologists! Union.

Johnsgard P.A. 1990. Hawks, Eagles and Falcons of North America. Biology
and Natural History. Smithsonian Institution Press. Washington and London.
25

_______. 2002. North American Owls Second Edition. Biology and Natural
History. Smithsonian Institution Press. Washington and London

Johnson G.D. et al., 2006 Avian Monitoring Studies at Buffalo Ridge Wind
Resource Area, Monnesota; Results of a 4-year Study. Technical Report
prepared for Northern States Power Company. Minneapolis, MN. 212 pp.

Kennedy S. 2005. Wind Power Planning: assessing long term costs and benefits.
Energy Policy 33 1661-1675

Keith D.W., J.F. Decarolis, D.C. Denkenberger, D.H. Lenschow, S.L. Malyshev,
S. Pacala and P.J. Rasch. 2004. The influence of large-scale wind power on
global climate. Proceedings of the National Academy of Science. Vol. 101 no.
46 pp. 16115-16120. The National Academy of Sciences of the USA. [on-line]
Available: www.pnas.org/cgi/doi/10.1073/pnas.0406930101.

Kenward, R. E. 2001. A Manual for Wildlife Radio Tagging. Academic Press. San
Diego, California.

Kepler C.B and J.M. Scott. 1981. Reducing Bird Count Variability by Training
Observers. Studies in Avian Biology No. 6:366-371. The Cooper Society.

King, J.O and T.D. King. 1994. “In my Experience” Use of A Ling-Distance Night
Visiond Device for Wildlife Studies. Wildl. Soc. Bull 22: 121-125, 1994. The
Wildlife Society.

Koplin, J.R., M.W. Collopy, A.R. Bammann, and H. Levenson. 1980. Energetics
of Two Wintering Raptors. The Auk 97: 795 – 806. The American Ornithologist!s
Union. Washington. D.C.

Krewitt W and J. Nitsch 2003. The potential for electricity generation from
on-shore wind energy under the constraints of nature conservation: a case study
for two regions in Germany. Renewable Energy 28 1645–1655

Kunz, T., E.B Arnett, B.M. Cooper, W.P. Erickson, R.L. Larkin, T. Mabee, M.L.
Morrison, M.D. Strickland and J.M. Szewczak 2007. Methods and Material for
Studying Impacts of Wind Energy Development on Nocturnal Species (Birds and
Bats) Draft 1-5 January 2007. National Wind Coordinating Committee (NWCC)

Mackenzie, D., J.D Nicholos, J.A. Royle, K.H. Pollock, L.L. Bailey and J.E. Hines
2006. Occupancy, Estimation and Modeling. Academic Press.
26

Marti, C.D. and A.F. Poole and L.R. Bevier (2005). Barn Owl (Tyto alba). The
Birds of North America Online (A. Poole Ed.). Ithaca: Cornell Laboratory of
Ornithology; Retrieved from the Birds of North America [on-line] Available:
http://bna.birds.cornell.edu/BNA/account/Barn_Owl/.

Martin, P. and P. Bateson. 1993. Measuring Behavior: An Introductory Guide.
Second Edition. Cambridge University Press.

McIsaac, H.P. 2000. Raptor Acuity and Wind Turbine Blade Conspicuity.
National Avian-Wind Power Planning Meeting IV. Carmel, California. May 16 –
17, 2000.

Nordberg U.M. 1990. Vertebrate Flight: Mechanics, Physiology, Morphology,
Ecology and Evolution. Springer-Verlag.

NREL. 2006. National Renewable Energy Laboratory. Golden, Colorado [on-
line] Available: nrel.gov

Orloff, S and A Flannery. 1992. Wind Turbine Effects on Avian Activity, habitat
Use, and Mortality in Altamont Pass and Solano County Wind Resource Areas,
1989 – 1991. Final Report to Alameda, Costra Costa and Solano Counties and
the California Energy Commission by Biosystems Analysis, Inc., Tiburon, CA.

_____________. 1996. A Continued Examination of Avian Mortality in the
Altamont Pass Wind Resource Area. Final Report to the California Energy
Commission by Biosystems Analysis, Inc., Tiburon, CA.

Pennycuick, C.J. 1989. Bird Flight Performance: A Practical Calculation Manual.
Oxford University Press. London.

Preston, C.R. and R.D. Beane. 1993. Red-tailed hawk (Buteo jamaicensis). In
Birds of North America, No. 52 (A. Poole and F. Gill, Ed.). Philadelphia: The
Academy of Natural Sciences; Washington, D.C.: The American Orthnithologists!
Union. [on-line] Available: http://bna.birds.cornell.edu/BNA/account/Red-
tailed_Hawk/

Preston, C.R. 1981. Environmental Influence on Soaring in Wintering Red-tailed
Hawks. Wilson Bull., 93(3) pp 350-356.

Preston, C.R. 1990. Distribution of Raptor Foraging in Relation to Prey Biomass
and Habitat Structure. The Condor 92: 107 – 112. The Cooper Ornithological
Society.
27

Ralph C.J., S. Droege and J.R. Sauer. 1995. Managing and Monitoring Birds
Using Point Counts: Standards and Applications. In USDA Forest Service Gen.
Tech. Rep PSW-GTR-149.

Reynolds, R.T., J.M. Scott and R.A. Nussbaum. 1980. A Variable Circular-plot
Method for estimating Bird Numbers. Condor, 82: 309-313. The Cooper
Ornithological Society.

Russell, Robert W. 1991. Nocturnal Flight by Migrant “Diurnal” Raptors. J. Field
Ornithol., 62(4):505-508.

Russell et, al. 1991. A Visual Study of Migrating Owls at Cape May Point, New
Jersey. Condor, 93: 55-61. The Cooper Ornithological Society.

Scott J.M. and F.L. Ramsey. 1981. Length of Count Period as a Possible
Source of Bias in Estimating Bird Densities. Studies in Avian Biology No. 6: 409 -
413

Smallwood J.A., and D.M. Bird 2002. American Kestrel (Falco sparverius) In
Birds of North America, No. 602 (A. Poole and F. Gill, Eds.). Philadelphia: The
Academy of Natural Sciences; Washington, D.C.: The American Orthnithologists!
Union. [on-line] Available:
http://bna.birds.cornell.edu/BNA/account/American_Kestrel/

Smith F.G and T.A. King. 2000. Optics and Photonics: An Introduction. 21.6
Image Intensifers pp. 395-397. John Wiley and Sons, Ltd

Spera, D.A. 1998. Wind Turbine Technology. Fundamental Concepts of Wind
Turbine Engineering. American Society of Mechanical Engineers (ASME) Press.

SPSS Inc. 2005 SPSS OS X Version 11.0.4, Chicago, ILL.

Thelander C.G., and K.S. Smallwood. 2004. Developing Methods to Reduce
Bird Mortality in the Altamont Pass Wind Resource Area. Final Report by
BioResource Consultants to the California Energy Commission, Public Interest
Energy-Environmental Area, Contract No. 500-01-019: L Spiegel, Program
Manager. 363 pp. + appendices.

Thelander C.G. and K.S. Smallwood, and Rugge L. 2003. Bird Risk Behaviors
and Fatalities at the Alatmont Pass Wind Resource Area. Subcontractor Report.
Period of Performance: March 1998-December 2000. NREL/SR-500-33829.
National Renewable Energy Laboratory, Golden Colorado.
28

Thompson, S.K. 1992. Sampling. Wiley Series in Probability and Mathematical
Statistics.

Thorsen, S. 2006. Sunrise and Sunset/Moonrise and Moon Set in San
Francisco, CA, U.S.A. [on-line] Available: www.timeanddate.com

Tucker, V.A. 1996. A Mathematical Model of Bird Collisions with Wind Turbine
Rotors. Journal of Solar Energy Engineering. Volume 118 pp. 253-262

______. 1996. Using a Collision Model to Design Safe Wind Turbine Rotors for
Birds. Journal of Solar Energy Engineering. Volume 118 pp. 263-269

Videler, J.J. 2005. Avian Flight. Oxford Ornithology Series. Oxford University
Press. London.

WEST Inc. 2006. Wildlife Monitoring at Altamont Pass Winter 05- Early Fall 06.
Preliminary Draft Results. Prepared for Alameda County Scientific Review
Committee. Submitted by APWRA Avian Monitoring Team and WEST Inc.

Whittow. G.C. 2000. Sturkies Avian Physiology 5th Edition. Academic Press.

Zar, Jerrold H. 1996. Biological Statistical Analysis. Third Edition. Prentice Hall.
29

Figure Legends and Tables

Table 1. Raptor species

Table 2. Calibration experiment

Figure 1. Wind turbines

Figure 2. NVD (photo of pocketscope)

Figure 3. Study site map

Figure 4. VCO design

Figures 5 and 6 Study design (plot1 and plots 2 -6)

Figure 7. NV photograph of wind turbines with sheep

Figure 8. Species distribution

Figure 9. Time after sunset

Figure 10. Date of observation

Figure 11. Flight Behavior distribution

Figure 12. Perching Behavior distribution
30

Table 1. Diurnal and Nocturnal Raptors Observed on EnXco 5 Site between
August and December 2006 * indicates raptors observed during point counts

                Common Name                Scientific Name

               Turkey Vulture              Cathartes aura
               White-tailed Kite           Elanus leucurus
               Northern Harrier           Circus cyaneus
               Swainson!s Hawk            Buteo swainsoni
               Red-tailed Hawk *          Buteo jamaicensis
               American Kestrel *         Falco sparverius
               Merlin                     Falco columbarius
               Peregrine Falcon           Falco peregrinus
               Barn Owl *                 Tyto alba
               Great Horned Owl *         Bubo virginianus
               Burrowing Owl *            Athene cunicularia
               Spotted/Barred Owl         Strix species
31 Table 2. Observations of the captive raptors at Bird Rescue Center on 10 December 2006 with no moon and 100% cloud cover. Distance is in meters. Perching is raptor position on perch with wing folder against body and flapping is raptor with fully extended wings and flapped wings in place. Species Distance Perching Flapping RTHA 50 + + RTHA 100 + + RTHA 150 + + AMKE 50 + + AMKE 100 - - AMKE 150 - - GHOW 50 + + GHOW 100 + + GHOW 150 + + BAOW 50 + + BAOW 100 + + BAOW 150 + + RTHA =Red-tailed Hawk, AMKE = American Kestrel, GHOW = Great-horned Owl and BAOW = Barn Owl (+) = resolution to species identification (-) = 0 resolution to species identification
32

                                a
                                                                           b

Fig. 1. Shows the two types of wind turbines on the research site. a). General
Electric 1.5 MW b). Kenetech 56 (100) kW.
33 Fig. 2 Light- Intensifying Night Vision Device. Model 7 Pocketscope with 75 mm. f1/4 2.75X magnification, waterproof lens (Star Tron Corporation).
34

 Fig. 3 General overview of research site. This site is located
approximately 3 miles east of Birds Landing, CA between Bird
Landing and Collinsville, CA. 7 miles south of the intersection of
Hwy 12, with Fairfield to the west and Rio Vista to the east. Plot 1
(black dots) represent 6 GE 1.5MW Turbines and Plots 2- 6 (red
and green dots) represent the 24.6 and 18.5 meter kenetech (56)
100 kW turbines
35

                                              A

                                         B

Fig 4. This photograph represents an example of the VCO design is
used to collect data during the 10 minute point counts for the
observation of raptors at plots 2 -6. A). The triangle represents the view
of the observer for one of four observation points within the plot.
B). Represents an imagery line where the reference light intersects the
observation point.
36 Fig. 5 Represents the study design for plots 2 – 6 (turbine string). Observer points A –D are arranged in a clockwise pattern, beginning where the road enters the plot. The buffer represents the VCP portion of the design where distance of detection varies from 50-150 meters.
37

Fig. 6. Represents the study design for Plot 1. Note observers are in line with
each other and observer an area that includes 100 meters on both sides of the
wind turbine group. This modification of design allows a 20 minute point count
that normalized survey effort between plot 1 and plots 2 -6.
38

Fig. 7. Shows a Night Vision Photograph of Wind Turbines taken through the
Model 7 NVD (sheep for scale) using digiscoping with an Olympus C – 7000
camera. This photograph was taken on a full moon night with no cloud cover at 9
p.m. on 10 December 2006.
39

                                                                    1 = Red-tailed Hawk

Number of Observations                                              2 = American Kestrel

                                                                    3 = Barn Owl

                                                                    4 = Great Horned Owl

                                                                    5 = Barred Owl

                                                                    6 = Burrowing Owl

                                                                    7 = Raptor (diurnal)

                                                                    8 = Raptor (Nocturnal)

                                         Species

                         Fig. 8. Distribution of species during 10/20 minute point counts.
                         Barn Owl was the most abundant. The significance of species
                         numbers 1,2 & 7 (n = 4, 2 and 2) is that these species were all
                         diurnal raptors demonstrating activity during nocturnal periods.
40
Date
1 = Red-tailed Hawk
2 = American Kestrel
3 = Barn Owl
4 = Great Horned Owl
5 = Strix Owl
6 = Burrowing Owl
7 = Raptor (diurnal)
8 = Raptor (Nocturnal)
Number of Individuals
Fig. 9. Date of observation of raptors. Diurnal raptors were seen early in the
season and nocturnal raptors were seen later in the season.41
Time after sunset (hours)
= Raptor (Nocturnal)
=Raptor (Diurnal)
=Burrowing Owl
= Strix Owl
= Great-horned Owl
= Barn Owl
= American Kestrel
= Red-tailed Hawk
Number of individuals
Fig. 10. Time after sunset of raptors observations. September through
November 2006. Red-tailed Hawks were active throughout the survey
period, American kestrels and Burrowing Owls were active earlier in the
survey period. These times are well after sunset.42
1 = Flying
2 = Flushed
Number of Observations
3 = Flying/Hunting
4 = Flying/Flushed
1 2 3 4
Flight Behavior
Fig. 11. Flight behavior distribution of raptors observed during
survey period. (n = 38) all categories demonstrate flight behavior
that may lead to a mortality.43
1 = Ground
2 = Ground
3 = Fence Post
Number of Observations
4 = Electrical Boxes
5 = Turbine Superstructure
6 = Distribution Line
7 = Transmission Line
8 = Nacelle
High Risk =
Low Risk =
Perching Location
Fig. 12. Locations of raptors observed perching during survey period (n = 30).
36% (n = 11) were at high mortality risk based on perch location.You can also read