INFRASTRUCTURE EVIDENCE BASE - Productive Water February 2014 - NZ Treasury
←
→
Page content transcription
If your browser does not render page correctly, please read the page content below

INFRASTRUCTURE
EVIDENCE BASE
Productive Water

February 2014

                   For more information visit: www.infrastructure.govt.nz
EVIDENCE BASE: PRODUCTIVE WATER
EVIDENCE
BASE
Productive Water                                                                                                                     February 2014

Introduction
Infrastructure is a crucial part of the New Zealand economy. It supports the day to day activities of New Zealanders, helps to improve
living standards for all, and can be a driver for economic growth. As such, it is vital that it is managed as well as possible. The National
Infrastructure Plan 2011 sets out a long term vision for New Zealand’s infrastructure and seeks to provide a common direction for how
we plan, fund, build and use all economic and social infrastructure.

                                                                        By 2030 New Zealand’s infrastructure is resilient, coordinated and
                                                           Vision

                                                                           contributes to economic growth and increased quality of life
                                                           Outcomes

                                                                         Better use of existing                  Better allocation of new
                                                                            infrastructure                             investment

                                                                          Investment analysis                 Accountability / Performance
                                                           Principles

                                                                               Resilience                               Regulation

                                                                          Funding mechanisms                          Coordination

A significant constraint identified in the National Infrastructure Plan 2011 was the lack of information about asset condition and
performance to allow more informed decisions and efficient and effective investment. A key part of the National Infrastructure Unit’s
(NIU) work programme over the past two years has been to develop a more robust Evidence Base to address this constraint. In
particular, publishing the Evidence Base enables a discussion identifying the significant issues for New Zealand infrastructure and
options to respond to these. Discussion of these will underpin the NIU’s work programme over 2014, through to the release of the next
National Infrastructure Plan in 2015.

The Evidence Base draws together work on performance indicators (the current state of the infrastructure), scenario and trend analysis
(the future pressures or drivers of demand), the national resilience picture, and the first 10-year Capital Intentions Plan (what is known
about indicative future spend).

This document forms the substantive component of the Evidence Base for the productive water sector, which the NIU defines as
irrigation with a focus on the main irrigation schemes and some passing comment on water used for electricity generation. It follows
from the overview document, which can be found on the NIU’s website. It draws information from the performance indicators, scenario
and trend analysis, and resilience assessment.

Where data has been provided, this is publically available information, and has been provided with permission of the information owner.

                                                                                       For more information visit: www.infrastructure.govt.nz
EVIDENCE BASE: PRODUCTIVE WATER
Overview messages
Irrigation can be found throughout New Zealand but is concentrated in a small number of regions, particularly Canterbury (62%)
followed by Otago (13%). Irrigation schemes serve 245,000ha of the 721,700ha irrigated.
There is a large variation in asset condition, age and efficiency, which is reflected in the wide range of water cost – a factor of 10
between lowest and highest in one Canterbury analysis, and productivity varies across schemes.
There is also a wide range of asset management practices from immature through to comprehensive asset management programmes.
Improvements are being made, driven by increasing liability, changing management structures, increasing regulatory
reporting/monitoring, requirements to access Irrigation Acceleration Fund support and investor scrutiny where capital raising.
However, there is widespread investment uncertainty regarding future management expectations for contaminants, including nutrients,
and therefore the ability to intensify land use alongside mitigation cost implications for existing and intensified land use.
Future irrigation development and its associated land use will have to perform to a higher environmental standard than has been
previously required, raising short-term affordability issues. Water from new irrigation schemes or schemes undergoing modernisation
will be expensive to deliver; it is widely recognised that ‘the readily available water is gone’. Add to this the additional cost of
environmental mitigations on farm and the initial capital investment has now considerably increased. This will require future
consideration of the intergenerational nature of irrigation development, and a better understanding of where the costs and benefits sit.
Another risk for the sector is that sub-optimal infrastructure development may occur if inefficient processes are adopted to address the
necessary iterative cycle of uptake, design, finance and consent considerations within business case risk management. Although, there
is an opportunity to collaboratively build on the learnings of each scheme development and utilise existing capital infrastructure
development processes, this is an area that should be considered further.
Resilience assessments within the sector could also be developed further.
Irrigation has significant interdependencies with the wider infrastructure network – increased pressure on the electricity lines network,
synergies and conflicts with hydro-generation assets, changed requirements of the transport network, and an increased need for a
modern telecommunications network (RBI) are all integral to operational efficiency for modern schemes and their shareholders
enterprises. There are also indirect links to increased need for social infrastructure as irrigated farms employ more FTE’s per hectare.
Context
Large-scale irrigation in New Zealand began in the late 19th century, particularly in the Central Otago region. During the Great
Depression of the 1930's, several large-scale irrigation projects such as the Rangitata Diversion Race were built using government
funding. The majority of major schemes were constructed between 1960 and the mid 1980’s in the Canterbury and Otago regions.
In 1988, central government began to transfer ownership of the Crown schemes to farmers. No schemes remain in Crown ownership.
In 1991, responsibility for approving scheme development was devolved to local government under the Resource Management Act
1991. Central government re-focused its interventions on funding science and technology development,
and in later years on better facilitating the planning and proposal development process, through initiatives
such as the Sustainable Farming Fund and the Community Irrigation Fund.
A limited number of schemes have been developed since devolution, including Opuha Dam (1998,
3
72,000,000m ), Waimakariri (1999, 18,000ha), North Otago Stage 1 (2006, 10,000ha), and the Wai-iti
3
Valley Augmentation Dam (2006, 800,000m ). Each of these projects had significant backing from
territorial authorities. More recently, Barrhill Chertsey (2010, 10,000ha) and Acton Farmers Irrigation
Cooperative (2011, 6600ha) are operating, Rangitata South is constructed and Central Plains Water
(60,000ha) begins stage 1 construction in February 2014.
As captured in the Business Growth Agenda, the Government is committed to improving both the urban
and productive water sectors and delivering a sustainable approach to water infrastructure management
2EVIDENCE BASE: PRODUCTIVE WATER
into the future. This recognises that water resources are critical for the primary production sectors and water is New Zealand’s
competitive advantage for our export industries. Recent initiatives include:
The Irrigation Acceleration Fund. Now into its second year of operation, it has allocated $18.3 million – supporting 11 projects
across Hawkes Bay, Wairarapa, Canterbury and Otago. The primary focus of the fund is to support the development of rural water
infrastructure proposals to the investment-ready prospectus stage.
The establishment of Crown Irrigation Investments Ltd. The company will act as a bridging investor for regional water infrastructure
projects, helping kick-start projects that are commercially viable in the longer term and manage the initial uptake risk period. The
Government has set aside $80 million in Budget 2013 for this purpose.
What do we have?
Statistics New Zealand data shows that in 2012, there was a
total of 721,700 hectares of irrigated land. The majority of this
is in Canterbury (444,800 hectares or 62%) with Otago the
second largest region (93,900 hectares or 13%). The largest
North Island region was Hawkes Bay with 26,000 hectares or
4%.
The 721,700 hectares in 2012 is an increase of 16% over 2007
(619,300 hectares). The majority of this growth was in
Canterbury with a further 59,500 hectares, Manawatu-
Wanganui with 10,000 hectares and Waikato with 4,400
hectares.
Most of the following data and commentary relate to irrigation
schemes. This reflects the availability of data, despite
irrigation schemes only making up 34% of total irrigated
hectares. Source: Statistics NZ
Key features from Irrigation NZ irrigation scheme data show:
Irrigation schemes currently account for 245,000ha of the national irrigated area. There is approximately another 250,000ha at
varying stages of development.
The wide range of scheme size in NZ. Whilst the median scheme irrigated area is 4,400ha, the largest (schemes supplied by the
Rangitata Diversion Race) currently irrigates 66,000ha, whereas there are also a number of irrigation schemes irrigating under
1,000ha (Maungatapere in Northland for example).
The average number of shareholders per scheme is 118 with the range from under 10 to over 350. Shareholders are typically
irrigators operating within a cooperative company structure.
The vast majority of schemes are run of river with few currently having any significant storage (excluding buffer ponds and tanks
serving operational purposes) and consequently subject to water supply reductions that may compromise reliable water application.
3
Opuha is an exception with 72million m of storage servicing 16,0000ha of irrigation, but it still has a risk of supply shortfalls in dry
summers.
The irrigation schemes have extensive distribution networks, the largest having over 100km of piping or 200km of open channels.
The 10 largest schemes’ water takes on average equate to 0.62 l/s/ha but range between 0.45 and 0.85 l/s/ha. Their combined take
3
allows the extraction of 130 m /s.
3EVIDENCE BASE: PRODUCTIVE WATER
Alongside irrigation, water is fundamental to the generation of New Zealand’s electricity supply with over 75% of New Zealand’s
electricity coming from power stations that are dependent upon freshwater – 60% from hydro stations, and 17% from freshwater-cooled
thermal stations.1
Is it where it needs to be?
The location of irrigation schemes is driven by the need for irrigation to enable a range of land uses where rainfall is insufficient and/or
unreliable. Factors include: climate, soil water characteristics, the availability of irrigable land (plains and gently sloping land), and the
practicality of conveying a reliable water supply to it. As a result the vast majority of irrigation is located upon the plains and foothills of
New Zealand’s East Coast (approx 87% of irrigated hectares), particularly where rivers provide a ready source of water as they flow
from New Zealand’s mountain ranges to the sea.
Where the natural climate and soils are able to underpin a range of land uses, there is less value in developing irrigation. However
recent drought events have demonstrated the value of irrigation for risk management in these areas, particularly for high value crops.
Unlike other infrastructure sectors, irrigation directly increases the production base. It therefore requires a comparable increase in the
level of service from other infrastructure sectors, both directly, particularly energy and transport, and indirectly, where irrigation results
in greater employment and thus an increased need for social infrastructure associated with supporting growing populations. 80% of
irrigated hectares are in regions that are serviced by New Zealand 5 largest export ports (by value).
Alongside transport a key infrastructure dependency associated with irrigation is the need for a secure electricity supply. The growth in
irrigation has changed the electricity demand profile with the summer demand from irrigation now higher in some areas than the
traditionally higher winter demand (driven by space heating). For example, Electricity Ashburton report summer demand as more than
double the winter period demand. Network capacity has grown at 10% compounded for the last ten years and maintenance/capital
upgrades requiring equipment outages must be scheduled around peak irrigation periods.
Energy generation can be either synergistic or competitive with irrigation for water supply, depending on the specific situation; for
example, the Waitaki storage system enables high reliability of irrigation water to some schemes but competes for water with others.
There are opportunities to develop infrastructure in future which can be operated to better utilise capital and water for both purposes.
80% of irrigation is located in or next to regions that generate significant amounts of New Zealand’s electricity (Southland, Otago,
Canterbury and Waikato).
An understated but now emerging role for irrigation infrastructure is to provide for recreational and environmental wants of the
community which are themselves undersupplied by the more variable climate. Opuha Dam was an early result of the recognition that
lack of rainfall was affecting fishing and recreational values in the Opihi River as well as irrigation reliability. Many more instances of
realising multiple benefits are likely to emerge throughout NZ as communities become involved in collaborative approaches to
optimising outcomes from water.
What quality is it?
Reliability of supply has been identified as essential to enable efficient application of water which is required to minimise nutrient loss
and avoid over-build of infrastructure. Many schemes were built when water allocation favoured minimising production losses in
droughts over in-stream and high value productive uses, exemplified by the low number of schemes with storage. Irrigation NZ data
shows reliability typically ranging from 70 – 95% with a number of smaller ‘run of river’ schemes being as low as 50%.
1
Information prepared for the Land and Water Forum, 2010
4EVIDENCE BASE: PRODUCTIVE WATER
A number of schemes are investigating options to increase
reliability through the addition of storage. The universal
expectation is that reliability needs to increase above 90% to
encourage on-farm water efficiency and broaden the range of
potential uses.
Understanding the amount of allocable resource and having
hydrologically and environmentally sensible limits could help
reliability whereas use beyond a limit (or no limit) could decrease
reliability for all users (spread too thinly).
A further area of focus for irrigators is the duration of Resource
Consents, particularly considering the large upfront capital costs
required. Consents for the majority of the significant schemes run
through to at least 2031 with many issued for the maximum of 35
years. Source: NIU analysis of Irrigation NZ data
What capacity is it at?
The capacity of water infrastructure has two components – the ability to supply peak flows to farms during in the hottest weeks (peak),
and the ability to deliver sufficient water to the desired reliability during the season (volume). As a general rule, most irrigation
schemes are running at or just below their current peak flow capacity i.e. all of the water allocated from rivers above environmental
flows under consent requirements is committed to scheme shareholders. Most do not have sufficient storage for reliable supply in drier
years (volume).
However through on-going efficiency gains at both the scheme and farm scale, better co-ordination of peak water takes at the
catchment scale, and the development of strategic storage for volume reliability, there is much capacity for irrigation expansion from
within existing water take allocations. This is reflected by the number of existing schemes with plans for modernisation and subsequent
expansion without taking any more water, particularly in Canterbury and Otago.
Truly ‘greenfield’ irrigation scheme developments are mainly in areas such as the Wairarapa and Hawke’s Bay where scheme
development was not previously considered.
How resilient is it?
Required levels of resilience will vary depending on perspective. This assessment is made at a national level and for productive water
is yet to be developed with robust supporting evidence. NIU defines the resilience of infrastructure to include not just the physical or
hard assets but also other aspects such as how infrastructure organisations function, capacity and capability to fund, and community
awareness.
To provide an assessment of resilience, the water sector (urban and productive) has been disaggregated and qualitative methods
applied to compare resilience expectations (from a national perspective) with the assessed level of resilience to identify desired
improvements. These tabulations have been publicly available and presented in various forums through 2012 and 2013 and continue to
evolve as new information comes available.
5EVIDENCE BASE: PRODUCTIVE WATER
At this stage the resilience assessment for Key: Levels of Resilience
the water sector has largely been in the
High
urban water component including some
exercises looking at specific district water Medium
services. Ideally similar work would be
Low
undertaken in future for specific irrigation
schemes.
In the table to the right productive water is largely encompassed under
“Rural Water – Irrigation”. The rationale for a low rating (blue) for
resilience expectation is that from a national perspective there are
numerous schemes with considerable diversity across catchments and
across production types. Clearly from a local perspective a medium or
high level of resilience would be desirable.
As noted earlier there are significant interdependencies of productive water, both being dependent on other elements of infrastructure
to function and being a major contributor to demand on other sectors. This is probably the most important aspect going forward to
improve resilience.
How productive is it?
Analysis undertaken by New Zealand Institute of Economic Research (NZIER) in 2010 for the Ministry of Agriculture and Forestry
(MAF, now the Ministry for Primary Industries (MPI)), concluded that the net impact of irrigating an additional 347,000 hectares would
2
be $2.43 billion in added farm gate production, an increase of approximately $7,000 per irrigated hectare.
Inefficiencies exist with the large scale use of open races/channels to carry water. For example, Ashburton Lyndhurst Irrigation
Company calculated water losses from open channels were in excess of 15%. An $8 million piping development enabled a further 550
hectares to be irrigated by the 15% efficiency gain.3
A survey undertaken in 2012 for Ashburton Electricity Ltd shows the effective price of water supplied by the schemes, once the data set
was normalised, ranged from approximately $130-1,250/ha/year or $0.02-0.23/m3. The mean cost of water supplied by the schemes
3
was calculated as approximately $830/ha/year or $0.15/m (Aqualinc 2012).
How well are we managing it?
Nationally, making any statement about overall asset management is difficult due to the lack of a consistent set of data across all
irrigation schemes that is easily aggregated.
Anecdotally, asset management practices have been historically immature; there has not been a formalised annual process for
accountability and performance. In part due to the age of many of the schemes, the capital costs have been paid. This is gradually
changing, driven by a number of factors including:
increasing liability – the significant investment that efficient irrigation and its resulting land uses requires has created an increased
level of shareholder debt which the irrigation scheme water supply performance underpins
changing management structures – the majority of large schemes have recently employed skilled general managers with specific
responsibilities for the operation of the scheme, this has inevitably resulted in the gradual introduction of more formal asset
management systems
2
NZIER 2010, p13.
3
Irrigation NZ article – John Van Polanen, ALIL Chairman.
6EVIDENCE BASE: PRODUCTIVE WATER
increasing focus on regulatory factors with water use under increased scrutiny due to scarcity in some catchment areas and also
new dam safety requirements (larger races are also captured by the same legislation)
a number of newer schemes and proposed schemes that need to raise capital requiring greater discipline, and
the standards and requirements needing to be met to access the Irrigation Acceleration Fund etc.
Other factors have also worked to limit the incentives to improve technical, allocative and dynamic efficiencies – most obvious of these
is that many schemes charges have not covered the full operational, maintenance and particularly depreciation costs, and are levied on
a per hectare basis rather than a peak supply or volume used basis. All of these signals can and are being improved via current and
new infrastructure.
Due to the water measurement and reporting regulations 2010 the
overall understanding of national water use and consent data is rapidly
developing and has been a key focus of the freshwater reforms. The
2010 Aqualinc analysis concluded that actual water use assessments
showed that the percentage of water use compared to the consented
allocation varies between regions from below 30% to nearly 200%.
The 2012 data also shows a trend towards more effective irrigation
methods. Between 2007 and 2012, flood systems have decreased
from 18% to 13%, conversely, more efficient spray and drip-micro
systems have increased.
Source: Statistics NZ
What future trends and scenarios may impact productive water infrastructure?
As part of the development of the Evidence Base for New Zealand’s infrastructure, the NIU has undertaken an investigation into future
pressures placing demand on our infrastructure for a range of plausible scenarios: a central scenario (best estimate of future
4
infrastructure demand), an upside scenario (high infrastructure demand) and a downside scenario (low infrastructure demand). The
results of this investigation have been published in a separate document available on the NIU website, but relevant extracts for the
Productive Water sector are reproduced below.
Implications for productive water infrastructure in the central scenario
In the central scenario, global demand for commodities is assumed to increase as the world population grows, incomes rise and
consumer preferences change. Developing countries are driving a structural shift in commodity demand. A recent Reserve Bank report
(Sullivan & Aldridge, 2011) describes this phenomenon:
Growth in food demand is fastest in the early stages of a country’s development. As countries become wealthier, consumer
preferences switch from merely more food, to higher nutrient food. So in the initial stages of development a country may consume
higher quantities of rice, but as wealth continues to grow, other grains, such as wheat, become more popular, and then dairy and meat
become larger parts of the national diet. Eventually food demand becomes dictated more by population growth than income growth.
4
Each scenario has an associated set of projections of future infrastructure demand. The NIU has not produced any new models or
forecasts in this regard. Rather, we rely upon existing sector data and forecasts where applicable and relevant.
7EVIDENCE BASE: PRODUCTIVE WATER
This trend is especially evident in Asia where it appears that incomes still have much room to rise. Sullivan & Aldridge (2011) cite a
comparison of China with Taiwan to illustrate this point (data collated by Nomura Global Economics):
Average per capita annual food consumption (kilograms)
Period GNI per capita (USD) Grain Vegetables Meat Milk Fruit
Taiwan
1975 979 162 110 27 15 55
1980 2,394 134 130 43 25 70
1985 3,368 110 103 56 32 112
1990 8,325 102 93 63 43 132
1995 13,103 100 102 73 59 137
China
2000 934 265 132 39 3 46
2005 1,734 376 168 48 11 62
2008 3,427 444 171 42 15 65
Source: Taiwan Council of Agriculture, China Statistical Yearbook and Nomura
Global Economics (cited in Sullivan & Aldridge, 2011)
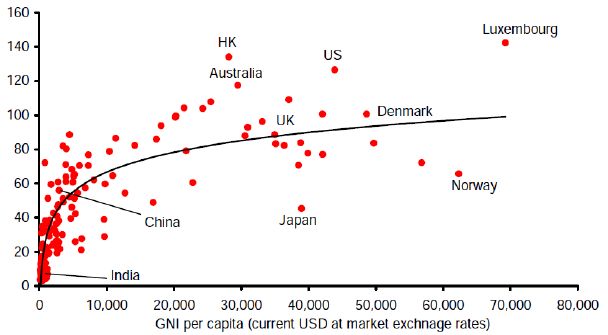
Similarly, Sullivan & Aldridge note that annual per
capita meat consumption correlates closely with per
capita income around the world (graph data from
FAO, World Bank and Nomura Global Economics).
Based on this data, the central scenario assumes that
global economic growth, and Asian growth in
particular, will bolster demand for proteins from New
Zealand. This trend will be facilitated by both our
geographic proximity to Asia and our relative
abundance of water which gives us a comparative
advantage in agricultural commodities markets.
Along with commodity-based water demand in the
central scenario comes a gradual increase in demand
for recreational and environmental benefits. Combined with climate change predictions, this will drive the need for reliable infrastructure
to store and distribute alpine-sourced water to take the pressure off groundwater and coastal rain-fed rivers along the east coast of
both islands.
The following graph estimates our total area of irrigated land over the next 10 years based on existing proposals. Whether these
proposals proceed, or are supplemented by even more schemes, depends on the continued strength of global agricultural commodity
demand and the availability of water sources.
8EVIDENCE BASE: PRODUCTIVE WATER
Existing, planned and proposed irrigation schemes in New Zealand
Source: ANZ, MPI, Irrigation NZ and Treasury analysis (2013)
Finally, at the same time that we face high demand for our commodities (especially animal proteins), the intensification of grazed
animal land uses in New Zealand will keep the spotlight on water quality in the coming years. The convergence of environmental,
social, cultural and economic interests will likely drive the need for new infrastructure, technology and management practices to
maintain or improve the health of our waterways. The government is currently investigating a number of reforms to ensure the quality
and quantity of our fresh water meets the needs of stakeholders.
Implications for productive water infrastructure in the upside scenario
In the productive water sector, climate change, with projected impacts
on rainfall and hydrology, will have a major impact on irrigation Renewable water resources (2007)
schemes. There will be regional differences in changes in rainfall,
presenting localised challenges for those designing and managing
irrigation schemes (Office of the Prime Minister's Chief Science
Advisor, 2013). The same report also highlighted that changes in
seasonal river flows and snow melt are likely.
The extent to which storage is available (or needed) for our irrigation
schemes will be a key factor in the infrastructure response to climate
change. Although climate change will stress our local resources to
some extent, our relatively bountiful water resources in other regions
5
may be a strategic advantage from a macro perspective. Irrigation
infrastructure can be used to collect allocated water from one
catchment and apply it in another. In the right circumstances, this can
alleviate allocation pressure in catchments with scarcity and provide Source: ANZ, United Nations ESCAP
water for environmental flows and recreational pursuits.
5
An increase in population and higher incomes for New Zealanders may further increase the domestic demand for water (including
environmental awareness and recreational uses). This will increase our requirements for water infrastructure and highlights the
need for robust systems that allocate and manage water quantity and quality across the various sectors of our society (e.g. urban
water, productive water, environmental flows).
9EVIDENCE BASE: PRODUCTIVE WATER
Implications for productive water infrastructure in the downside scenario
Although climate change will be less concerning in the downside scenario, demand for productive water infrastructure will also be
relatively low due to weak demand for our agricultural products.
Also, a proliferation of new technology, coupled with better information links through programs such as the Rural Broadband Initiative,
will drive innovation and productivity in the agricultural sector. Low cost sensors for water, crops, livestock, weather and geospatial data
may reduce or defer the need for capital upgrades. On the other hand, technology may in fact drive additional infrastructure investment
– if, for example, better assets and more storage is required to ensure the water supply is reliable enough to make the technology
investment worthwhile.
10EVIDENCE BASE: PRODUCTIVE WATER
Sources
Aqualinc. (2010). Update of water allocation data and estimate of actual water use of consented takes 2009–10. Report prepared for
the Ministry of the Environment.
Aqualinc. (2012). Survey of costs of surface water irrigation schemes in Canterbury. Report to Electricity Ashburton.
Irrigation New Zealand, 2012. Scheme data.
NZIER. (2010). The economic impact of increased irrigation. Final report to the Ministry of Agriculture and Forestry, 9 Nov 2010.
Office of the Chief Science Advisor, Sir Peter Gluckman. (2013). New Zealand’s changing climate and oceans: The impact of human
activity and implications for the future.
Reserve Bank of New Zealand (Sullivan, R., & Aldridge, T.). (2011). The outlook for commodity prices and implications for New
Zealand monetary policy.
Statistics NZ. (2012). Irrigable land – Agricultural production census 2012.
11You can also read