A Lithium Shortage: Are Electric Vehicles Under Threat?
←
→
Page content transcription
If your browser does not render page correctly, please read the page content below
A Lithium Shortage: Are Electric Vehicles Under Threat?

                                                        Date: 29 May 2011

                                                     Author: Jascha Forster

                                           Professor: Thomas F. Rutherford

                                       Lecture: Energy Economics and Policy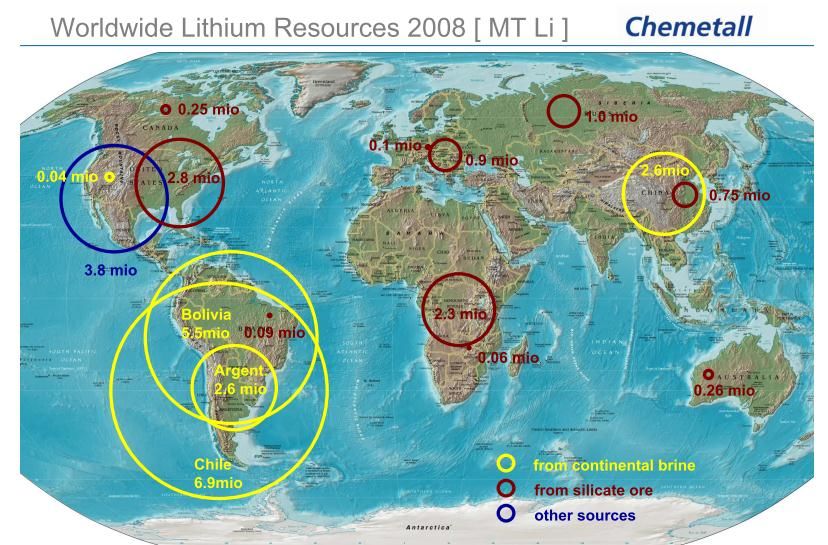
Table of Contents
Abstract ............................................................................................................................................................................................ 2

Introduction ...................................................................................................................................................................................... 3

    Lithium: A Resource With Many Applications .............................................................................................................................. 3

         Lithium And Its Properties....................................................................................................................................................... 3

         Lithium And Its Use ................................................................................................................................................................. 3

         How Essential Is Lithium For Electric Vehicles? ....................................................................................................................... 4

    Lithium Demand Characteristics .................................................................................................................................................. 4

    Lithium Supply Characteristics ..................................................................................................................................................... 5

         Extraction From Brines: ........................................................................................................................................................... 5

         Extraction From Minerals: ....................................................................................................................................................... 6

         Market Structure:.................................................................................................................................................................... 6

         World Lithium Resources ........................................................................................................................................................ 6

Methods/Model................................................................................................................................................................................ 7

    Lithium Supply Model .................................................................................................................................................................. 8

    Lithium Demand Model ............................................................................................................................................................... 8

Results .............................................................................................................................................................................................. 9

    Lithium Supply Scenarios ............................................................................................................................................................. 9

    Lithium Demand Scenarios ........................................................................................................................................................ 10

Discussion ....................................................................................................................................................................................... 16

    Supply Scenarios ........................................................................................................................................................................ 16

    Demand Scenarios ..................................................................................................................................................................... 16

    Supply and Demand are Inelastic ............................................................................................................................................... 16

    Consequences of Scenarios: Supply Shortage vs. Oversupply ................................................................................................... 17

         Extreme 1: Supply Shortage .................................................................................................................................................. 17

         Extreme 2: Massive Oversupply ............................................................................................................................................ 17

         Base Scenario: Oversupply .................................................................................................................................................... 17

Conclusion ...................................................................................................................................................................................... 18

References ...................................................................................................................................................................................... 19

Front-page images:

1 and 2: Salar de Uyuni, Bolivia (probably the largest lithium brine deposit in the world). Taken by Jascha Forster (2004)

3: Tesla Roadster: https://2009oilwiki.pbworks.com/w/page/33563030/MinasianCross (April 19, 2011)

                                                                                                                                                                                                           1
Abstract

Nowadays lithium is used in many fields. A drastic increase in lithium demand and hence an impending
supply shortage was predicted in the media due to the usage of this element in electric vehicle batteries
(EVB). The main problem in lithium supply is that suppliers are not able to instantly react on soaring
demand as ramping up production capacities takes a lot of time and money. A lithium shortage would
hinder the substitution of traditionally fuelled cars for electric cars. In this report, nine scenarios for the
future lithium market development are constructed. The most likely scenario predicts a lithium
oversupply. As both demand and supply are inelastic, an oversupply will lead to falling prices for the
next seven to eight years. Hence there is plenty of lithium production capacity and claims of impending
shortages are overdrawn. These findings are in line with predictions of some industry experts made in
early 2011. Both governmental decision makers and car manufacturers can use this report’s scenarios to
evaluate the consequences of possible future market outcomes.

                                                                                                                  2
Introduction

Lithium: A Resource With Many Applications
Lithium And Its Properties
Lithium is a silver white alkali metal with the chemical symbol Li. The high electrochemical potential of
lithium allows its use as an anode in batteries. Another property which makes it a preferred metal for
energy storage is its high power to weight ratio. The highest concentrations of lithium can be found in
minerals/ores and brines.

Lithium And Its Use
Lithium is used globally in Ceramics and glass (31%); batteries (23%); lubricating greases (10%); air
treatment (5%); continuous casting (4%); primary aluminium production (3%); other uses (24%)(1).

Although batteries account at the moment only for roughly a quarter of total lithium demand, this
segment is expected to grow much faster than any other(2). Many types of lithium batteries exist, as a
battery always consists of an anode and a cathode. The following types are the most common
combinations:

                                                                         (3)
Figure 1: Most common types of Lithium-Ion batteries (Source: Wikipedia )

The following chart gives an overview over the characteristics of different battery types and clearly
shows the advantages of Lithium-Ion-Batteries.

                                                                                  4
Figure 2: Advantages of Lithium-Ion Batteries (Source: Global X Funds: Lithium ETF )

In all the categories mentioned, lithium batteries outperform their competition5. Especially weight has a
high impact on the economics of a lithium battery powered vehicle6. It is therefore not surprising that
this segment is growing over proportionally fast, as depicted in the following graph.

                                                                                                            3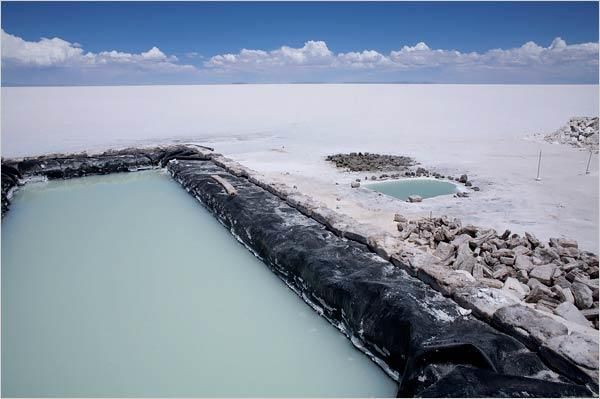
Figure 3: Market penetration of Lithium-Ion batteries (Source: Western Lithium WLC (2010), “The Role of
(7)
Lithium” )
How Essential Is Lithium For Electric Vehicles?
In a Lithium-Ion battery, roughly 150 grams of lithium are used to store 1 kWh (for calculations see
Figure 14). But how many kWh would an electric car use? An obvious differentiation has to be done
between hybrid electric vehicles (HEVs), plug-in hybrid electric vehicles (PHEVs) and “pure” electric
vehicles (EVs), as the latter need much more electricity because they lack a conventional combustion
engine. Two concrete examples would be the Ford Escape Hybrid, an HEV with a 1.8 kWh battery (~272
g lithium) and the electric car Coda Sedan powered by a 33.8 kWh Lithium-Ion battery (~5.1kg lithium).
In the category of purely electric cars one also has to differentiate between sports cars like the “Tesla
Roadster” that needs roughly 8.5 kg of lithium and cars that rather focus on eco-friendliness like the
Smart EV (also called Smart ED) that uses ~2kg of lithium. One can expect, however, that future cars will
have larger batteries, as the main disadvantage of electric vehicles is their limited range.
To get a feeling of how much battery power is needed for an electric car, the following comparison
might be helpful(8):
1 unit of lithium in a cell phone battery
3,000 units in a hybrid car
7,000 units in an electric car
Lithium Demand Characteristics
As mentioned above, lithium can be used in many industrial processes. It is however expected, that the
demand in the non-battery category will grow more or less constant over the coming years(2,9,10).
Therefore this report will only focus on the demand that is coming from the increased usage in
batteries. We focus on batteries used for electric vehicles because (i) this segment will grow much faster
than any other(2,11,12) and (ii) as seen before, EV batteries need 7000 times more lithium than a standard
cell phone, therefore a growth rate of 1% in the EV segment has a much higher impact on lithium
demand than a growth rate of 1% in the cell phone market.
Looking at the worldwide consumption of lithium, a 6% increase in consumption per year between 2000
(13,375 t) and 2008 (21,280 t) can be observed, which is equivalent to 113,270 t of lithium carbonate(2).
It is estimated that the total lithium carbonate demand will reach roughly 300,000 t by 2020, which
would mean an increase of over 200% in 10 years(2). One has to mention, however, that the economic
4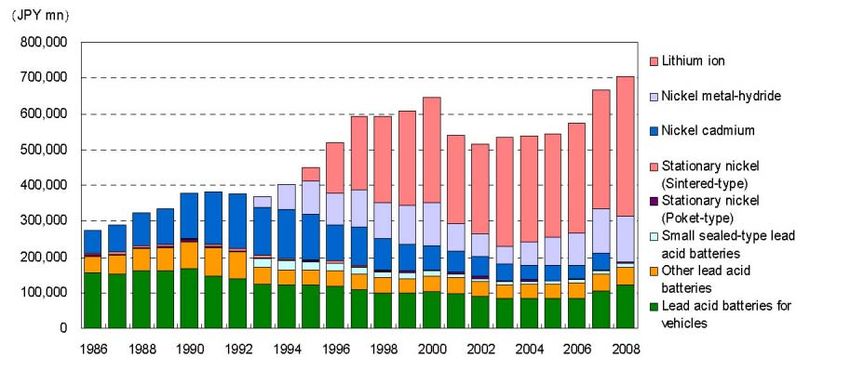
crisis affected the lithium market. Demand decreased mainly in 2008 and 2009. In 2010 however it is
expected that the market is growing again(13, 14, 15).
Prices also increased drastically over the last decade. Two obstacles make it difficult to determine the
real world price of lithium.
First, there is no official international exchange as for other metals (eg the London Metals
Exchange (LME)). Therefore buyers have to negotiate on an individual basis with suppliers.
Second, there are many different varieties (purities, particle size, etc) of lithium.
However, one can roughly estimate the price that is paid for “technical grade carbonate”, the type of
lithium that is usually used to produce batteries. Averaged over the biggest suppliers, lithium costs
increased from roughly $2000/ton in the year 2000 to roughly $6000/t in 2010(10,16).
Besides trends in consumption, a good indicator for future use of lithium is also the amount of money
that is invested by governments in research grants. In 2009, Obama allocated $2.4 billion for research in
manufacturing capacity for batteries and for the deployment of electric-drive vehicles. The plan of the
government was to launch an advanced battery industry in the US. This represents the “single largest
investment in advanced battery technology for hybrid and electric-drive vehicles ever made”(14). From
these $2.4 Billion, $940 Million will be invested into lithium related technologies (material supply,
battery manufacturing, recycling, etc), which underpins the prominence of this resource in the field of
battery research.
Lithium Supply Characteristics
Lithium is present in trace amounts in minerals/ores, brines, clays and sea water. The extraction from
ores and brines is however the only economically feasible method at the moment. Extracting lithium out
of minerals is energy and cost intensive. Hence the majority of lithium is nowadays sourced in brines.
Lithium quantities are often measured in lithium carbonate equivalents (LCE) as this is the main primary
compound that is used to form downstream lithium compounds. A typical value chain is depicted in the
following figure:
Figure 4: The lithium value chain (Source: McNulty and Khaykin (2009), „Lithium“, Credit Suisse Equity
( )
Research 10 )
Lithium carbonate equivalents (Li2CO3) contain
5.323 times less lithium/kg than pure lithium. In
other words, 1 kg of lithium is equivalent to
5.323 kg of LCE(7).
Extraction From Brines:
Lithium chloride is highly soluble, it can
Figure 5: Lithium Brine extraction from a salt flat (Source:
therefore only be found in a concentrated form www.commercialpressuresonland.org )
(17)
5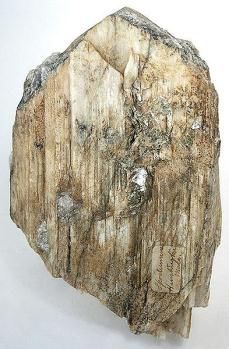
in regions where evaporation exceeds precipitation. Brines are pumped into evaporation pools (or
sprinkled on piles to maximize surface(17)). After evaporation, the residuals have to be transported to a
chemical plant were they are further purified and get processed to other lithium compounds. The
extraction cost from brines is estimated to be $1,400-$2,600/t lithium carbonate equivalent, depending
on the location of the brine and the extraction method used(10).
Extraction From Minerals:
There are many different lithium containing minerals. Currently “spodumene”(18) is the preferred
mineral because it has a high lithium content and is comparably easy to process. The extracted minerals
are first crushed, then milled and finally the different components are separated in flotation cells. As this
extraction method is very energy intensive, costs are also significantly higher than in brine extraction.
Typical costs for spodumene lithium extraction range from $4,300 to $4,800/tonne lithium carbonate
equivalent(10).
As mineral extraction from ores is 2 to 3 times more expensive than the brine method, the mineral
extraction companies define the marginal price and just become active when the quantity demanded
exceeds the quantity produced by the brine method. Up to 1997, the US was the largest Li producer
(almost entirely from ores). But as the US has almost no significant brines, the industry started to
collapse when the Chilean mines opened(9).
Market Structure:
The 3 largest lithium producers (“lithium big three”) account for 2/3 of total worldwide supply(10). These
are:
SQM (31% of world supply). Main Production facility in Chile
Rockwood (19% of world supply). Main Production facilities in Chile and the US
FMC (12% of world supply). Main Production facility is in Argentina
Besides South America, there are also large lithium deposits in China.
Due to prices that increased drastically in the past, many new sourcing projects (especially in China,
some also in Australia) were started and pipeline projects are expected to start producing from the
middle of this decade on. Also existing plants announced extensions of
their nameplate capacities.
World Lithium Resources
In 2007, William Tahil from Meridian International Research kicked off a
debate with his publication “The Trouble with Lithium”(19). He claimed that
there is “insufficient economically recoverable Lithium available in the
Earth's crust to sustain Electric Vehicle manufacture in the volumes
required, based solely on Li-Ion batteries”. Since this publication, a number
of papers dealing with this issue have been published. Some agree with
Tahil and predict a shortage of lithium, others claim that “peak lithium”
should be, at least in the near future, the least of our worries. One of the
most prominent researchers from the “no worries”-side is Keith Evans, a
Figure 6: Spodumene
geologist who published a paper titled “An abundance of lithium”(20). He Crystal (Source:
stated that “Concerns regarding lithium availability for hybrid or electric Wikipedia )
(18)
vehicle batteries or other foreseeable applications are unfounded”.
The main differences between the two sides are the underlying assumptions about what percentage of
total resources can actually be extracted. Interestingly, both sides more or less agree on the total
6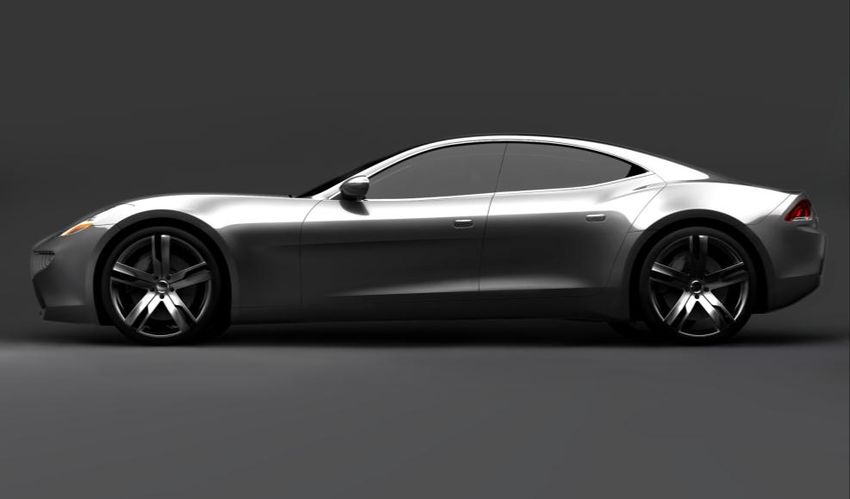
amount of lithium resources available. Evans states in his report that at the moment there are 28.5
million tonnes of expected lithium reserves (=economically exploitable), which is equivalent to nearly
150.0 million tonnes of lithium carbonate. Assuming a stable consumption of 16,000 tons per year
(approximate consumption in 2007), the resource would last for 1775 years.
The most prominent argument from the “shortage-side” is that there is only theoretically enough
lithium. The problem would be that lithium production is not able to keep up with the pace of the
commercialization of EVs.
A closer look at production capacities and the distribution of lithium resources shows the following: In
2008, it was calculated that worldwide LCE nameplate capacity (technical full–load sustained output of
all installed facilities) was roughly 130,000 tons/year, which would be equivalent to 24,400 tons of
lithium/year(10).
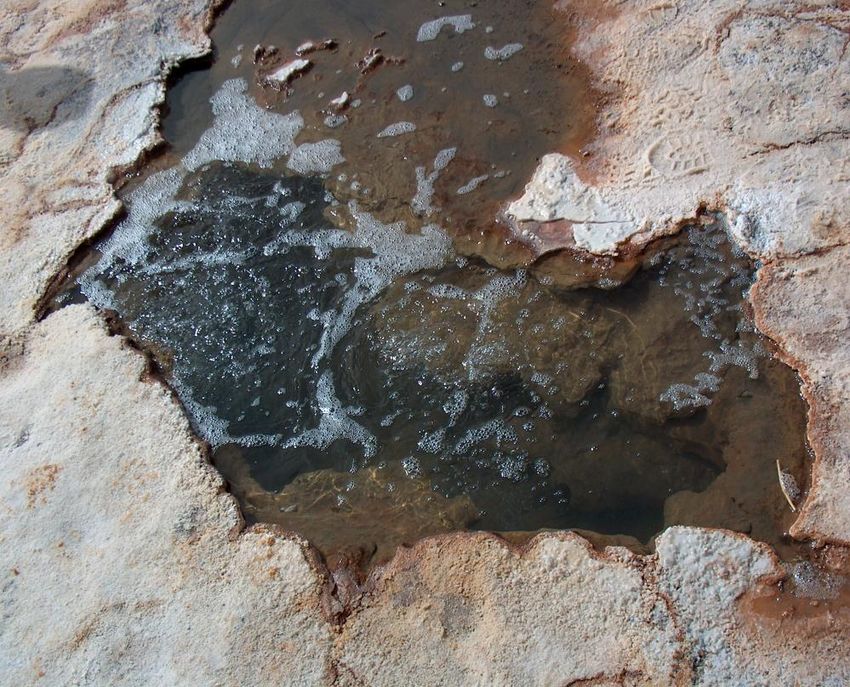
According to 2011 estimates of the USGS(21), total lithium resources (for definition see Appendix 1) are
29 million tons, which is an equivalent of 154,367,000 tons LCE. The largest resources are in Bolivia (9
million tons), Chile (>7.5 million tons), China (5.4 million tons) and Argentina (2.6 million tons), always
measured in pure Lithium, not LCE. Estimates about the total amount of extractable lithium resources
are however highly uncertain because they are based on assumptions about the concentrations in the
salt flats where brines are usually extracted. One example would be that an estimate which started the
discussion about “peak lithium” (19) only considered the 30km2 of the epicentre of the “Salar de
Atacama” in Argentina as a reserve, whereas the salt flat as a whole has a total surface of 3,500km2. The
reported 30km2 therefore account for less than 1% of the total amount of the “highest quality lithium
deposit in the world”, which shows than uncertainty is very large(9).
Figure 7: Worldwide Lithium Resources 2008 in MT Li (Source: Chemetall Statement (2009), “Lithium
(22)
Applications and Availability” )
Several assumptions made in previous papers have changed in recent years due to the breath-taking
pace of both technical and political developments in the field of electric vehicles. This report therefore
re-analyses both predictions about the future production as well as the future consumption of lithium
using the most recent data available.
Methods/Model
Based on supply and demand data from the past, information from market analysts, specifications of
electric vehicles and predictions about the future development of the market that can be found in
7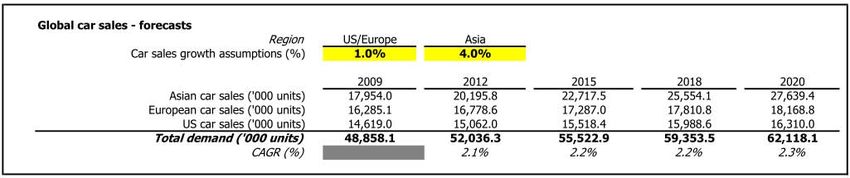
literature, several scenarios for lithium supply and demand can be constructed. All sources and the
numbers that were used can be found in Appendix 2.
The time horizon between 2008 and 2020 was chosen to first show how the scenarios fit into the
current empirical data and second to limit the error of predictions: On the demand side, technology
might change drastically in 10 years, so maybe we might be using batteries that are more promising
than lithium-ion batteries by then. It is obvious that supply will adjust to the demand in the long run, so
it makes no sense to compare supply and demand for a period longer than the one that is already
affected by past decisions and can practically not be influenced by current/future decisions. In the short
run, however, there might be a lithium supply shortage (or oversupply) due to the fact that it takes
several years to build up new plants. Sourcing contracts have to be negotiated with governments, which,
especially in South America, can be the most difficult task. In Bolivia for example, where the largest
lithium reserves of the world are expected, the government started to nationalize many energy
companies and although plans for sourcing lithium already existed for the last decade, no lithium was
sourced up to now.
Lithium Supply Model
Supply scenarios depend at least in the short run (next 10 years) heavily on current production
capacities, plants that are currently in the pipeline, and planned capacity expansions of current plants. A
supply scenario is therefore the sum of the existing and future capacities of each single company, plus a
prediction about future market entries and sourcing technologies. As company data is the most relevant
factor, only industry specialists in close contact with currently operating companies are able to make
sound predictions. The supply side scenarios are therefore solely based on the predictions of market
specialists.
Lithium Demand Model
To predict how much lithium is required to support the electric car revolution, one has to take the
following factors into account:
Amount of overall car sales (electric and non-electric)
Penetration of HEVs, PHEVs and EVs
Amount of Lithium needed per kWh
Amount of kWh per HEV, PHEV and EV
By joining these numbers one can derive several scenarios, based on different assumptions (for
assumptions see Appendix 2)
8Results
Lithium Supply Scenarios
There are 4 well-grounded supply scenarios available in literature. The most pessimistic one is from John
P. McNulty and Alina Khaykin, both research Analysts at Credit Suisse(10). They predict that future
nameplate capacity will halt below 40,000 t Lithium/year, and effective production will only grow slowly
but not reach the full nameplate capacity during the next 10 years. Tahil et all from Meridian
International Research however predict a more or less linear growth of effective production that will
exceed 50,000 t of Lithium/year in 2020(19). Industry consultants from TRU Group Inc., a consultancy that
has a specialized “lithium team” to analyse this market, claim that supply will grow somewhere between
linear and logarithmic(15). Research analysts from Dundee Securities Corporation that specialized in
resource investment research, predict an even steeper, roughly logarithmic growth(2). The 4 predictions
found in literature are summarized in the following plot:
Estimated Values for total Lithium Supply Tahil Effective
90'000 Production
Lithium (tons)
Lithium, metric tons
80'000
Credit Suisse
70'000 Effective
Production
60'000 Lithium (tons)
TRU Effective
50'000 Production
40'000 Lithium (tons)
30'000 Dundee Effective
Production
20'000 Lithium (tons)
2008 2010 2012 2014 2016 2018 2020
Figure 8: Estimated Values for Total Lithium Supply
Based on these predictions, 3 supply scenarios can be elaborated.
Supply Scenario 1: Pessimistic = low lithium supply
Supply Scenario 2: Base Scenario = “normal” lithium supply
Supply Scenario 3: Optimistic = high lithium supply
3 Scenarios: Total Lithium Supply
SP3: Positive Scenario
80'000
Effective Lithium
Production (tons)
70'000
Lithium, metric tons
60'000 SP2: Average Scenario
Effective Lithium
50'000 Production (tons)
40'000
SP1: Pessimistic
Scenario Effective
30'000 Lithium Production
(tons)
20'000
2008 2010 2012 2014 2016 2018 2020
Figure 9: 3 Scenarios: Total Lithium Supply
The pessimistic scenario describes the situation where only very few new plant capacities are built and
existing plants only slowly ramp up their production until they reach their full nameplate capacity. The
9optimistic scenario describes a situation where many new plant capacities are built and existing plants
aggressively ramp up their production to reach their full nameplate capacity as fast as possible.
Lithium Demand Scenarios
Future lithium demand obviously depends on many factors. Except for batteries however, the future
demand can be predicted with a comparably small error as these segments have been growing more or
less stable in the past years. In literature future growth rates of the non-battery segment is predicted to
follow a Compounded Annual Growth Rate (CAGR) of roughly 5% (9,10).
As mentioned in the methods chapter, it is crucial to know future global car sales to be able to predict
the amount of HEVs, PHEVs and EVs. The amount of cars (electric and non-electric) sold per year is
currently around 50,000,000 and is expected to surpass 62,000,000 by the year 2020(2). This opinion is
shared by many researchers.
Figure 10: Global Car Sales Forecast (Source: Tom Astle et all (2009), “Lithium - Hype or Substance? A
look at Lithium Demand and Supply” (2))
Opinions differ widely about the amount of HEVs, PHEVs and EV that will be sold during the next
decade. An overview of different analyses found in literature can be found in the following graph:
Amount of HEVs, PHEVs and EVs sold
30'000'000 Dundee Agressive Sales Estimate
SED4: total amount of electric
25'000'000 vehicles
Dundee High Sales Estimate
Amount of Cars sold
SED3: total amount of electric
20'000'000
vehicles
CS Estimate ALL Electric vehicles
15'000'000
10'000'000 Dundee Medium Sales Estimate
SED2: total amount of electric
5'000'000 vehicles
TRU Estimate: All HEV (HEV,
0 PHEV, EV)
2008 2010 2012 2014 2016 2018 2020 Dundee Low Sales Estimate
Year SED1: total amount of electric
vehicles
Figure 11: Amount of HEVs, PHEVs and EVs sold. The amount of HEV, PHEV and EVs is summed up in each
curve/estimate.
Again, 3 scenarios were built out of these estimates.
Scenario 1: Low penetration
Scenario 2: Medium penetration
Scenario 3: High penetration
10Global Sales of Electric vehicles by type:
Low penetration Scenario
22'000'000
20'000'000 SC1LEVSE: Low
18'000'000 EV Sales
Estimate
16'000'000
14'000'000
SC1LPHEVSE:
# of Cars
12'000'000 Low PHEV Sales
10'000'000 Estimate
8'000'000
6'000'000 SC1LHEVSE: Low
4'000'000 HEV Sales
2'000'000 Estimate
0
2006 2008 2010 2012 2014 2016 2018 2020
Year
Global Sales of Electric vehicles by type:
Medium penetration Scenario
22'000'000 SC2MEVSE: Medium
20'000'000 (=Average) EV Sales
18'000'000 Estimate
16'000'000
14'000'000 SC2MPHEVSE:
# of Cars
12'000'000 Medium (=Average)
10'000'000 PHEV Sales Estimate
8'000'000
6'000'000 SC2MHEVSE:
4'000'000 Medium (=Average)
2'000'000 HEV Sales Estimate
0
2006 2008 2010 2012 2014 2016 2018 2020
Year
Global Sales of Electric vehicles by type:
High penetration Scenario
22'000'000
20'000'000 SC3HEVSE: High
18'000'000 EV Sales Estimate
16'000'000
14'000'000
# of Cars
SC3HPHEVSE:
12'000'000
High PHEV Sales
10'000'000
Estimate
8'000'000
6'000'000 SC3HHEVSE: High
4'000'000 HEV Sales
2'000'000 Estimate
0
2006 2008 2010 2012 2014 2016 2018 2020
Year
Figure 12: 3 Scenarios: Global Sales of Electric Vehicles by Type
11The future share of HEVs, PHEV and EVs of the total electric car market is also disputed. All predictions
were averaged out which lead to the following distribution:
Market share of electric vehicles by type
Marketshare HEVs in % Marketshare PHEVs in % Marketshare Evs in %
100% 0 0 1 1 1 7 9 10 13 13 14 15 15
13
Marketshare in Percentage
18 21
80% 22 22 24 26 27 27 29 29
60%
100 100
40% 86 81 78 71 68 66 61 60 59 57 56
20%
0%
2008 2009 2010 2011 2012 2013 2014 2015 2016 2017 2018 2019 2020
Figure 13: Market Share of Electric Vehicles by Type
Whereas in the beginning there will be only HEVs, the share of PHEVs will start to increase from 2009
onwards. The significant increase in EVs will start a bit later due to their increased power need (which
leads to larger batteries that face many problems like overheating, space consumption, weight, etc). It
can further be expected that the growth rate of HEV sales will decrease as EVs become cheaper and
overcome their technical problem.
A lot of information on how much Lithium is needed per kWh in a standard Lithium-Ion battery can be
found in literature: Estimates are spanned from 80 grams of Lithium/kWh up to 300grams. Again we
take the average of all estimates (151 grams of Lithium/kWh) to proceed with the calculation.
Estimates: Lithium/kWh Lithium(g)/kWh
Dundee: Lithium required per kWh of battery capacity 80
CS: Lithium required per kWh of battery capacity 113
Abel: Lithium required per kWh of battery capacity 300
ZSW: Lithium required per kWh of battery capacity 150
Chemetall: Lithium required per kWh of battery capacity 113
Average Amount of Lithium required/kWh 151
Figure 14: Estimates Lithium/kWh
A next step would be to estimate the size of batteries required in the different car types. Also there we
can find many estimates. However, as there are already a couple of cars on the market, we can also use
real data. The following table gives an overview of collected data.
12HEV Estimates kWh/Car Lithium(g)/kWh Lithium/Car (g)
Dundee Estimate: 5.3 151 801
CS Estimate: 1.2 151 181
Edrive 7.2 151 1,088
Prius 1 (NiMH-Battery!) 1.8 151 272
Prius 2 (NiMH-Battery!) 1.3 151 196
Honda Insight 0.8 151 121
Ford Escape Hybrid 1.8 151 272
Average kWH/HEV 2.8 151 419
PHEV Estimates kWh/Car Lithium(g)/kWh Lithium/Car (g)
Dundee Estimate: 20.0 151 3,022
CS Estimate: 6.0 151 907
GM Volt 16.0 151 2,418
Hymotion Prius 6.3 151 952
Fisker Karma 22.6 151 3,415
BYD F3DM 16.0 151 2,418
GM New Saturn Vue 8.0 151 1,209
Average kWH/PHEV 13.6 151 2,049
EV Estimates kWh/Car Lithium(g)/kWh Lithium/Car (g)
Dundee Estimate: 50.0 151 7,556
CS Estimate: 12.0 151 1,813
Tesla Roadster 56.0 151 8,462
Smart EV First generation (sodium-
nickel chloride Zebra batteries!) 13.2 151 1,995
Smart EV Second generation (Li-
Ion Battery) 14.0 151 2,116
AC Propulsion eBox 35.0 151 5,289
Mitsubishi iMiEV 16.0 151 2,418
Think City 28.0 151 4,231
Nissan Leaf 24.0 151 3,627
Coda Sedan 33.8 151 5,108
Average kWH/EV 28.2 151 4,261
Figure 15: Estimates: Lithium(g)/Car
13It is now possible to predict future lithium use by multiplying the amount of lithium per car type with the
predicted amount of cars sold, which is depicted in the following Graphs:
SC1: Total Lithium Required (t) for HEVs, PHEVs and EVs
SC1: Total Lithium
35'000.00 Required for Evs
30'000.00 (SC1LEVSE * Lithium/EV)
25'000.00
SC1: Total Lithium
Lithium (t)
20'000.00
Required for PHEVs
15'000.00 (SC1LPHEVSE *
10'000.00 Lithium/PHEV)
5'000.00 SC1: Total Lithium
Required for HEVs
0.00
(SC1LHEVSE *
Lithium/HEV)
Year
SC2: Total Lithium Required (t) for HEVs, PHEVs and EVs
SC2: Total Lithium
35'000.00 Required for Evs
30'000.00 (AEVSE * Lithium/EV)
25'000.00
SC2: Total Lithium
Lithium (t)
20'000.00
Required for PHEVs
15'000.00 (APHEVSE *
Lithium/PHEV)
10'000.00
5'000.00 SC2: Total Lithium
Required for HEVs
0.00 (AHEVSE *
Lithium/HEV)
Year
SC3: Total Lithium Required (t) for HEVs, PHEVs and EVs
SC3: Total Lithium
35'000.00
Required for Evs
30'000.00 (SC3HEVSE *
Lithium/EV)
25'000.00
Lithium (t)
20'000.00 SC3: Total Lithium
Required for PHEVs
15'000.00 (SC3HPHEVSE *
10'000.00 Lithium/PHEV)
5'000.00 SC3: Total Lithium
0.00 Required for HEVs
(SC3HHEVSE *
Year Lithium/HEV)
Figure 16: 3 Demand Scenarios: Total Lithium Required for Automotive Segment
14One can see that the total amount of lithium used for HEV batteries is growing much slower than the
amount of Lithium used for EVs. This is due to the increased battery power that pure EVs need
compared to HEVs.
After having analysed the total amount of lithium required to support the electric car revolution, one
can combine these numbers with the non-automotive lithium demand to finally calculate total lithium
demand:
SC1TLD: Total Lithium
Lithium Demand by Type Demand
SC2TLD: Total Lithium
80'000.00 Demand
60'000.00 SC3TLD: Total Lithium
Demand
Lithium (t)
40'000.00 Non-automotive Lithium
Battery consumption
(tons)
20'000.00 Total: Non Battery total
Lithium consuption (tons)
0.00 Non-automotive Lithium
2008 2010 2012 2014 2016 2018 2020 consumption
Year
Figure 17: Lithium Demand by Type
Finally, one can combine the predicted supply- and demand scenarios to 9 final scenarios.
Lithium Market Equilibrium (Supply-Demand) SP1, SC1
30'000
SP1, SC2
20'000 SP1, SC3
10'000 SP2, SC1
Lithium (t)
SP2, SC2
0
2006 2007 2008 2009 2010 2011 2012 2013 2014 2015 2016 2017 2018 2019 2020 SP2, SC3
-10'000 SP3, SC1
-20'000 SP3, SC2
SP3, SC3
-30'000
Figure 18: Supply-Demand for 9 Scenarios
It can be clearly seen that total demand will reach total supply with the
Pessimistic supply scenario (SP1) in 2013 (for low, medium and high demand)
Medium supply scenario (SP2) in 2018 (high- and medium demand) to 2019 (low demand)
Optimistic supply scenario (SP3) in 2020 (high demand) or later (low and medium demand)
If we look at the most probable supply scenario combined with the most probable demand scenario
(SP2, SC2), demand will equal supply in early 2018.
15Discussion
Predicting future market developments and technological progress is always fraught with large
uncertainties. It is therefore not surprising that the values found in literature are spread over a large
range.
Supply Scenarios
Future supply scenarios found in literature range from “no additional capacities added” to an almost
exponential growth. These extreme scenarios can be seen as boundaries that are very unlikely to
become true, therefore scenarios that use values somewhere in between are used in this report.
Also our knowledge about lithium resources on planet earth is far from complete. As the currently easily
accessible resources exceeded our needs in the past by far, there was no economical interest in
discovering lithium. Hence a large portion of total lithium resources, especially in the form of ore
deposits, is probably still undiscovered.
The kind of technology used to extract lithium from brines or ore is crucial since it determines the level
of concentration necessary for mining to be economic and therefore the efficiency of the mining
process. The total amount of lithium that can be sourced is also depending on technology as there are
large quantities of lithium available in small concentrations in many ores, brines and even the seawater.
Demand Scenarios
The range of predictions about the penetration of HEVs, PHEVs and EVs is very large as well. This is the
case because penetration scenarios are based on technical as well as social assumptions.
An example of a social factor would be the following question: Why are people actually buying an
electric car? Is it only because this way of transportation is more “environmentally friendly”? Well, this
depends on how the electricity is produced. If we switch as a consequence of the accident in Japan from
nuclear power plants back to gas burning power plants, the ecological footprint of an EV might not be
much better than the one of an “eco-friendly” car with a normal combustion engine.
A first example of a technical factor would be: How much lithium will be required per kWh in future
batteries? Batteries become more and more efficient and new cathode-anode combinations are being
commercialized every year.
A second example for an uncertainty would be the question how many kWh are packed into each HEV,
PHEV and EV. The range of built-in kWh for HEVs and PHEVs is rather small and there are already some
examples on the market (eg. Toyota Prius, GM VOLT). For EVs however, we only have a few samples
from the market (eg. Tesla Roadster, Smart EV). These vary greatly due to their different target
customers: Whereas the Tesla Roadster is a sports car that needs an extensive 56kWh power supply, the
Smart EV will be equipped with only 14kWh. In which direction future EV production will go is highly
speculative.
Supply and Demand are Inelastic
Every trained economist will probably ask the same question: How can you predict quantities supplied
and quantities demanded without looking at price? The answer is the following: In the short run, both
supply as well as demand are almost completely inelastic. Therefore price has only very little influence
on quantity supplied/demanded. On the supply side, this is due to the fact that the price almost tripled
during the last decade, so companies that are producing now were already profitable at 3 times lower
prices! Therefore they will still supply the market with the same quantity if prices fall. Also if prices
16increase, they can’t just increase production capacity quickly as this takes many years (as described
above). On the demand side, the inelasticity comes from the fact that the amount of electric vehicles
bought does not really depend on the battery price as lithium costs account only for a very small portion
of the final price of a car. Hence price fluctuation only have a limited influence on supply and demand.
Consequences of Scenarios: Supply Shortage vs. Oversupply
Extreme 1: Supply Shortage
An acute lithium shortage that will prevail during the next 5 years can be predicted if we combine the
“low supply”- with the “high demand” scenario. This situation is however very unlikely to happen
because many lithium sourcing claims have been filed in recent years and existing plants announced that
they plan to significantly increase nameplate capacity.
If we would however face a supply shortage, prices would increase drastically as both supply and
demand are inelastic. Other battery types would then become cheaper than lithium-ion batteries, and
car manufacturers would have to face new engineering challenges due to the inferior characteristics of
these battery types (as mentioned in the introduction). This would lead to a delay in market penetration
of electric vehicles, as customers would prefer to buy a cheaper fuel powered car.
Extreme 2: Massive Oversupply
A second extreme would be a large lithium oversupply that would prevail during the next decade if
lithium production expands aggressively but demand stays on a very low level. This scenario is also
unlikely to happen because (i) an oversupply will lead to falling prices which will make expansion
strategies unattractive, and (ii), because there are many indicators that point towards a strong increase
in demand. These are for example governmental regulations that tax extensive gasoline use, the social
trend towards “eco-friendliness”, etc. If the oversupply would be as massive as outline by the
combination of the lowest demand- and the highest supply scenario, prices would fall so low that many
producers would have to shut down operations.
Base Scenario: Oversupply
Reality will hence lie somewhere in between the two extremes. The most likely scenario will be the
combination of average predicted supply and average predicted demand. Quantity supplied will reach
the quantity demanded in 7 to 8 years and then a supply shortage will occur if no additional capacities
will be added. This period of oversupply will lead to higher price fluctuations and over the years to
falling prices. As mentioned above, producers will still be able to operate profitable at lower prices if
they do not fall below the pre-boom level. Cheaper lithium prices will accelerate the market penetration
of electric vehicles and hence increase demand in the long-run.
17Conclusion
Lithium became the element of choice as an anode in batteries due to its physical/chemical properties.
Our society relies more and more on stored energy, be it for laptops, cell phones, drilling tools or cars.
The latter are expected to have a large impact on lithium demand because electrically powered
automobiles need battery conglomerates with comparably large storage capacities.
Different expert estimates about all the factors that influence future lithium supply and demand were
combined to build up 9 scenarios to predict the lithium market for the next decade (up to 2020). The
most likely scenario predicts a lithium oversupply (supply will triple during this decade) for the next 7 to
8 years, which will lead to falling prices. Hence, claims of impending lithium shortages are overdrawn.
These results can be useful for
The battery- and car manufacturing industry, as this reports allows predicting future lithium
price developments and therefore battery prices.
Governmental decision makers, as they show that no actions (like subsidies) have to be taken to
ensure that lithium prices will fall again.
Although we are not facing any supply shortages at the moment, this will probably happen at one point
in the future. “Peak lithium” will come, hence future research projects should focus on developing new
methods of energy storage that are not based on a limited resource like lithium. In terms of economic
research one could try to better predict future demand of lithium. This would probably decrease price
fluctuations, hence producers could better plan when it makes sense to increase production capacities.
18References
1
USGS (2010) Lithium. http://minerals.usgs.gov/minerals/pubs/commodity/lithium/mcs-2010-lithi.pdf. Retrieved
2011-04-07.
2
Astle et all (2009), “Lithium - Hype or Substance? A look at Lithium Demand and Supply”, Investment Research
Lithium, Dundee Securities Corporation
3
http://en.wikipedia.org/wiki/Lithium-ion_battery (18 April 2011)
4
Global X Funds (2010) Lithium ETF
5
Tarascon & Armand (2001), „Issues and challenges facing rechargeable lithium batteries”, Nature 414, 359-367
6
Shiau et all. (2009), „Impact of battery weight and charging patterns on the economic and environmental benefits
of plug-in hybrid vehicles”, Energy Policy, Volume 37, 2653-2663
7
Western Lithium WLC (2010), “The Role of Lithium”, MMSA Symposium
8
http://www.kitco.com/ind/Mills/apr02009.html
9
Abel and Oppenheimer (2008), “World Lithium Resource Impact on Electric Vehicles“
10
McNulty and Khaykin (2009), „Lithium“, Credit Suisse Equity Research
11
Chu and Braatz (2002), “Comparison of commercial supercapacitors and high-power lithium-ion batteries for
power-assist applications in hybrid electric vehicles: I. Initial characterization”, Journal of Power Sources, Volume
112, 236-246
12
Kennedy and Camilleri (2000), “Use of lithium-ion batteries in electric vehicles”, Journal of Power Sources,
Volume 90, 156-162
13
Jaskula (2009), „Lithium“, U.S. Geological Survey, Mineral Commodity Summaries
14
Jaskula (2010), „Lithium“, U.S. Geological Survey, Mineral Commodity Summaries
15
Anderson (2011), “Shocking Future Battering the Lithium Industry through 2020“, TRU Group LSM11
Presentation
16
Brown (2010), “Lithium Price Increases Underscore Inflationary Pressures”:
http://lithiuminvestingnews.com/1941/lithium-price-increases-underscore-inflationary-pressures/ (18 April 2011)
17
http://www.commercialpressuresonland.org/sites/default/files/images/bolivias_lithium_reserves_3.jpg (18
April 2011)
18
http://en.wikipedia.org/wiki/Spodumene (18 April 2011)
19
Tahil (2007), „The Trouble with Lithium“, Meridian International Research
20
Evans (2008), „An Abundance of Lithium“: http://www.che.ncsu.edu/ILEET/phevs/lithium-
availability/An_Abundance_of_Lithium.pdf (18 April 2011)
21
Jaskula (2011), „Lithium“, U.S. Geological Survey, Mineral Commodity Summaries
22
Chemetall Statement (2009), “Lithium Applications and Availability”
19Appendix
Appendix 1: Definitions USGS (2008)
Resource—A concentration of naturally occurring solid, liquid, or gaseous material in or on the
Earth’s crust in such form and amount that economic extraction of a commodity from the
concentration is currently or potentially feasible.
Reserve Base—That part of an identified resource that meets specified minimum physical and
chemical criteria related to current mining and production practices, including those for grade,
quality, thickness, and depth. The reserve base is the in situ demonstrated (measured plus indicated)
resource from which reserves are estimated. It may encompass those parts of the resources that
have a reasonable potential for becoming economically available within planning horizons beyond
those that assume proven technology and current economics. The reserve base includes those
resources that are currently economic (reserves), marginally economic (marginal reserves), and
some of those that are currently sub-economic (sub-economic resources). The term “geologic reserve”
has been applied by others generally to the reserve-base category, but it also may include the
inferred-reserve-base category; it is not a part of this classification system.
Reserves—That part of the reserve base which could be economically extracted or produced at the
time of determination. The term reserves need not signify that extraction facilities are in place and
operative. Reserves include only recoverable materials; thus, terms such as “extractable reserves”
and “recoverable reserves” are redundant and are not a part of this classification system.
http://minerals.usgs.gov/minerals/pubs/mcs/2008/mcsapp2008.pdf
20Appendix 2: Data and assumptions
2122
Scenario Assumptions:
Supply Scenarios:
Supply pessimistic scenario = Average of estimates from Tahil(19) and McNulty and Khaykin(10)
Supply average scenario = Average of estimates from USGS, Tahil(19), McNulty and Khaykin(10),
Anderson(15), and Astle et al(2).
Supply positive scenario = Average of estimates from Anderson(15), and Astle et al(2).
Demand Scenarios (based on electric vehicle penetration scenarios):
Low penetration scenario = Astle et al(2) medium penetration scenario
Medium penetration scenario = Average of estimates from McNulty and Khaykin(10),
Anderson(15), and all scenarios from Astle et al(2)
High penetration scenario = Astle et al(2) high penetration scenario
23You can also read