Otter Creek Advisors, LLC - July 18, 2018 | 2nd Quarter Conference Call Slide Deck - Otter Creek Funds

Page created by Lauren Larson
 
CONTINUE READING
Otter Creek Advisors, LLC - July 18, 2018 | 2nd Quarter Conference Call Slide Deck - Otter Creek Funds
Otter Creek Advisors, LLC
July 18, 2018 | 2nd Quarter Conference Call Slide Deck
Otter Creek Advisors, LLC - July 18, 2018 | 2nd Quarter Conference Call Slide Deck - Otter Creek Funds
Table of Contents

   Overview

   Executive Summary

   Attribution

   Investment Process

   Framing the Macro and Market Environment

   Current Themes

   Portfolio Composition

                                               1
Otter Creek Advisors, LLC - July 18, 2018 | 2nd Quarter Conference Call Slide Deck - Otter Creek Funds
Firm Overview

•   Otter Creek Advisors
     •   Fundamentally focused investors
     •   Value orientated
     •   100% employee owned

•   Launched the Otter Creek Long/Short Opportunity Fund December 30, 2013
     •   Fund assets are $165.3 million as of June 30th, 2018
     •   Total Firm assets are $230.1 million as of June 30th, 2018

                                   Past performance does not guarantee future results   2
Otter Creek Advisors, LLC - July 18, 2018 | 2nd Quarter Conference Call Slide Deck - Otter Creek Funds
Executive Summary

STRATEGY
                 Generate absolute risk-adjusted returns with a focus on long-term capital appreciation with below
                  average volatility by investing in opportunities both long and short which are driven by intensive
                  fundamental analysis

                 Attempt to achieve capital preservation during periods of dislocation
       Performance Returns                                                           As of June 30, 2018       Portfolio Statistics                                         As of June 30, 2018

                                                       Since                                     Since
                                                                 1           2            2                3
                                       Inception                     1 Year       3 Year Inception                                                                        OTTRX    S&P 500
        Institutional Class (OTTRX)      14.38%                      ‐0.95%        1.35%    3.04%              Weekly Standard Deviation                                   6.1%     12.0%
        Investor Class (OTCRX)           13.18%                      ‐1.22%        1.09%    2.80%
        S&P 500 Index                    61.98%                      14.41%       11.94%   11.34%
        Morningstar L/S Equity Category 12.99%                        5.48%        2.90%    2.76%

                                 4
       Total Expense Ratio                                                                                     Weekly Correlation (since inception)                         As of June 30, 2018
                                                                                                                                                                                        2
                                                                 Gross                         Net                                                                          r           r
        Institutional Class (OTTRX)                              2.34%                        2.31%                OTTRX vs. S&P 500 Index                                ‐0.05       0.00
        Investor Class (OTCRX)                                   2.60%                        2.57%

   4                                                                                                           1
       The Fund's i nves tment a dvi s or ha s contra ctua l l y a greed to reduce i ts fees a nd/or               Cumul a ti ve return s i nce Fund i ncepti on da te of December 30, 2013
       a bs orb expens es of the fund unti l a t l ea s t Februa ry 28, 2019. The expens e ra ti os a re       2
                                                                                                                   Annua l i zed return for one yea r a nd three yea rs
       ba s ed on es ti ma ted a mounts a nd ma y not refl ect the a ctua l expens e ra ti os .                3
                                                                                                                   Annua l i zed return s i nce Fund i ncepti on da te of December 30, 2013

Performance data quoted is past performance. Past performance does not guarantee future results. The investment and principal value of an
investment will fluctuate so that an investor's shares, when redeemed, may be worth more or less than their original cost. The current performance
may be lower or higher than the performance data quoted. Performance data current to the most recent month‐end may be obtained by calling
(855) 681‐5261. Performance data quoted does not reflect the 1% redemption fee on shares held for 60 days or less. If reflected, total returns
would be reduced.
                                                                                                                                                                                                  3
Otter Creek Advisors, LLC - July 18, 2018 | 2nd Quarter Conference Call Slide Deck - Otter Creek Funds
Attribution: Long and Short

              Otter Creek Advisors focuses on generating absolute returns in both our long and short portfolio for the Fund
                                                                                            1                                                                                                   2
                                                                                     2018                                                                                               2017
                                                4.0%                                                                                                25%
                                                                 3.1%                                                                                               19.3%
                                                3.0%                                                                                                20%

                                                2.0%                                                                                                15%

                                                1.0%                                                                                                10%

                                                0.0%                                                                                                 5%

                                               -1.0%                                                                                                 0%
                                                                                                      -0.6%
                                               -2.0%                                                                                                 -5%                                              -1.6%
                                                                                                                        -1.6%                                                                                          -3.6%
                                               -3.0%                                                                                                -10%

                                               -4.0%                                                                                                -15%
                                                                                  -4.1%
                                               -5.0%                                                                                                -20%                            -17.9%
                                                                           Long     Short   Cash          Net                                                                Long     Short         Cash      Net

                                                3                                                                                              4                                                                                         5
                                         2016                                                                                           2015                                                                                      2014
15%                                                                                             12%                                                                                           14.0%
                  11.7%                                                                                                                                               9.5%                                     12.5%
                                                                                                10%                                                                                           12.0%
                                                                                                                                                                                                                                                      9.8%
10%                                                                                                                                                                                           10.0%
                                                                                                    8%
                                                                                                                 5.5%              5.8%                                                       8.0%
                                                                                                    6%
 5%
                                                                                                                                                                                              6.0%
                                                                                                    4%
                                                                        0.1%                                                                                                                  4.0%
 0%
                                                                                                    2%
                                                                                                                                                                                              2.0%
                                                       -1.8%                                        0%
-5%                                                                                                                                                                                           0.0%

                                                                                                    -2%                                                                                       -2.0%
                                                                                                                                                                                                                               -0.7%
                                                                                                                                                     -1.9%                                                                                   -1.7%
-10%                                -8.7%                                                           -4%                                                                                       -4.0%

                            Long       Short        Cash       Net                                                         Long      Short         Cash      Net                                                        Long     Short   Cash   Net

       1                                                                                        4
           For the period from January 1, 2018 through June 30, 2018                                For the period from January 1, 2015 through December 31, 2015
       2                                                                                        5
           For the period from January 1, 2017 through December 31, 2017                            For the period from January 1, 2014 through December 31, 2014
       3
           For the period from January 1, 2016 through December 31, 2016                            Source: Company Reports

                                                                                                    Past performance does not guarantee future results                                                                                                 4
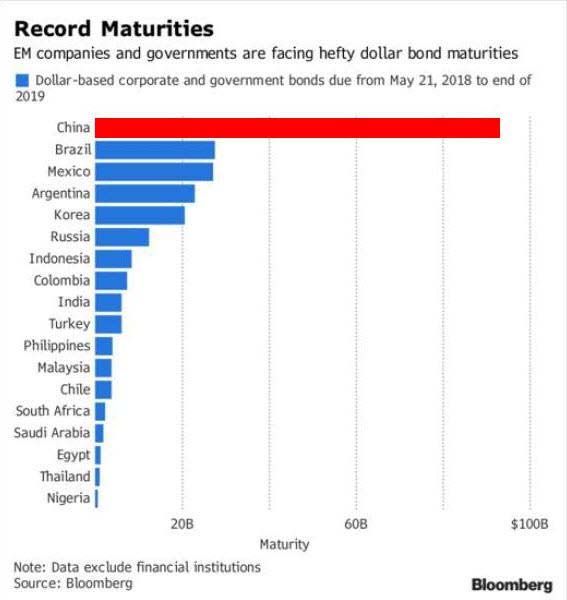
Otter Creek Advisors, LLC - July 18, 2018 | 2nd Quarter Conference Call Slide Deck - Otter Creek Funds
Fund Attribution
2018 2nd Quarter

                   Quarter‐to‐Date Sector Attribution
                                              Long Short                  Net
                   Consumer Discretionary     ‐0.2% ‐3.1%                 ‐3.4%
                   Information Technology     ‐0.1% 1.1%                   1.1%
                   Materials                   0.9% 0.0%                   0.9%
                   Industrials                 0.3% 0.6%                   0.8%
                   Financials                  1.1% ‐0.4%                  0.6%
                   Utilities                   0.5% 0.0%                   0.5%
                   Energy                      0.4% 0.0%                   0.4%
                   Real Estate                ‐0.1% ‐0.1%                 ‐0.1%
                   Consumer Staples            0.2% ‐0.3%                 ‐0.1%
                   Health Care                 0.2% ‐0.2%                  0.0%
                   Other                       0.0% 0.0%                   0.0%
                   Gross Return                3.2% ‐2.5%                  0.6%
                                                  Net Expenses            ‐0.2%
                                                  Net Return               0.4%

                            Past performance does not guarantee future results    5
Otter Creek Advisors, LLC - July 18, 2018 | 2nd Quarter Conference Call Slide Deck - Otter Creek Funds
Fund Contributors and Detractors
2018 2nd Quarter

                                                            Security                                                                                                    Security
                                                             Return             Portfolio                                                                                Return      Portfolio
Top 5 Contributors                   Long/Short               (Q2)            Contribution              Top 5 Detractors                                  Long/Short      (Q2)     Contribution

Symantec Corp                             Short              ‐19.8%                 1.6%              Canada Goose Holdings Inc                                Short     76.1%        ‐1.0%
Seacoast Banking Corp of Florida          Long                19.3%                 0.8%              Financial Engines Inc                                    Short     28.5%        ‐0.9%
The Middleby Corp                         Short              ‐15.6%                 0.8%              Tesla Motors Inc                                         Short     28.9%        ‐0.6%
Teradyne Inc                              Short              ‐16.5%                 0.7%              Netflix Inc                                              Short     32.5%        ‐0.6%
Ashland Inc                               Long                12.4%                 0.6%              Ollies Bargain Outlet Holdings Inc                       Short     20.2%        ‐0.6%

               Notable Changes
                      Covered our entire position in Symantec Corp and sold our puts
                      Covered our entire position in Middleby Corp and sold our puts
                      Covered our entire position in Teradyne Inc. and sold our puts
                      Covered our entire position in Canada Goose Holdings Inc.
                      Covered our entire position in Financial Engines Inc.
                      Covered our short equity position in Netflix Inc. and replaced with put exposure

                                                               Past performance does not guarantee future results
                          Fund holdings and allocations are subject to change at any time and should not be considered a recommendation to buy or sell any securities                     6
Otter Creek Advisors, LLC - July 18, 2018 | 2nd Quarter Conference Call Slide Deck - Otter Creek Funds
The Otter Creek Investment Process
Fundamentally Driven

                                                                                                                         INVESTMENT PROCESS
                              INVESTABLE UNIVERSE
                   Wilshire 5000 & American Depositary Receipts                                                Narrow investment universe by:
                       Any listed security in capital structure                                                    • Develop a macroeconomic thesis
                   Most attractive risk/reward in capital structure                                                • Frame bond and equity market valuations
                                                                                                                   • Identify thematic ideas
                                                                                                                   • Identify secular trends

              CONCENTRATED PORTFOLIO                                                                                                         IDEA GENERATION
           Typically 30‐35 longs and 30‐35 shorts                                                                                            Industry conferences
     Equity put exposure ranges from 1% ‐ 5% of capital                                                                                        Financial screens
                                                                                                                                                 Network base

                                                                          COMPANY CHARACTERISTICS
                                                          LONG                            SHORT
                                                          •   Operating margins > 10%              •   Aggressive accounting
                                                          •   Return on Equity > 15%               •   Deteriorating balance sheet metrics
                                                          •   #1 or #2 market share position       •   Low quality earnings
                                                          •   Low‐to‐moderate financial leverage   •   High financial leverage
                                                          •   Consistent and growing dividends     •   High level of insider selling

                                                                                                                                                                    7
Otter Creek Advisors, LLC - July 18, 2018 | 2nd Quarter Conference Call Slide Deck - Otter Creek Funds
2Q Review: Tech sector outperformance, significant
short squeeze, weakness in international markets
                                                                             Euphoria?

              Historic inflows into the tech sector in 2018
              Growth stocks within the S&P 500 have outperformed the
              value stocks by 11 percentage points this year
              Worst YTD performance for the value style factor in over a
              decade

  Source: As of 06/31/2018                                                               Source: BoAML, EPFR Global

  160                                                                                                                                                   Global Market Returns
  155                                                                                    115.00
                                                                                                                                                             (Index 100)
              Massive Short Squeeze: Most
  150         shorted stocks index up 22%
                                                                                         110.00
  145                since mid-May
  140                                                                                    105.00

  135                                                                                    100.00
  130
                                                                                          95.00
  125
  120                                                                                     90.00
                                                                                                  Jan‐18
                                                                                                           Jan‐18
                                                                                                                    Jan‐18
                                                                                                                             Jan‐18
                                                                                                                                      Feb‐18
                                                                                                                                               Feb‐18
                                                                                                                                                        Mar‐18
                                                                                                                                                                 Mar‐18
                                                                                                                                                                          Mar‐18

                                                                                                                                                                                                              May‐18
                                                                                                                                                                                                                       May‐18
                                                                                                                                                                                                                                May‐18
                                                                                                                                                                                                                                         May‐18
                                                                                                                                                                                                                                                  Jun‐18
                                                                                                                                                                                                                                                           Jun‐18
                                                                                                                                                                                                                                                                    Jun‐18
                                                                                                                                                                                                                                                                             Jul‐18
                                                                                                                                                                                   Apr‐18
                                                                                                                                                                                            Apr‐18
                                                                                                                                                                                                     Apr‐18
  115
     Apr‐18                          May‐18                             Jun‐18

                               Goldman Discretionary Most Short Index                                               S&P 500                                 Nasdaq Composite                                           Global Composite*

 Source: Bloomberg as of 06/21/2018                                                      Source: Bloomberg, Composite: Japan, HK, Shanghai, Germany, London
                                                                                                                                                                                                                                                                        8
Otter Creek Advisors, LLC - July 18, 2018 | 2nd Quarter Conference Call Slide Deck - Otter Creek Funds
Global Macro: U.S. growth strong, potential for
growing stress in EM and Europe
57                     Manufacturing and services growth strong, potential                                                                                              58
                       likelihood 1H was peak manufacturing growth                                                                                                      57
56
                                                                                                                                                                        56
55                                                                                                                                                                      55
54                                                                                                                                                                      54
                                                                                                                                                                        53
53                                                                                                                                                                      52     Eurozone macro data points, especially
52                                                                                                                                                                      51       manufacturing, continue to weaken
                                                                                                                                                                        50
51
                                                                                                                                                                        49
50                                                                                                                                                                      48
     Jul‐15
              Sep‐15
                       Nov‐15

                                                            Jul‐16
                                                                     Sep‐16
                                                                              Nov‐16

                                                                                                                  Jul‐17
                                                                                                                           Sep‐17
                                                                                                                                    Nov‐17
                                Jan‐16
                                         Mar‐16
                                                  May‐16

                                                                                       Jan‐17
                                                                                                Mar‐17
                                                                                                         May‐17

                                                                                                                                             Jan‐18
                                                                                                                                                      Mar‐18
                                                                                                                                                               May‐18
                                                           US Mfg PMI                              US Non Mfg PMI

Source: Bloomberg 6/30/18                                                                                                                                                    Source: Yaredeni Research, Haver

                                                                                                                                                                                       Economic growth forecasts
                                                                                                                                                                                       diverging after a year of
                                                                                                                                                                                       synchronized and accelerating
                                                                                                                                                                                       growth

Source: Nordea Markets, Macrobond                                                                                                                                            Source: Morgan Stanley Research
                                                                                                                                                                                                                        9
US Consumer: Spending strong, but largely
driven by increase in credit and lower savings
rate supporting spending
 8                                                                                                                                                                                12    Surge in credit borrowing supporting retail sales… higher inflation
 7                                                                                                                                                                                      eating into personal income growth despite rising wages
                                                                                                                                                                                  10
 6
 5                                                                                                                                                                                 8
 4
                                                                                                                                                                                   6
 3
 2                                                                                                                                                                                 4
 1
                                                                                                                                                                                   2
 0
 ‐1                                                                                                                                                                                0
               Jul‐15
                        Sep‐15
                                 Nov‐15

                                                   Mar‐16

                                                                     Jul‐16
                                                                              Sep‐16
                                                                                       Nov‐16

                                                                                                         Mar‐17

                                                                                                                           Jul‐17
                                                                                                                                    Sep‐17
                                                                                                                                             Nov‐17

                                                                                                                                                               Mar‐18
      May‐15

                                          Jan‐16

                                                            May‐16

                                                                                                Jan‐17

                                                                                                                  May‐17

                                                                                                                                                      Jan‐18

                                                                                                                                                                        May‐18
                                                                                                                                                                                                     Real Personal Income Growth                                          Monthly % Change in Consumer Credit
                                                                     Core Retail Sales % Change

Source: Bloomberg 6/30/18                                                                                                                                                        Source: Bloomberg 6/30/18

                                                                                                                                                                                  4.2                                            Headwinds to Future Spending                                                                           16
                                                                                                                                                                                                                                                                                                                                        15.5
                                                                                                                                                                                  3.7
                                                                                                                                                                                                                                                                                                                                        15
                                                                                                                                                                                  3.2                                                                                                                                                   14.5
                                                                                                                                                                                                                                                                                                                                        14
                                                                                                                                                                                  2.7                                                                                                                                                   13.5
                                                                                                                                                                                                                                                                                                                                        13
                                                                                                                                                                                  2.2
                                                                                                                                                                                                                                                                                                                                        12.5
                                                                                                                                                                                  1.7                                                                                                                                                   12
                                                                                                                                                                                        Jun‐13
                                                                                                                                                                                                 Oct‐13
                                                                                                                                                                                                          Feb‐14
                                                                                                                                                                                                                   Jun‐14
                                                                                                                                                                                                                            Oct‐14
                                                                                                                                                                                                                                     Feb‐15
                                                                                                                                                                                                                                              Jun‐15
                                                                                                                                                                                                                                                       Oct‐15
                                                                                                                                                                                                                                                                Feb‐16
                                                                                                                                                                                                                                                                         Jun‐16
                                                                                                                                                                                                                                                                                  Oct‐16
                                                                                                                                                                                                                                                                                           Feb‐17
                                                                                                                                                                                                                                                                                                    Jun‐17
                                                                                                                                                                                                                                                                                                             Oct‐17
                                                                                                                                                                                                                                                                                                                      Feb‐18
                                                                                                                                                                                                                                                                                                                               Jun‐18
                                                                                                                                                                                                 US Average Gasoline Price                                      Average Consumer Credit Card APR (RHS)

 Source: Nordea Markets, Macrobond                                                                                                                                                Source: Bloomberg 6/30/18
                                                                                                                                                                                                                                                                                                                                    10
Market Fundamentals

 Robust earnings growth driven by favorable
  macro environment in 2Q and low taxes.

Sales growth and margin expansion (input cost
pressure) potentially slows later in the year and
                      2019

       Foreign exchange tailwinds turning to
           headwinds for multi-nationals
                                                                                     Source: Strategas as of 07/12/2018

                               S&P 500 Sales Growth
 12%
              Sales growth strong, but fades into year end
 10%

 8%

 6%

 4%

 2%

 0%
        Q2      Q3     Q4     Q1     Q2     Q3     Q4     Q1     Q2     Q3     Q4
       2016    2016   2016   2017   2017   2017   2017   2018   2018   2018   2018
                                                                        Est    Est

Source: Bloomberg 7/11/18                                                            Source: Bloomberg, Stifel
                                                                                                                          11
Market Observations: QT Unintended
consequences: Where we see risk

                                            Change in financial conditions
                                            since January

 Source: Citigroup Research

                 Record debt levels could
                 become issue in rising
                 rate environment

Source: Gluskin Sheff

                                                                             12
Market Observations: QT Unintended
consequences: Where we see risk

                                     First signs of credit
                                     spreads widening

                                                                                 Signs market bracing for
                                                                                 slower global growth

Source: Morgan Stanley

             Financial stocks- typically
             leading indicators- diverging
             from rest of the market

 Source: BBG, Nedbank CIB                                    Source: Strategas
                                                                                                            13
Relatively Low Gross and Net Fund Exposure

        •                     We look for attractive absolute return opportunities

        •                     We maintain a high cash balance for when absolute return opportunities increase

Historical Delta-adjusted Gross Exposure                                                                                                                            As of June 30, 2018                           Historical Delta-adjusted Exposure                                                                                                                                  As of June 30, 2018

                                                                                                                                                                                                                                                               Long Delta                                         Short Delta                                         Net Delta
                                                                                                                                                                                                                  100%
 180%
                                                                                                                                                                                                                                                                                                                                                                                                                        84.0%

                                                                                                                                                                                                                   80%

 160%
                                                                                                                                                                                                                   60%

                                                                                                                                                                                                                   40%
 140%

                                                                                                                                                                                                                   20%

 120%                                                                                                                                                                                                               0%

                                                                                                                                                                                                                  -20%

 100%
                                                                                                                                                                                                                  -40%

                                                                                                                                                                                                                  -60%
  80%

                                                                                                                                                                                                                  -80%
                                                                                                                                                                                                                                                                                                                                                                                                                        -81.0%

  60%                                                                                                                                                                                                             -100%
        01/31/14

                   04/30/14

                               07/31/14

                                          10/31/14

                                                     01/31/15

                                                                04/30/15

                                                                           07/31/15

                                                                                       10/31/15

                                                                                                  01/31/16

                                                                                                             04/30/16

                                                                                                                        07/31/16

                                                                                                                                   10/31/16

                                                                                                                                              03/31/17

                                                                                                                                                         06/30/17

                                                                                                                                                                      09/30/17

                                                                                                                                                                                 12/31/17

                                                                                                                                                                                            03/31/18

                                                                                                                                                                                                       06/30/18

                                                                                                                                                                                                                          01/31/14

                                                                                                                                                                                                                                     04/30/14

                                                                                                                                                                                                                                                07/31/14

                                                                                                                                                                                                                                                           10/31/14

                                                                                                                                                                                                                                                                      01/31/15

                                                                                                                                                                                                                                                                                 04/30/15

                                                                                                                                                                                                                                                                                            07/31/15

                                                                                                                                                                                                                                                                                                       10/31/15

                                                                                                                                                                                                                                                                                                                    01/31/16

                                                                                                                                                                                                                                                                                                                               04/30/16

                                                                                                                                                                                                                                                                                                                                          07/31/16

                                                                                                                                                                                                                                                                                                                                                     10/31/16

                                                                                                                                                                                                                                                                                                                                                                03/31/17

                                                                                                                                                                                                                                                                                                                                                                           06/30/17

                                                                                                                                                                                                                                                                                                                                                                                       09/30/17

                                                                                                                                                                                                                                                                                                                                                                                                  12/31/17

                                                                                                                                                                                                                                                                                                                                                                                                             03/31/18

                                                                                                                                                                                                                                                                                                                                                                                                                         06/30/18
Gross delta‐adjusted exposure                                                         165.0%                                                                                                                      Net delta‐adjusted exposure                                                                     3.0%
Source: Company Reports                                                                                                                                                                                           Source: Company Reports

                                                                                                                                                                                                                                                                                                                                                                                                                   14
Investment Themes

                                                                        LONG INVESTMENT THEMES
           THEME                                                  RATIONALE                                                                         COMPANY
 America First                Companies that are beneficiaries from the current administration's agenda                Leidos (LDOS), FLIR Systems (FLIR), Kirby Corp (KEX)
 Financial Deregulation       Benefits from deregulation should provide a multi-year tailwind to earnings and          Seacoast Bank Corp. (SBCF), Ameris Bancorp (ABCB)
                              drive higher capital returns to shareholders via higher share repurchases and            CenterState Bank Corp. (CSFL)
                              dividends
 Hard Asset                   Companies that should benefit from higher inflation and commodity prices                 PotlatchDeltic (PCH) , Occidental Petroleum (OXY),
                                                                                                                       Newmont Mining (NEM), Archer-Daniels-Midland (ADM), Nutrien (NTR)

 Demographic Changes:         Millennials spending habits are changing, new demands for healthier foods and            Calavo Growers (CVGW), Thermo Fisher (TMO)
 Millennials & Baby Boomers   using e-commerce                                                                         Abbott Laboratories (ABT), Zimmer Biomet (ZBH)
                              Aging population will drive long term secular demand for healthcare

 Special Situations           Visibility on tax rates, tax repatriation, improved business confidence will result in   KLX (KLXI), E*TRADE (ETFC), Ashland (ASH), CDK Global (CDK),
                              higher M&A                                                                               DowDupont (DWDP)
                              Companies going through value-enhancing break-ups

                                                                       SHORT INVESTMENT THEMES
           THEME                                                  RATIONALE                                                                         COMPANY
 Interest Rate Risks          Companies that could be negatively impacted from rising interest rates, in addition Snap-on (SNA), Polaris Ind. (PII), Elli Mae (ELLI)
                              face increased competition, rising input costs
 Competitive Risk in Retail   Companies with low barrier to entry, exhibit no pricing power, benefited from            Ollie's Bargain Outlet (OLLI), Urban Outfitters (URBN),
                              temporary fundamental tailwinds, trading at elevated valuations                          American Eagle (AEO), Ralph Lauren Corp. (RL)
 Peak Semis                   Peak stock prices don't reflect the potential profit slowdown over the next 6-12         Skyworks (SWKS), Broadcom (AVGO), Intel Corp (INTC)
                              months
 Profitless Growth            Companies growing sales, but losing incrementally more money, facing increased Tesla (TSLA), Shopify (SHOP), Wayfair Inc. (W)
                              competition

                                                                                                                                                                                 Red = new
                                                                                                                                                                                 position or
                                                                                                                                                                                   theme
As of 06/30/2018

                                                                                                                                                                                     15
Notable Portfolio Position Changes

                  Long Portfolio                             Short Portfolio

 •   Reduced (sold) cyclical and financial   •   Covered profitable shorts in:
     exposure:                                    • Symantec Corp (SYMC)
       • United Technologies (UTX)                • The Middleby Corp (MIDD)
       • Nucor Corp (NUE)                         • Thor Industries (THO)
       • Rio Tinto (RIO)                          • Skechers USA Inc (SKX)
       • Goldman Sachs Corp (GS)                  • Sprouts Farmers Market (SFM)
       • Bank of America (BAC)                    • Teradyne (TER)
                                                  • LCI Industries (LCII)
 •   Continue to add to hard assets:
      • Archer-Daniels-Midland (ADM)         •   Added or Increased names in the restaurant
      • Nutrien (NTR)                            & apparel space:
                                                   • BJ’s Restaurant Inc (BJRI)
 •   Added to Consumer Staples exposure:           • Dine Brands (DIN)
       • Mondelez International (MDLZ)             • Urban Outfitters Inc (URBN)

                                             •   Covered unprofitable shorts and swapped
                                                 into puts
                                                    • Shopify (SHOP)
                                                    • Planet Fitness (PLNT)
                                                    • Canada Goose Holdings (GOOS)
                                                    • Wayfair Inc (W)
                                                                                              16
Otter Creek Long/Short Opportunity Fund
Investment Themes As a Percent of Invested Capital

  Source: Company Reports
  As of 07/13/2018

                                                     17
Long Book Review

  Long portfolio has generated approximately 100bps of excess return relative to market in 2018 despite
                            limited exposure to large-cap technology stocks

                                                                   OTTRX Long Performance VS. S&P 500 Since Inception
                                                   65%

                                                   55%

                                                   45%

                                                   35%

                                                   25%

                                                   15%

                                                    5%

                                                    ‐5%
                                                       Jan‐14   Jul‐14   Jan‐15   Jul‐15   Jan‐16   Jul‐16   Jan‐17   Jul‐17   Jan‐18

                                                                                           SPX       OTTRX

                                                                                                                                        18
Long Book: We Still See Upside in YTD Laggards

  Aramark (ARMK) (-9% YTD)                                                  CDK Global (CDK) (-5% YTD)
  • Provider of food and facilities management in the U.S.                 • Provider of information technology (software) and digital marketing
  • Long-term growth opportunities (1) public companies < 10% of             solutions for the automotive retail industry.
    industry (2) less than 50% of market is outsourced                     • Spun-off from ADP in 2016
  • Medium-term management opportunity – margins are 100bps below          • Leading market share (40%), operates in a consolidated industry
    closest peer                                                           • Primarily U.S. focused business
  Why the opportunity now?                                                 Why the opportunity now?
         • Sales growth acceleration from new business wins                        • Transformation plan expected to improve margins and close
         • Continued execution on margin expansion                                   margin cap to closest peer (private, Reynolds & Reynolds)
         • Potential spin-off of uniform business                                  • Potential for activists (Elliot Management) to force a sale of
  • Valuation – ARMK trades at 10x EBITDA relative to leading                        the company
    competitor, Compass, at 14x EBITDA.                                    • Valuation – CDK trades for 18x earnings relative to software peers >
                                                                             20x.

  Leidos (LDOS ) (-3% YTD)                                                 Zimmer Biomet (ZBH) (-5% YTD)
  • Government IT services company                                         • Leading orthopedic device manufacturer
  • Beneficiary from favorable government spending environment going       • Attractive profitability – 70% gross margins, 34% EBITDA margins
     forward                                                               • Temporary supply issues have reduced sales growth near-term
  • Margin expansion opportunity via recent acquisitions (merged with      Why the opportunity now?
     Lockheed's IT business)                                                      • New and highly regarded CEO should be a positive “change
  Why the opportunity now?                                                            agent”
          • Potential for significant sales growth acceleration in 2H18           • Supply issues abate 2H18 and 2019 should provide an
             driven by new business wins                                              opportunity for sales growth to return to market growth rates
          • Opportunity to accelerate capital return via faster dividend   • Valuation – ZBH trades 14x earnings relative to peers 18x-22x
             growth
  • Valuation – LDOS trades 14x earnings relative to peers 18x-19x

*YTD Prices as of 7/13/18
                                                                                                                                               19
Short Name: Dine Brands Global Inc. (DIN)

Company Discretion:                                                                                    Dine Brands Global (DIN)
     •    Owner of Applebee's & IHOP Brands                           90

Investment Thesis:                                                    80
       •    Operates in secularly challenged casual dining industry              2nd largest Franchisee Files for Bankruptcy
       •    Shift to fast casual and delivery                         70
       •    Over-capacity of units in casual dining
                                                                      60
       •    Franchisee profitability falling – declining EBITDA and
            stagnant free cash flow                                                                                               IHOP Temporarily Changes
                                                                      50                                                          Name to IHOB for Burger
       •    Deteriorating Balance Sheet – leverage 7x                                                                             Roll Out
                                                                      40
Other notable shorts: BJ’s Restaurants (BJRI)
       •   Faces long-term competitive challenges                     30
       •   Margins are at risk due to labor pressure                    Jul‐17 Aug‐17 Sep‐17 Oct‐17 Nov‐ Dec‐17 Jan‐18 Feb‐18 Mar‐ Apr‐18 May‐ Jun‐18 Jul‐1
       •   High levels of insider selling                                                            17                        18          18
                                                                      Source: Bloomberg as of 07/13/2018

                             Dine Brands Global (DIN)                                         Dine Brands Global Net Debt/EBITDA

  75                                                                   7x

  70                                                                   7x
  65
                                                                       6x
  60
  55                                                                   6x
  50
                                                                       5x
  45
  40                                                                   5x

                                                                       4x

                                     ADJ EBITDA (LHS)

Source: Bloomberg as of 07/03/2018                                     Source: Bloomberg as of 07/03/2018

                                                                                                                                                     20
Short Name: Adtalem Global Education (ATGE)

 Company Description:
      •   Adtalem Global Education (formally DeVry Education
          Group Inc.), through its subsidiaries, is a for-profit
          provider of higher education programs and Services.
      •   Offers bachelor’s, and master’s degrees primarily in
          nursing.

 Investment Thesis:
       •   Slowing enrollment growth
       •   Increased competition in nursing
       •   Pricing pressure from new competition
              •    Chamberlain tuition cost is in the top quintile
                   of programs
                                                                     Source: Company Filings, Compass Point Research

                          Online RN‐BSN Program Costs                                     Adtalem Operating Income by Program
              $30
  Thousands

              $25                                                                          8.2%

              $20                                                                                                        Medical and Healthcare
                                                                                  14.8%                                  (Chamberlain)
              $15
              $10
                                                                                                                         Business, Technology and
               $5                                                                                                        Management

                                                                                                                         International, K‐12 and
                                                                                                                         Professional
                                                                                                        76.9%

Source: Company Filings                                               Source: Company Filings 10K
                                                                                                                                                   21
Short Theme: Apparel

Company Description:                                                                                     Urban Outfitters (URBN)
•   Urban Outfitters, Inc. is a specialty retail       50
    company that offers a variety of lifestyle         45
    merchandise to highly defined customer niches      40
•   Urban Outfitters targets young adults aged 18      35
    to 28                                              30
                                                       25
                                                       20
Investment Thesis:
                                                       15
•   Operates in structurally challenged and

                                                                                       Apr‐14

                                                                                                                           Apr‐15

                                                                                                                                                               Apr‐16

                                                                                                                                                                                                   Apr‐17

                                                                                                                                                                                                                                       Apr‐18
                                                            Jul‐13
                                                                     Oct‐13
                                                                              Jan‐14

                                                                                                Jul‐14
                                                                                                         Oct‐14
                                                                                                                  Jan‐15

                                                                                                                                    Jul‐15
                                                                                                                                             Oct‐15
                                                                                                                                                      Jan‐16

                                                                                                                                                                        Jul‐16
                                                                                                                                                                                 Oct‐16
                                                                                                                                                                                          Jan‐17

                                                                                                                                                                                                            Jul‐17
                                                                                                                                                                                                                     Oct‐17
                                                                                                                                                                                                                              Jan‐18

                                                                                                                                                                                                                                                Jul‐18
    extremely competitive industry
•   Shift in spending to experiences relative to
                                                       Source: Bloomberg as of 05/31/2018
    apparel
•   Skeptical recent same-store-sales growth is                                        Urban Outfitters Sales and Comp Growth
    sustainable                                        15.00%                   We expect comps to
                                                                                meaningfully decelerate
                                                       10.00%
Valuation - trading 18-19x vs historical multiple of    5.00%
13-14x                                                  0.00%

                                                        ‐5.00%
Other short positions in apparel – American                                                                                                                              Zero to negative growth
                                                       ‐10.00%
Eagle (AEO), Abercrombie and Fitch (ANF)

                                                                                                                           Sales                         Comparable Sales

                                                       Source: Bloomberg as of 07/19/2018
                                                                                                                                                                                                                                          22
Short Theme: Managing Risk with Puts

                                                                                                                                                                                                                                                  Total Momentum ETF Assets
                                                                                                                                                                                   12

                 Uneconomic businesses that fail to                                                                                                                                10
                                                                                                                                                                                                                    Under $2 billion in assets to
                 generate profits and carry unsustainable                                                                                                                          8                                $10 billion in 2 years
                 valuations, in our view
                                                                                                                                                                                   6

                                                                                                                                                                                   4

                                                                                                                                                                                   2

                                                                                                                                                                                   0

                                                                                                                                                                                                 Sep‐13

                                                                                                                                                                                                                                       Sep‐14

                                                                                                                                                                                                                                                                                    Sep‐15

                                                                                                                                                                                                                                                                                                                                Sep‐16

                                                                                                                                                                                                                                                                                                                                                                           Sep‐17
                                                                                                                                                                                        Jun‐13

                                                                                                                                                                                                          Dec‐13
                                                                                                                                                                                                                   Mar‐14
                                                                                                                                                                                                                             Jun‐14

                                                                                                                                                                                                                                                 Dec‐14
                                                                                                                                                                                                                                                            Mar‐15
                                                                                                                                                                                                                                                                        Jun‐15

                                                                                                                                                                                                                                                                                                Dec‐15
                                                                                                                                                                                                                                                                                                             Mar‐16
                                                                                                                                                                                                                                                                                                                      Jun‐16

                                                                                                                                                                                                                                                                                                                                         Dec‐16
                                                                                                                                                                                                                                                                                                                                                  Mar‐17
                                                                                                                                                                                                                                                                                                                                                               Jun‐17

                                                                                                                                                                                                                                                                                                                                                                                       Dec‐17
                                                                                                                                                                                                                                                                                                                                                                                                  Mar‐18
                                                                                                                                                                                   Source: Bloomberg as of 06/30/2018

                  W, SHOP, NFLX, TSLA Cumulative Sales                                                                                                                                                    W, SHOP, NFLX, TSLA Cumulative Earnings
32500                                                                                                                                                                               100
                                                                                                                                                                                      0
27500
                                                                                                                                                                                   ‐100
22500                                                                                                                                                                              ‐200
                                                                                                                                                                                   ‐300
17500                                                                                                                                                                              ‐400
                                                                                                                                                                                   ‐500
12500
                                                                                                                                                                                   ‐600
 7500                                                                                                                                                                              ‐700
                                                                                                                                                                                                 Mar‐15
                                                                                                                                                                                                          May‐15
                                                                                                                                                                                                                    Jul‐15
                                                                                                                                                                                                                              Sep‐15
                                                                                                                                                                                                                                        Nov‐15
                                                                                                                                                                                                                                                   Jan‐16
                                                                                                                                                                                                                                                               Mar‐16
                                                                                                                                                                                                                                                                           May‐16
                                                                                                                                                                                                                                                                                       Jul‐16
                                                                                                                                                                                                                                                                                                    Sep‐16
                                                                                                                                                                                                                                                                                                                 Nov‐16
                                                                                                                                                                                                                                                                                                                           Jan‐17
                                                                                                                                                                                                                                                                                                                                     Mar‐17
                                                                                                                                                                                                                                                                                                                                              May‐17
                                                                                                                                                                                                                                                                                                                                                           Jul‐17
                                                                                                                                                                                                                                                                                                                                                                        Sep‐17
                                                                                                                                                                                                                                                                                                                                                                                    Nov‐17
                                                                                                                                                                                                                                                                                                                                                                                                Jan‐18
                                                                                                                                                                                                                                                                                                                                                                                                           Mar‐18
        Mar‐15
                 May‐15
                          Jul‐15
                                   Sep‐15
                                            Nov‐15
                                                     Jan‐16
                                                              Mar‐16
                                                                       May‐16
                                                                                Jul‐16
                                                                                         Sep‐16
                                                                                                  Nov‐16
                                                                                                           Jan‐17
                                                                                                                    Mar‐17
                                                                                                                             May‐17
                                                                                                                                      Jul‐17
                                                                                                                                               Sep‐17
                                                                                                                                                        Nov‐17
                                                                                                                                                                 Jan‐18
                                                                                                                                                                          Mar‐18

Source: Bloomberg as of 06/30/2018                                                                                                                                                 Source: Bloomberg as of 06/30/2018
                                                                                                                                                                                                                                                                                                                                                                                                           23
Otter Creek Long/Short Opportunity Fund
Current Sector Exposure

                          Source: Company Reports
                          As of 06/30/2018

                                                    24
Otter Creek Long/Short Opportunity Fund
Valuation of Portfolio

  Weighted Averages                                          As of July 13, 2018   Market Cap                                  As of June 30, 2018
                                     Market Cap   1
                                                               P/E '18   2
                                                                                                                            Gross Exposure 2
  Long Portfolio                      $43,390                   14.7x              Mega (>= 100 billion)                          5.7%
  Short Portfolio                     $48,580                   32.2x              Large (>= 10 billion & < 100 billion)         93.1%
  S&P 500                                                       17.5x              Mid (>= 1 billion & < 10 billion)             57.6%
  1
      Market Cap is in millions of dollars                                         Small (< 1 billion)                            8.6%
  2                                                                                2
      P/E estimated based on non‐Generally Accepted Accounting Principles (GAAP)       Gross Exposures are Delta Adjusted
      Source: Bloomberg

  Top 10 Securities                                        As of March 31, 2018    Top 10 Securities                           As of June 30, 2018
                                                            % of Net Assets                                                   % of Net Assets

  KLX Inc                                                        6.4%              KLX Inc                                         7.3%
  Leidos Holdings Inc                                            5.6%              Leidos Holdings Inc                             6.2%
  FLIR Systems Inc                                               4.8%              CDK Global Inc                                  5.0%
  CDK Global Inc                                                 4.3%              Ashland Inc                                     4.9%
  Ashland Inc                                                    4.3%              Zimmer Biomet Holdings Inc                      4.1%
  Berkshire Hathaway Inc‐CL B                                    3.5%              FLIR Systems Inc                                3.9%
  Potlatch Corporation                                           3.4%              Aramark Corp                                    3.8%
  NextEra Energy Partners LP                                     3.3%              Seacoast Banking Corp of Florida                3.8%
  Kirby Corp                                                     3.3%              E‐Trade Financial Corp                          3.5%
  Seacoast Banking Corp of Florida                               3.3%              Snap‐on Inc                                    ‐3.5%

                                                                                                                                                25
Drawdown Analysis
S&P 500 Drawdowns of 3% Since Inception of OTTRX

         Source: Company Reports
         As of 06/30/2018
     Performance data quoted is past performance. Past performance does not guarantee future results. The investment and principal value of an investment will
     fluctuate so that an investor's shares, when redeemed, may be worth more or less than their original cost. The current performance may be lower or higher than
     the performance data quoted. Performance data current to the most recent month‐end may be obtained by calling (855) 681‐5261. Performance data quoted
     does not reflect the 1% redemption fee on shares held for 60 days or less. If reflected, total returns would be reduced.

                                                                                                                                                                      26
Definitions

•   Correlation is a statistical measure of how two securities move in relation to each other. The correlation coefficient (r) is a measure that determines the degree to which two
    variable's movements are associated. The coefficient of determination (r2) is a measure used in statistical model analysis to assess how well a model explains and predicts future
    outcomes.
•   Delta is the ratio comparing the change in price of the underlying asset to the corresponding change in the price of a derivative.
•   Delta‐adjusted equity exposure is a representation of the portfolio's equity exposure which has been adjusted to take into account the combined effect of options and equity
    positions.
•   The EPS Growth is the change from year to year in the earnings per share of the S&P 500.
•   P/E or Price‐to‐Earnings is a ratio derived by dividing the price of a stock by the earnings per share of the company.
•   Standard deviation is a measure of the dispersion of a set of data from its mean.
•   A basis point (BP) is 1/100 of a percentage point. The Largest Drawdown is the greatest percentage peak‐to‐trough decline (high point to low point over consecutive days) since
    inception of the fund.
•   GDP reflects the Gross Domestic Product of a country. It is the monetary value of all the finished goods and services produced within a country's borders in a specific time period.
•   Generally Accepted Accounting Principles (GAAP) are a common set of accounting standards and procedures which companies should use to compile their financial statements in
    order to ensure consistency across different companies.
•   The Price to Sales Ratio (P/S) is calculated by dividing the company’s market capitalization by its total sales over a twelve month period.
•   The Book Value is the total value of a company which is calculated by taking the total assets minus the intangible assets (patents, goodwill, etc.) and liabilities.
•   The Market Capitalization (Market Cap) is the current market value of a company. It is derived by taking the outstanding shares times the current price.
•   FX and FOREX are acronyms that stand for Foreign Exchange. This is the idea of purchasing one currency by selling another.
•   Free cash flow is a measure of financial performance calculated as operating cash flow minus capital expenditures.
•   Capital expenditure, or CapEx, are funds used by a company to acquire or upgrade physical assets such as property, industrial buildings or equipment. It is often used to
    undertake new projects or investments by the firm.
•   Duration is a measure of the sensitivity in the value for a security whenever there is a change in interest rates.
•   Cash Flow is the net amount of cash and cash‐equivalents moving into and out of a business.
•   The Enterprise Multiple (EV/EBITDA) is a ratio used to determine the value of a company. It is calculated by taking the Enterprise Value and dividing it by EBITDA.
•   The Enterprise Value to Sales ratio (EV/sales) is a way to measure a company’s enterprise value versus its sales.
•   The Enterprise Value (EV) is a measure of a company’s value. It is calculated as market cap plus debt, minority interest and preferred shares, minus total cash and cash
    equivalents.
•   EBITDA is an acronym for Earnings Before Interest, Taxes, Depreciation, and Amortization expenses. It is a measure used to analyze and compare profitability between companies
    of different characteristics because it largely eliminates the effect of accounting and financing decisions.
•   Earnings growth is the annual rate of growth of earnings from investments.

                                                                                                                                                                                   27
Definitions

•   The Standard and Poor's 500 Index (S&P 500) is a capitalization‐weighted index of 500 stocks. The index is designed to measure performance of the broad domestic economy
    through changes in the aggregate market value of 500 stocks representing all major industries.
•   The Wilshire 5000 Index is a capitalization‐weighted index of over 5,000 securities. The index is designed to measure performance of all US equity securities with readily available
    price data.
•   The Institute for Supply Management (ISM) Manufacturing Purchasing Managers’ Index is an index which is comprised of surveys from purchasing managers in the
    manufacturing sector. It can be used as an indicator of the economic health of the manufacturing sector.
•   The Non‐Manufacturing ISM is a report produced by The Institute of Supply Management (ISM) for all sectors of the economy other than manufacturing. It can be used as an
    indicator of the overall economic condition for the non‐manufacturing sector.
•   The Institute for Supply Management (ISM) Purchasing Managers’ Composite Index is an index which is comprised of surveys from purchasing managers across all sectors of the
    economy It can be used as an indicator of the economic health of the economy as a whole.
•   NASDAQ is a global electronic marketplace for buying and selling securities as well as the benchmark index for U.S. technology stocks.
•   The NASDAQ Composite Index is a broad‐based capitalization‐weighted index of stocks in the NASDAQ marketplace.
•   The Federal Reserve Bank of New York (FRBNY) Underlying Inflation Gauge captures sustained movements in inflation from information contained in a broad set of price, real
    activity and financial data.
•   The Goldman Sachs Discretionary Most Short Index is an index of the most shorted consumer discretionary stocks which is compiled from data at Goldman Sachs Prime
    brokerage and New York Stock Exchange short interest data.
•   The EM10FX Spot Index is an index comprised of the 10 largest Emerging Market currencies as measured against the US Dollar.

                                                                  It is not possible to invest directly in an index                                                                28
Legal Disclaimers

  Otter Creek Advisors, LLC is the Advisor to the Otter Creek Long/Short Opportunity Fund which is distributed by Quasar Distributors, LLC.
  The Fund's investment objectives, risks, charges, and expenses must be considered carefully before
  investing. The statutory and summary prospectuses contain this and other important information about the
  investment company, and may be obtained by calling 1‐855‐681‐5261 or visiting
  www.ottercreekfunds.com. Read carefully before investing.

  Mutual fund investing involves risk; Principal loss is possible. The Fund is non‐diversified meaning it may concentrate its assets in fewer individual
  holdings than a diversified fund. Therefore, the Fund is more exposed to individual stock volatility than a diversified fund. Investments in debt
  securities typically decrease when interest rates rise. This risk is usually greater for longer‐term debt securities. Investments in lower‐rated and
  non‐rated securities present a greater risk of loss to principal and interest than higher rated securities. Investments in Asset‐Backed and Mortgage‐
  Backed securities include additional risks that investors should be aware of including credit risk, prepayment risk, possible illiquidity and default,
  as well as increased susceptibility to adverse economic developments. Investments in foreign securities involve political, economic, and currency
  risks, greater volatility, and differences in accounting methods. The Fund may use certain types of exchange traded funds or investment
  derivatives. Derivatives involve risks different from, and in certain cases, greater than the risks presented by more traditional investments.
  Derivatives may involve certain costs and risks such as liquidity, interest rate, market, credit, management and the risk that a position could not be
  closed when most advantageous. Investing in derivatives could lose more than the amount invested. ETF investments involve additional risks such
  as the market price trading at a discount to its net asset value, an active secondary trading market may not develop or be maintained, or trading
  may be halted by the exchange in which they trade, which may impact a fund's ability to sell its shares.
  Short sales of securities involves the risk that losses may exceed the original amount invested. Investments in Master Limited Partnerships (MLPs)
  which concentrate investments in the natural resource sector and are subject to the risks of energy prices and demand and the volatility of
  commodity investments. Damage to facilities and infrastructure of MLPs may significantly affect the value of an investment and may incur
  environmental costs and liabilities due to the nature of their business. MLPs are subject to significant regulation and may be adversely affected by
  changes in the regulatory environment. Investments in IPOs are subject to market and liquidity risks and such investments may have a magnified
  impact on the performance of the Fund. To qualify for treatment as a regulated investment company ("RIC") under the Internal Revenue Code
  ("Code"), the Fund must meet certain income source, asset diversification and annual distribution requirements. If, in any year, the Fund fails to
  qualify as a RIC for any reason, the Fund would be taxed as an ordinary corporation and would become (or remain) subject to corporate income
  tax. The resulting corporate taxes could substantially reduce the Fund's net assets, the amount of income available for distribution and the amount
  of the Fund's distributions.
  It is not possible to invest directly in an index.
  EPS Growth is not a measure of the Fund’s future performance
                                                                                                                                                           29
You can also read