CENTRAL LONDON - RESEARCH - QUARTERLY - OFFICES Q2 2018 - Knight Frank

Page created by Marion Medina
 
CONTINUE READING
CENTRAL LONDON - RESEARCH - QUARTERLY - OFFICES Q2 2018 - Knight Frank
RESEARCH

  CENTRAL
  LONDON
  QUARTERLY – OFFICES Q2 2018

CENTRAL LONDON SUPPLY   GLOBAL CAPITAL CONTINUES   CENTRAL LONDON PRIME
   REMAINED STABLE        TO FOCUS ON LONDON       YIELDS REMAINED STABLE
CENTRAL LONDON - RESEARCH - QUARTERLY - OFFICES Q2 2018 - Knight Frank
CENTRAL LONDON QUARTERLY Q2 2018                                   RESEARCH

EDITORIAL                                                                                                                                                                                CENTRAL LONDON VIEW
Despite Brexit uncertainty, the Central London office
market remains positive as we move past the first half
of the year, with a similar performance expected for the
                                                                                                                                                                                                             WILLIAM BEARDMORE-GRAY
rest of 2018                                                                                                                                                                                                 HEAD OF CENTRAL LONDON OFFICES
                                                                                                                                                                                                            “The Central London market has remained remarkably resilient throughout
Central London take-up remained robust in        next 12 months is already pre-let, leaving                “There is little reason                                                                          the post-referendum period, and I expect this to continue despite potential
Q2 2018, reaching 3.39 m sq ft, which is 7%      3.20 m sq ft of speculative space, which is                 to expect any                                                                                   headwinds in the global economy. Even with the spectre of Brexit, the ‘pull’
                                                                                                                                                                                                             factors of the capital outweigh the ‘push’ factors in both the occupational
ahead of the long-term average. In fact, only    equivalent to nine months of average levels                 significant change in                                                                           and investment markets.”
one H1 in the last ten years has seen a higher
volume of leasing activity, which provides a
                                                 of new and refurbished take-up.                             the current trends.
useful reference point to demonstrate just       Prime headline rents across the majority                    Money from across
how remarkable this year’s results have          of submarkets remained stable over the                      the globe remains                                                                                                       DAN GAUNT
                                                                                                                                                                                                                                     HEAD OF CITY AGENCY
been to date. However, it is worth noting that   quarter, with the exception of North of
                                                 Mayfair, King’s Cross, Paddington and
                                                                                                             focussed on Central                                                                                                   “With under offers and active demand levels up quarter-on-quarter, and the
take-up in Q2 would have totalled 2.75 m                                                                                                                                                                                             pipeline coming under pressure, the market is well set to deliver some real
sq ft without transactions undertaken by the     Southbank. Any negativity surrounding
                                                                                                             London as a place to                                                                                                    performance for landlords with the best buildings. The occupier market at
flexible office sector. The sector accounted     Brexit uncertainty will be offset by supply                 invest, and occupier                                                                                                    100,000 sq ft plus is particularly active whilst the level of sub 10,000 sq ft
                                                                                                                                                                                                                                     transactions has dropped significantly year-on-year, almost certainly due to
for 18% of take-up during the quarter, while     pressures, particularly in some of the                      sentiment is positive.”                                                                                                 the rise of the coworking offer.”
the long-term average is 6%.                     submarkets surrounding the traditional
The surge in flexible office take-up we          cores, where we expect to see some                         VICTORIA SHREEVES
witnessed across Central London last year        positive growth in headline rents.                         Central London Research                                                                                                           NICK BRAYBROOK
                                                                                                                                                                                                                                              HEAD OF CITY CAPITAL MARKETS
has certainly slowed in pace during the
                                                 Investment turnover reached £4.70 bn in                                                                                                                                                     “A bumper Q2 for City transactions, even if dominated by a few larger
first half of 2018. Total space taken by the                                                                                                                                                                                                   lots, will counter the negativity that some had after the seemingly quieter
                                                 the second quarter; making it the highest
sector reached 807,914 sq ft in H1, down                                                                                                                                                                                                       Q1. South-east Asian buyers still dominate, but the South Koreans
                                                 quarter for investment since Q1 2017 and
15% on H1 2017. We do not anticipate a                                                                                                                                                                                                         continue to gain competitiveness against the Hong Kong buyers, with
                                                 38% ahead of the long-term quarterly                                                                                                                                                          European investors also becoming more active. But the value-add
repeat of last year and estimate total annual
take-up from the sector to reach circa           average. London’s investment market                                                                                                                                                           assets are now gaining more favour with the local experts, as more
                                                 remained the focus of global capital in H1                                                                                                                                                    appreciate the supply squeeze in the occupier market.”
1.20m sq ft in 2018.
                                                 2018 – with overseas investors accounting
The public sector accounted for 23% of
                                                 for 84% of total turnover by price. Far
take-up during the quarter, inflated by the                                                                                                                                                                                                   ANTHONY BARNARD
                                                 Eastern purchasers were the dominant                                                                                                                                                         HEAD OF WEST END CAPITAL MARKETS
inclusion of the Chinese Consulate’s owner
                                                 investor group, accounting for 65% of                                                                                                                                                      “West End turnover returned to usual Q2 levels with £1.17 bn
occupier transaction at Royal Mint Court,
                                                 purchases in H1, with capital from Greater                                                                                                                                                   traded. The most notable change however being the dominance
EC3, totalling 567,193 sq ft, which was                                                                                                                                                                                                       of UK and European Investors who accounted for 54% of
the largest deal of the quarter. However, it     China alone accounting for 38%.
                                                                                                                                                                                                                                              purchasing capital up from 16% in Q1.”
was the financial sector that dominated in       Demand from Greater China has been
H1, accounting for around 24% of take-up,        focussed on large lot sizes, whereas the
followed by the TMT sector with 22%.
                                                 domestic purchasers have been more                   FIGURE 1
                                                                                                                                                                                                                                    IAN MCCARTER
Central London supply remained stable            active in the sub-£100m lot sizes. Over              Central London Take-up                                                                                                        HEAD OF WEST END AGENCY
                                                                                                      (million sq ft)
at 15.64 m sq ft over the quarter, which         the first six months of the year, there have                                                                                                                                     “The West End market continues to perform well. The theme of your office
equates to a vacancy rate of 6.9%. While         been 19 individual purchases of assets in                                                                                                                                          space being important to recruitment and talent retention continues with
                                                                                                                  H1            H2             H1 Long term average
availability in both the City and West End                                                                                                                                                                                          over 40% of take-up accounted for by new space. As we move forward,
                                                 excess of £100m, down 30% on the same                18
markets reduced marginally, the Docklands                                                                                                                                                                                           with 48% of the development pipeline already pre-let, we will continue
                                                 period last year.                                                                                                                                                                  to see more early engagement by occupiers as well as them having to
told a different story, with levels of supply                                                         16
                                                                                                                                                                                                                                    consider secondhand stock to satisfy their requirements.”
currently 38% above long-term average            As we move into the second half of 2018,             14
levels. This was boosted by 25 Cabot             money from across the globe remains
                                                                                                      12
Square, E14, entering the supply figures         focussed on Central London as a place to                                                                                                                     RICHARD PROCTOR
                                                                                                      10                                                                                                      HEAD OF CENTRAL LONDON TENANT REPRESENTATION
(199,000 sq ft).                                 invest, and occupier sentiment is positive;
                                                                                                                                                                                                            “Occupiers’ requirements remain focussed on maximising flexibility and agility against
                                                 since quarter-end Facebook (598,000 sq                8
Looking forward at the development                                                                                                                                                                            the backdrop of an uncertain political and economic outlook. Landlords able to
                                                 ft) and Publicis Groupe (211,000 sq ft)               6                                                                                                      provide this flexibility in terms, not just lease length but also ease, speed and restricted
pipeline, we believe supply has peaked and
                                                 have committed to a combined total of                                                                                                                        cost of occupation and exit, are in pole position to attract and retain tenants. The most
will fall over the course of the next twelve                                                           4
                                                                                                                                                                                                              successful landlords will be striving to work closely with their clients, their occupiers.”
months due to the lack of speculative new        circa 809,000 sq ft for their new Central
                                                                                                       2
and refurbished space due to complete in         London headquarters. Against a backdrop
                                                                                                       0
the second half of 2018 and 2019. Over half      of political uncertainty, the Central London
                                                                                                           2008
                                                                                                                  2009
                                                                                                                         2010
                                                                                                                                 2011
                                                                                                                                        2012
                                                                                                                                               2013
                                                                                                                                                      2014
                                                                                                                                                             2015
                                                                                                                                                                    2016
                                                                                                                                                                           2017
                                                                                                                                                                                  2018

of all space that is due for delivery over the   property market looks resilient.

2                                                                                     Please refer to the important notice at the end of this report                                                                                                                                                                  3
CENTRAL LONDON QUARTERLY Q2 2018                                              RESEARCH

                                                                WEST END                                                                                             CITY
    “Investment turnover                                                                                                                                                                                                                                                     “Investment turnover
      reached £1.17 bn                                                                                                                                                                                                                                                          reached £3.42 bn, 80%
      in Q2, across 22                                                 Vacancy rate            Quarterly take-up     Prime headline           Prime West End
                                                                                                                                                                                                                                                                                above the long-term
                                                                                                                                                                             Vacancy rate           Quarterly take-up       Prime headline          Prime City yield
      transactions, the                                                   is now                   totalled         rents remained at       yield unchanged at                  is now              remained above         rents remained at         unchanged at               average and the highest
                                                                                                                                                                                                      average at
      strongest quarter                                                                                                                                                                                                                                                         quarter of turnover
      since Q1 2017”                                                                                                                                                                                                                                                            since Q4 2014.”
                                                                        6.1%                    1.40m               £100.00
                                                                                                                      per sq ft
                                                                                                                                              3.50%                           6.9%                    1.85m                 £70.00                   4.25%
                                                                                                  sq ft                                                                                                 sq ft                per sq ft

FIGURE 2
                                                                Take-up                                            There is already 1.13 m sq ft under offer         Take-up                                             could offer an occupier over 100,000 sq ft.
                                                                                                                                                                                                                                                                            FIGURE 4
                                                                                                                   in the West End, and since quarter-end a                                                              However, three of these are already either
West End availability                                           Take-up in the West End increased by 17%                                                             Take-up in the second quarter of the year                                                              City take-up
                                                                                                                   total of 211,000 sq ft has been acquired                                                              under offer in their entirety or partially under   (million sq ft)
(million sq ft)                                                 in the second quarter of the year, from 1.20                                                         totalled 1.85 m sq ft, down by nearly 13%
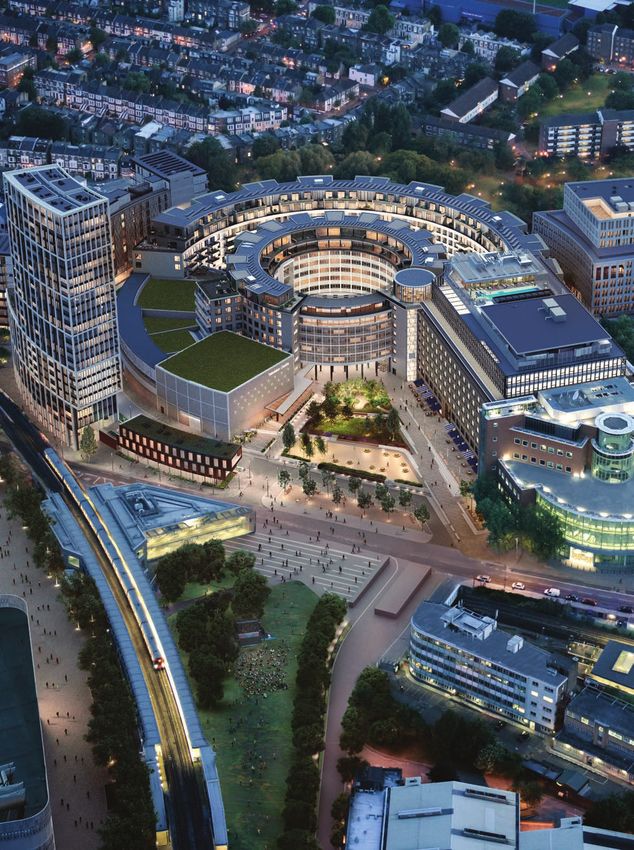
                                                                                                                   by Publicis Groupe at 2 Television Centre,                                                            offer. The largest include The Scalpel, 70 St
                                                                m sq ft in Q1 18 to 1.40 m sq ft in Q2 18.                                                           quarter-on-quarter but still 6% above the long-
                                                                                                                   White City.                                                                                           Mary Axe, and 1 Bartholomew Close. Looking
7                                                               Levels are now 16% above the long-term                                                               term average of 1.74 m sq ft. The demand for                                                           2.5
                                                                                                                                                                                                                         at future pipeline, there is currently 7.77 m sq
                                                                average. Take-up of new and refurbished            There is currently 2.10 m sq ft under             new and refurbished stock totalled 1.20 m
6                                                                                                                                                                                                                        ft under construction due to complete within
                                                                space increased by 40% quarter-on-quarter          construction across the West End; however,        sq ft, almost 17% above the level recorded for
                                                                                                                                                                                                                         the next three years; however, almost 45%          2.0
5                                                                                                                  48% of this has already secured a pre-let.        the same quarter last year and 62% above the
                                                                totalling 478,000 sq ft.                                                                                                                                 has already been pre-let.
                                                                                                                   There is 360,000 sq ft still due to complete      long-term average.
4                                                               The flexible offices sector accounted for                                                                                                                                                                   1.5
                                                                                                                   this year which is currently available.
                                                                                                                                                                     Demand was dominated by the public sector           Prime rents and incentives
                                                                28% of take-up in Q2, followed by TMT with
3                                                                                                                                                                    during Q2, certainly inflated by the inclusion of   The prime rent remained stable at £70.00 per
                                                                23%. However, it is the financial sector that      Prime Rents and incentives                        the Chinese Consulate’s 567,000 sq ft owner         sq ft, unchanged since Q4 2015. Rent free
                                                                                                                                                                                                                                                                            1.0
2                                                               has acquired the most space during the first       The prime headline rent in the West               occupier purchase of Royal Mint Court, EC3.         periods have remained at 24 months on a
                                                                six months of the year, totalling just over        End Core remained stable for the fifth            The TMT sector took second place with 22%                                                              0.5
                                                                                                                                                                                                                         typical 10-year term certain.
1                                                               477,000 sq ft.                                     consecutive quarter at £100.00 per sq             and flexible offices with 14%.
0                                                                                                                  ft, with rent free periods remaining at 24                                                            Investment                                         0.0
      Q2           Q3      Q4          Q1          Q2           Active requirements                                months on a 10-year lease.                        Active requirements                                 Investment turnover during the second
                                                                                                                                                                                                                                                                                     Q2        Q3         Q4    Q1          Q2
                  2017                      2018                                                                                                                                                                                                                                              2017                   2018
                                                                Total active requirements across the West                                                            Total active demand in the City increased by        quarter totalled £3.42 bn across 29 deals, a
                                                                End market fell by 23% from 3.36 m sq ft to        Investment                                        7% quarter-on-quarter from 4.27 m sq ft in          significant increase on the £1.49 bn recorded
                                                                2.63 m sq ft during Q2, however levels are         West End Investment totalled £1.17 bn in          Q1 to 4.58 m sq ft in Q2. Levels are now 13%        in Q1 and 44% above the level recorded in
FIGURE 3                                                        still 36% above the long-term average.             Q2, slightly below the long-term average but      above the long-term average of 4.07 m sq ft.        the same quarter last year. There were seven       FIGURE 5
West End under construction                                                                                        significantly ahead of the Q1 2018 figure of                                                          transactions that took place over £100 m,          City under construction by submarket
by submarket                                                    The TMT sector continues to dominate                                                                 It was the TMT sector that dominated the                                                               Q2 2018
                                                                                                                   £753 m. There were four transactions that                                                             five of which were purchased by far eastern
Q2 2018                                                         the demand profile, accounting for 44%,                                                              demand profile, accounting for 41% of
                                                                                                                   took place over £100 m, the largest being                                                             investors. The South Koreans continue to
                                                                followed by the corporates with 24%. The                                                             the active requirements, up from 18% the
                                                                                                                   the sale of Belstaff House, 135-147 New                                                               gain competitiveness against the Hong                                                  SOUTHBANK
                                                                number of active requirements over 50,000                                                            previous quarter. This was followed by the
                                                                                                                   Bond Street to Pacific Eagle, a substantial                                                           Kong buyers, with European investors also
              13% 7%                                            sq ft focussed on the West End fell by 10%         Singaporean based investor.
                                                                                                                                                                     manufacturing and corporate sector with 22%.
                                                                                                                                                                                                                         becoming more active. The largest transaction                           13%                     ALDGATE /

                                                                                                                                                                                                                                                                                      14%            MIDTOWN
                                                                                                                                                                                                                                                                                                               7%
                                                                                                                                                                                                                                                                                                                         WHITECHAPEL

    13%
              PADDINGTON                                        quarter-on-quarter.                                                                                                                                      of the second quarter was the sale of 5
                           VICTORIA          KENSINGTON /
                                                                                                                   The availability of investments is over           Supply and development                                                                                       SHOREDITCH/
                                      5%                                                                                                                                                                                 Broadgate, purchased by Hong Kong - based
                                                                                                                                                                                                                                                                                                                    4%
                                             CHELSEA
    BLOOMSBURY                                                                                                                                                                                                                                                                    CLERKENWELL
                                                                Supply and development                             double what it was in Q2 2017 at £1.82 bn         Supply levels in the City during the second         investor named CK Asset Holdings. The asset
                                       4%    KNIGHTSBRIDGE
                                                                                                                   although much of this is likely to go under       quarter of the year remained stable and on

16 %
                                                                                                                                                                                                                         was purchased for £1,000 m, reflecting a NIY
                                       4%    NORTH OF MAYFAIR   Supply fell by 4% in Q2 to 5.22 m sq ft;
                                                                                                                   offer over the summer.                            par with the previous quarter’s level of 8.30       of 3.95% and a capital value of £1,395 per sq
                                                                levels of availability are now 8% below
FITZROVIA                                    3% WEST END CORE                                                                                                        m sq ft. The vacancy rate is now 6.9%. The          ft. Overseas purchasers accounted for 89% of
                                                                the long-term average of 5.67 m sq ft. The         The most notable change is in respect of
                                             2% WHITE CITY                                                                                                           supply of new and refurbished space totalled        all transactions during Q2 by volume. Domestic
                                             2% STRAND          vacancy rate in the West End is now 6.1%,          purchaser nationality with UK and European

                    29%
                                             2% KING’S CROSS                                                                                                         2.65 m sq ft, well below the long-term              buyers remained active, with ten transactions,
                                                                the lowest level since Q1 2016.                    investors accounting for over 50% of the                                                                                                                                     CITY CORE

                                                                                                                                                                                                                                                                                                     62%
                                                                                                                                                                     average of 3.42 m sq ft.                            eight of which were below £20 m.
                                                                                                                   market, up from 16% in Q1, while Hong
           BATTERSEA/NINE ELMS                                  There are just two buildings that can offer        Kong investors who accounted for 28% in           There remains a shortage of supply of               Availability increased 12% on Q1 18 to
                                                                an occupier over 100,000 sq ft of new and          Q1, falling to 18% in Q2. Core prime yields       larger units, specifically over 100,000 sq ft.      £5.55 bn, 47% of this figure was already under
                                                                refurbished space; West Works, White City          for liquid freehold assets remain at 3.50%        Following the recent inclusion of 70 St Mary        offer at quarter end, leaving just £3.00 bn of
                                                                Place, W12 and the remaining floors at The         although this rises sharply for larger lot size   Axe in to our supply figures; there are just        investment stock available to buy. The prime
                                                                Post Building, 21/31 New Oxford Street, WC1.       and non-prime assets.                             seven new and refurbished buildings that            yield in the Core remained at 4.25%.

4                                                                                                                                                                                                                                                                                                                                5
CENTRAL LONDON QUARTERLY Q2 2018                  RESEARCH

     CAPITAL FLOWS
    The continued appetite for moving money and increasing investment
    cross-border shows no signs of abating. What’s more, global capital
    continues to focus on Central London.

    With investment volumes totalling £6.89 bn,       However, London increasingly enjoys
    H1 2018 has seen much stronger activity           another benefit, in the form of relative        Top 10 Most Active Markets for Cross-border Investment - H1 2018
    than many had anticipated. Indeed,                value. One corollary of rising demand for
    according to data from RCA, Central London        European real estate is that capital has
    is once again the most liquid real estate         been funnelled into continental markets
    market in the world. And while the market in      that are traditionally nowhere near as
    2017 was clearly defined by global capital        liquid as London, and this has quickly led
    striking £1bn+ mega-deals, this year has          to exceptionally low yields – 3.00% is a
    arguably seen the trend continue, with seven
                                                      common prime yield across many
                                                      European cities, not just capitals.
                                                                                                            £5.66bn
    of the 11 £200m+ deals completed by
    overseas purchasers.                              In a comparative sense at least, London
                                                      office prime yields can therefore seem
                                                                                                                                £5.06bn
    At the macro level, the rationale for this
                                                      good value to overseas investors,
    demand is relatively straight forward: as our
                                                      particularly given prospects of modest
    recent Active Capital research
                                                      rental growth, and the recent movements
    demonstrates, there is still a significant        in Sterling, which provide an added
    – and growing – weight of capital targeting       currency advantage. Longer-term, this
    real estate as an asset class. It derives from    could prove the right mix of attributes to
    a range of investors that spans global            attract global capital targeting Europe, a
    institutions, to equity funds, to private         significant proportion of which comes
    capital, all of which value the ability to        from experienced overseas investors who
    deploy capital in large lot sizes. As we detail   are less singularly focussed on capital
    in the research, there are good reasons to        preservation and value the prospect of
    expect this demand for real estate assets to      comparatively healthy income returns.
    remains intact.
                                                                                                                                             £1.97bn
    But why does it continue to favour London?
    All of the standard arguments of stability,
                                                                                                                                                       £1.71bn
    transparency, and liquidity hold true, of
    course. And we could highlight research
                                                                                                                                                                    £1.27bn
    from our global Wealth Report, which shows
                                                                                                                                                                               £1.05bn
    that many ultra high net worth individuals –                                                                                                                                           £0.72bn         £0.69bn £0.64bn       £0.63bn
    of which the next five years are set to see
    rapid growth globally – rank London as their
    first port of call for their maiden overseas                                                              CENTRAL           HONG KONG     PARIS    MANHATTAN     KOWLOON   MUNICH WESTERN CRESCENT      DUBLIN   FRANKFURT     TOKYO
    property investments.                                                                                     LONDON            ISLAND CBD   CENTRAL                   CBD            LA DEFENSE (PARIS)                          5 WARDS
                                                                                                   Source: Knight Frank / RCA

6                                                                                                                                                                                                                                           7
CENTRAL LONDON QUARTERLY Q2 2018                                        RESEARCH

                                                      DOCKLANDS                                                                                         BREXIT AND LONDON
    “Supply in Docklands                                                                                                                               FINANCE
      is now 38% ahead                                                                                                                                  Uncertainty still surrounds the outlook for London’s
      of long-term average                                    Vacancy rate          Quarterly take-up      Prime headline               Investment      financial cluster, but the expected impact is looking far
                                                                 is now                 totalled          rents remained at           turnover totals
      levels, boosted by 25                                                                                                                             less worrying than it did back 2016.
      Cabot Square, E14.”                                                                                                                                                                                                                                 “This came in the
                                                                                                                                            £
                                                                                                                                                        In July, the Bank of England’s Deputy           Given these tentative signs of recovery,            same month that
                                                             10.4%                  142,000               £42.50
                                                                                                           per sq ft
                                                                                                                                  £108.5m               Governor, Sam Woods, told Bloomberg             the government’s decision not to seek               Goldman Sachs
                                                                                          sq ft                                                         News he expected financial firms in the UK
                                                                                                                                                        to relocate between 5,000 and 10,000 jobs
                                                                                                                                                                                                        single market membership for finance is
                                                                                                                                                                                                                                                            announced that
                                                                                                                                                                                                        a disappointment. While, 5,000-10,000
                                                                                                                                                        on “day one” after Brexit. This implies that    jobs is the equivalent of just 1.3%-2.6% of
                                                                                                                                                                                                                                                           they would occupy
                                                                                                                                                        more jobs would follow in the long-term,        London’s financial workforce, it is a shame        all but half a floor of
                                                                                                                                                        although in subsequent years one would          to lose any jobs.                                  the new headquarters
                                                      Take-up                                           now 38% above the long-term average,
FIGURE 6
                                                                                                        reflecting a vacancy rate of 10.4%. The
                                                                                                                                                        expect new non-EU business to emerge
                                                                                                                                                                                                        Oliver Wyman estimate that around 25% of           they have under
Docklands availability                                Take-up in the second quarter of the year                                                         to replace lost revenue. The Bank’s figure
(million sq ft)                                       totalled 142,433 sq ft, significantly below
                                                                                                        vacancy rate in Canary Wharf increased
                                                                                                                                                        tallies with a survey of financial firms by
                                                                                                                                                                                                        the UK financial sector’s business comes           construction
                                                      the 394,000 sq ft recorded in Q1, and 40%         from 7.3% in Q1 to 10.7% in Q2, due to
                                                                                                                                                        Reuters, released in March, suggesting
                                                                                                                                                                                                        from the EU. Were the country to lose all of       in London.”
        CANARY WHARF
                                                      below the long-term average. There were           inclusion of circa 200,000 sq ft at The                                                         that business, a 25% fall in financial sector
        REST OF DOCKLANDS                                                                                                                               5,000 jobs could relocate.
2.5                                                   five deals compared to 18 the previous            Cabot, 25 Cabot Square, which will be                                                           leasing deals in Central London would              JAMES ROBERTS
                                                      quarter. The largest deal was The Office          delivered in Q4 2018 albeit 110,000 sq ft is    Mr Woods added: “I think it will be at the      be the equivalent of losing 12 days’ total         Partner, Chief Economist
                                                      Group’s acquisition of just over 81,000 sq ft     already under offer.                            bottom end of that range. If anything, it       market take-up per year – based on activity
2.0
                                                      at One Canada Square.                                                                             might be slightly below that.” Interestingly,   over the last decade.
                                                                                                        The commercial pipeline remains particularly
                                                                                                                                                        his comments were made after it became
1.5                                                   The business-to-business sector was               tight with 1.71 m sq ft under construction                                                      This is not welcome but it is manageable,
                                                                                                                                                        widely known that the UK would not
                                                      the most active in the market during              and due for completion by the end of 2021,                                                      particularly when considering that London
                                                                                                                                                        be seeking single market membership
1.0                                                   Q2 accounting for 71% of transactions,            25% of which is already pre-let. There are                                                      would only see twelve lost days in the first
                                                                                                                                                        for services.
                                                      followed by the public sector with 19%.           a number of other development sites in                                                          year. With the emergence of new trade
0.5                                                                                                     Stratford capable of being delivered in 2020    This came in the same month that Goldman        relationships for the UK, the finance sector
                                                      There is already 433,300 sq ft under offer in
                                                      the Docklands market, a sign that take-up         and 2021, but are likely to remain on hold      Sachs announced that they would occupy          would slowly replace the lost business.
0.0                                                   in Q3 will return to above average levels.        until a pre-let is secured.                     all but half a floor of the new headquarters    Another factor to consider is the on-going
          Q2       Q3       Q4   Q1          Q2                                                                                                         they have under construction in London.
                  2017                2018            The largest unit under offer is 130,000 sq ft                                                                                                     and rising commitment to London we are
                                                      at 5 Churchill Place, a sublease to BGC           Rental Profile                                  There had been widespread expectations          seeing from the tech sector. On announcing
                                                      Partners Inc.                                     The prime headline rent remained stable         the US bank would release a large amount        a 600,000 sq ft office pre-let at King’s Cross
FIGURE 7                                                                                                                                                of Brexit-related sub-let space.
                                                                                                        at £42.50 per sq ft for the third                                                               in July, Facebook’s Managing Director for
Canary Wharf prime headline rents                     Active requirements                               consecutive quarter.                                                                            Northern Europe, Steve Hatch, told the
£ per sq ft                                                                                                                                             The threat of Brexit relocations from the
                                                      The level of active requirements increased                                                                                                        press: “The UK is one of the best places in
                                                                                                                                                        financial sector has been a shadow hanging
                                                      for the first time since Q3 2017. Active          Investment                                      over the London economy for the last two        the world to be a technology company and
 50                                                   demand in Docklands now totals 695,000
                                                                                                        There was one investment sale during Q2         years. In 2016, forecasts of 100,000 job        we’re investing here for the long term.”
                                                      sq ft, however, levels are now 67% above
                                                                                                        2018 in the Docklands market. 1 Westferry       relocations had been quoted. However,
                                                      the long-term average.                                                                                                                            Moreover, the UK leaving the EU does not
                                             £42.50                                                     Circus was purchased by a Czech investor        slowly but surely the forecasts have
                                                                                                                                                                                                        per se mean the end of the entire 25%
 40                                                   It should be noted that a significant number      PPF Real Estate for £108.5 m, which             gravitated towards “the bottom end of the
                                                                                                                                                                                                        of European business. In the short-term
                                                      of Central London-wide requirements               reflects a NIY of 5.82% and a capital value     range” as Mr Woods puts it.
                                                                                                                                                                                                        some firms will use back-to-back deals to
                                                      totalling 1.10m sq ft could consider              of £485 per sq ft.
                                                      Docklands options. The finance sector was                                                         Since the referendum, output from the           continue trading. Further down the line,
 30
                                                      the most active in the market accounting for      There are currently three assets on             financial sector, according to ONS, has         once the UK has formally left the EU and
                                                      510,000 sq ft of total active requirements.       the market in E14; 1 Cabot Square, 11           been broadly flat; however, there are signs     tempers have cooled on both sides, it could
                                                                                                        Westferry Circus and 4 & 5 Harbour              it is starting to pick up. The three months     become politically easier to agree a financial

 20
                                                      Supply and development                            Exchange, two of which are already under        to May saw financial output rise by 0.3%        services trade deal that maintains some
       2001
       2002
       2003
       2004
       2005
       2006
       2007
       2008
       2009
       2010
       2011
       2012
       2013
       2014
       2015
       2016
       2017
      Q2 18

                                                      Supply in Docklands increased by around           offer. The lack of stock in this market         compared to three months earlier, a marked      lines of business. If this occurs during the
                                                      15% from 1.83 m sq ft in Q1 18 to 2.12 m          will continue to influence the investment       contrast to the final months of 2017 when       transition period after March 2019, it would
                                                      sq ft in Q2. Current availability levels are      turnover figures for the foreseeable future.    the sector contracted.                          further soften the effect on the economy.

8                                                                                                                                                                                                                                                                                     9
CENTRAL LONDON QUARTERLY Q2 2018                                                                     RESEARCH

­­KEY STATISTICS                                                                                                                               THE CENTRAL LONDON OFFICE MARKET
Central London office market

                                                                                                         % CHANGE             Long-term
                                                  Q2 17      Q3 17      Q4 17      Q1 18       Q2 18    3 mths   12 mths   quarterly average
         AVAILABILITY           West End          5.88 m     5.48 m     5.83 m     5.46 m     5.22 m      -4%      -11%         5.67 m
                (sq ft)
                                City              8.84 m     7.95 m     8.46 m     8.27 m     8.30 m       0%       -6%         9.31 m                                                                                                                                         Stratford

                                Docklands         1.45 m     1.75 m     2.10 m     1.83 m     2.12 m      16%       46%         1.53 m
                                                                                                                                                                                                           Euston /
                                                                                                                                                                                                         King’s Cross N1C
                                Central London   16.17 m    15.18 m    16.39 m    15.56 m    15.64 m       1%       -3%        16.51 m                                                                      NW1

                                                                                                                                                                                                                                         Shoreditch /
                                                                                                                                                                                                                Blooms-                  Clerkenwell
                                                                                                                                                                                                                  bury
                                                                                                                                                                                              North       Fitzrovia         Midtown
            VACANCY                                                                                                                                                     Paddington
                                                                                                                                                                                            of Mayfair
                                                                                                                                                                                                                                                         Aldgate /
                                                                                                                                                                                                                                                                                     DOCKLANDS
              RATE              West End            6.9%       6.4%       6.8%       6.3%       6.1%       n/a       n/a         6.4%                                                                 Soho Strand/
                                                                                                                                                                                                            Covent
                                                                                                                                                                                                                                         CITY CORE      Whitechapel
                                                                                                                                                                                                 Mayfair
                                                                                                                                                 White    W11                                               Garden
                                                                                                                                                                                              WEST END                                                                                           E16
                                City                7.3%       6.6%       7.1%       6.9%       6.9%       n/a       n/a         7.9%            City                                                  St
                                                                                                                                                                                                CORE James’s
                                                                                                                                                                                                                                                                           Canary
                                Docklands           7.3%     10.2%      10.6%        8.1%      10.4%       n/a       n/a         7.3%                              W8
                                                                                                                                                                                                                                      Southbank
                                                                                                                                                                                                                                                                           Wharf

                                                                                                                                                                   Kensington        Knightsbridge
                                Central London      7.1%       6.9%       7.3%       6.8%       6.9%       n/a       n/a         7.3%                    W14
                                                                                                                                                                   & Chelsea                                                                                                  E14
                                                                                                                                                                                                            Victoria
                                                                                                                                                                           SW7
                                                                                                                                                                                      SW3

             TAKE-UP            West End          1.24 m     1.65 m     1.34 m     1.21 m     1.40 m      17%       13%         1.15 m
                                                                                                                                                                                                         Nine Elms

                (sq ft)
                                City              1.91 m     1.58 m     2.33 m     2.12 m     1.85 m     -13%       -3%         1.74 m
                                Docklands         0.05 m     0.25 m     0.38 m     0.39 m     0.14 m     -64%      180%         0.24 m
                                Central London    3.20 m     3.48 m     4.05 m     3.72 m     3.39 m      -9%        6%         3.13 m

          ACTIVE
       REQUIREMENTS             West End          2.13 m     2.31 m      2.8 m     3.36 m     2.63 m     -22%       23%         1.93 m         WEST END                                                                                                 CITY
                (sq ft)         City              4.64 m     4.01 m     4.46 m     4.27 m     4.58 m       7%       -1%         4.07 m         West End Core – West End Core refers to Mayfair and St James’s,                                          City Core – City Core refers to EC2 (excluding EC2A), EC3, EC4
                                Docklands         0.70 m     0.73 m     0.50 m     0.28 m     0.70 m     150%        0%         0.42 m         the area bounded by Oxford Street, Regent Street and Park Lane in                                        (excluding EC4A and EC4Y), and EC1A.
                                                                                                                                               W1 and by Green Park, St James’s Park and The Mall in SW1.                                               Midtown – Midtown refers to EC1N, EC4A, EC4Y, WC1 (excluding
                                Unspecified       1.15 m     1.40 m     2.88 m     3.44 m     3.10 m     -10%      170%         1.66 m
                                                                                                                                               North of Mayfair – North of Mayfair refers to the area north of                                          Bloomsbury), and WC2 (excluding Strand/Covent Garden).
                                Central London    8.62 m     8.45 m    10.64 m    11.35 m    11.01 m      -3%       28%         8.08 m
                                                                                                                                               Oxford Street, west of Portland Place.                                                                   Shoreditch/Clerkenwell – Shoreditch/Clerkenwell refers to EC1
                                                                                                                                               Fitzrovia – Fitzrovia also known as Noho, refers to the area north of                                    (excluding EC1A and EC1N), and EC2A.
                                                                                                                                               Oxford Street, east of Portland Place.                                                                   Aldgate/Whitechapel – Aldgate/Whitechapel refers to E1.
          UNDER                 West End          3.16 m     2.12 m     2.35 m     2.14 m     2.10 m      -2%      -34%         2.38 m         Soho – Soho refers to W1B, W1F and W1D.                                                                  Southbank – Southbank refers to SE1.
       CONSTRUCTION
                (sq ft)         City              8.43 m     8.69 m     8.52 m     7.95 m     7.77 m      -2%       -8%         5.99 m         Euston/King’s Cross – Euston/King’s Cross refers to NW1 and N1C.
                                Docklands         0.70 m     0.90 m     0.96 m     1.29 m     1.71 m      33%      144%         0.51 m         Victoria – Victoria refers to SW1 (excluding St James’s) and SW1X.
                                                                                                                                                                                                                                                        DOCKLANDS
                                Central London                                    11.38 m    11.58 m       2%                                                                                                                                           Canary Wharf – Canary Wharf refers to the area comprising Canary
                                                 12.29 m    11.71 m    11.83 m                                      -6%         8.88 m         Bloomsbury – Bloomsbury refers to the area of WC1 bounded by
                                                                                                                                                                                                                                                        Riverside, Westferry Circus, Columbus Courtyard, Cabot Square,
                                                                                                                                               Euston Road, Southampton Row, New Oxford Street and Tottenham
                                                                                                                                                                                                                                                        Canada Square, Blackwall Place and Heron Quays (East).
                                                                                                                                               Court Road.
                                                                                                                                                                                                                                                        Rest of Docklands – Rest of Docklands refers to E14 and E16
                                                                                                                                               Strand/Covent Garden – Strand/Covent Garden refers to WC2,
                                                                                                                                                                                                                                                        including the Royal Business Park (excluding Canary Wharf), and
          INVESTMENT            West End         £1.22 bn   £0.67 bn   £1.15 bn   £0.76 bn   £1.17 bn     54%       -4%       £1.24 bn         west of Kingsway.
                                                                                                                                                                                                                                                        Stratford E20.
                                City             £2.37 bn   £2.78 bn   £2.95 bn   £1.49 bn   £3.42 bn    130%       44%       £1.90 bn         Paddington – Paddington refers to W2.
                                Docklands          £0 bn    £0.41 bn   £0.71 bn     £0 bn    £0.11 bn      n/a       n/a      £0.38 bn         Kensington/Chelsea – Kensington/Chelsea refers to SW3, SW7,
                  £             Central London   £3.59 bn   £3.86 bn   £4.81 bn   £2.25 bn   £4.70 bn    109%       31%       £3.52 bn         W8, W11, W14.
                                                                                                                                               Knightsbridge – Knightsbridge refers to SW7 and SW1X, which
                                                                                                                                               includes Belgravia.
                                                                                                                                               White City – White City refers to W12.
Source: Knight Frank Research
                                                                                                                                               Nine Elms/Battersea – Nine Elms refers to SW8.

10                                                                                                                                                                                                                                                                                                                        11
COMMERCIAL RESEARCH
                                                                                                                                                                                                                                                                                                                                                William Beardmore-Gray, Partner
                                                                                                                                                                                                                                                                                                                                                Head of Central London
                                                                                                                                                                                                                                                                                                                                                +44 20 7629 1308
                                                                                                                                                                                                                                                                                                                                                william.beardmore-gray@knightfrank.com

                                                                                                                                                                                                                                                                                                                                                James Roberts, Partner
                                                                                                                                                                                                                                                                                                                                                Chief Economist
                                                                                                                                                                                                                                                                                                                                                +44 20 7861 1239
                                                                                                                                                                                                                                                                                                                                                james.roberts@knightfrank.com

                                                                                                                                                                                                                                                                                                                                                Victoria Shreeves, Associate
                                                                                                                                                                                                                                                                                                                                                Central London Research
                                                                                                                                                                                                                                                                                                                                                +44 20 3826 0636
                                                                                                                                                                                                                                                                                                                                                victoria.shreeves@knightfrank.com

                                                                                                                                                                                                                                                                                                                                                Hayley Blackwell, Associate
                                                                                                                                                                                                                                                                                                                                                Central London Research
                                                                                                                                                                                                                                                                                                                                                +44 20 7861 1241
                                                                                                                                                                                                                                                                                                                                                hayley.blackwell@knightfrank.com
                                                General Note                                                                                                                                                                                                            is currently on the market and is either new or
                                                                                                                                                                                                                                                                        completely refurbished.	
                                                This report has been prepared by Knight Frank Research,
                                                the research and consultancy division of Knight Frank.                                                                                                                                                              	Second-hand A Grade: Previously occupied space
                                                Knight Frank Research gratefully acknowledges the                                                                                                                                                                     with air-conditioning.
                                                assistance given by the West End, City and Docklands                                                                                                                                                                	Second-hand B Grade: Previously occupied space
                                                Offices in the compilation and presentation of this material.                                                                                                                                                         without air-conditioning.
                                                Certain data sourced from LOD. All graph data sourced by                                                                                                                                                            v.	Demand figures quoted in this report refer to named
                                                Knight Frank.                                                                                                                                                                                                           requirements for over 10,000 sq ft.
                                                                                                                                                                                                                                                                    vi.	Under construction figures quoted in this report
                                                Technical Note
                                                                                                                                                                                                                                                                         refer to developments of over 20,000 sq ft which are
                                                The following criteria have been adopted in the preparation                                                                                                                                                              currently underway. They do not include properties
                                                of this report.                                                                                                                                                                                                          undergoing demolition.
                                                i.	All floorspace figures quoted in this report refer to                                                                                                                                                           vii.	Investment figures quoted in this report refer to
                                                    sq ft net.                                                                                                                                                                                                            accommodation where the majority of income/
                                                ii.	Take-up figures refer to space let, pre-let, or acquired                                                                                                                                                             potential income is from office usage and comprises
                                                     for occupation during the quarter.                                                                                                                                                                                   transactions of £1 m and above.

                                                iii.	Availability refers to all space available for immediate                                                                                                                                                      	The data includes standing investments, site
                                                      occupation, plus space still under construction which                                                                                                                                                           purchases and funding transactions.
                                                      will be completed within six months and which has                                                                                                                                                             viii.	This report is produced to standard quarters.
                                                      not been let.                                                                                                                                                                                                 	Quarter 1: January 1 – March 31,
                                                iv.	Availability and take-up are classified into three grades:                                                                                                                                                            Quarter 2: April 1 – June 30,
                                                	New/refurbished: Space under construction which is                                                                                                                                                                       Quarter 3: July 1 – September 30,
                                                     due for completion within six months or space which                                                                                                                                                                   Quarter 4: October 1 – December 31

                                                Knight Frank Research provides strategic advice, consultancy services and forecasting to a wide
                                                range of clients worldwide including developers, investors, funding organisations, corporate
                                                institutions and the public sector. All our clients recognise the need for expert independent advice
                                                customised to their specific needs.

                                RECENT MARKET-LEADING RESEARCH PUBLICATIONS
                                                                                                             RESEARCH                                                                                                                                                                                      Occupier Services   Retail Banking

                                                                                                                                                                                                                                                                                                           Your
                                                                                                                                                                                                                                                                                                           Future,
                                                                      THE 2018 REPORT

                                                                                                                                                                                                                                                                                                           Now
                                                 THE FUTURE
                                                                                                             BITCOIN:
                                                 OF REAL ESTATE
                                                 THE TRENDS SHAPING
                                                                                                             BITS AND BLOCKS
                                                 40 LEADING CITIES
                                                                                                             OF REAL ESTATE
                                                                                        ELON                 Could the blockchain introduce
                                                                                                             more liquidity and volatility into                NOT THE FAIREST
                                                                                                                                                               OF THEM ALL
                                                                                                                                                                                                                  Created with the intent to simplify and
                                                                                                                                                                                                                  expedite online payments by circumventing

                                                                                        MUSK
                                                                                                             real estate prices?                                                                                  third-party processors and currency
                                                                                                                                                                                                                  controls, bitcoin is said to provide more
                                                                                                             For some, bitcoin remains shrouded in                                                                control of one’s own transactions across
                                                                                                             mystery. This article offers an overview          Bitcoin appears to be inching into real            borders. There is no need to consider
                                                                                                             of bitcoin, and examines its relevance to         estate – but what exactly is it?                   hidden charges, identity theft, and banking
                                                                                                             the real estate industry. The strengths,                                                             hours; there is no counterparty risk. Lack of
                                                                                                                                                               It is a peer-to-peer cryptocurrency. In English:
                                                                                                             weaknesses, opportunities and threats for                                                            replicability and a finite supply of 21 million
                                                                                                                                                               Bitcoin is an electronic form of payment,
                                                                                                             bitcoin in real estate are encapsulated in a                                                         bitcoins even imply in-built inflation control.
                                                                                        TRAINS, R O CKETS    SWOT analysis. In our view, price volatility
                                                                                                                                                               neither controlled by a central authority or a
                                                                                                                                                               clearing agent, nor printed like the sterling      The number of bitcoins in circulation has
                                                                                                             and reputational issues limit Bitcoin’s value
                                                                                        & S OL AR ENER GY    as a currency for buying property for now,        or dollars. Instead, they are mined (created)
                                                                                                                                                               by individuals and organisations around
                                                                                                                                                                                                                  almost tripled in the last six years with 80%
                                                                                                                                                                                                                  of supply now in use, though the number of
                                                                                                             but the blockchain has huge long-term
                       G LO B A L C I T I E S

                                                                                                             potential to speed and facilitate transactions.   the globe, managed by nodes (computers             bitcoin trades in a given week only make up
ANK.COM/GLOBALCITIES                                                                                         However, this would increase liquidity, and       connected to the blockchain), and secured          the equivalent of less than 1.0% of the global
                                                                                                             inevitability price volatility.                   through cryptography.                              foreign exchange market.
COM/GLOBALCITIES                                                         4th Edition

                                                                                                             1

                                                Global Cities Report –                                      Bitcoins – Bits and                                                                                                                                        The London Report                   UK Retail Banking
                                                2018                                                        Blocks of Real Estate                                                                                                                                      2018                                Sector Profile 2018
                                                                                                            2018

                                 Knight Frank Research Reports are available at KnightFrank.com/Research

                                            Important Notice
                                            © Knight Frank LLP 2018 – This report is published for general information only and not to be relied upon in any way.
                                            Although high standards have been used in the preparation of the information, analysis, views and projections presented
                                            in this report, no responsibility or liability whatsoever can be accepted by Knight Frank LLP for any loss or damage
                                            resultant from any use of, reliance on or reference to the contents of this document. As a general report, this material
                                            does not necessarily represent the view of Knight Frank LLP in relation to particular properties or projects. Reproduction
                                            of this report in whole or in part is not allowed without prior written approval of Knight Frank LLP to the form and content
                                            within which it appears. Knight Frank LLP is a limited liability partnership registered in England with registered number
                                            OC305934. Our registered office is 55 Baker Street, London, W1U 8AN, where you may look at a list of members’ names.
You can also read