Vision-based Real Estate Price Estimation
←
→
Page content transcription
If your browser does not render page correctly, please read the page content below
Vision-based Real Estate Price Estimation

                                                                     Omid Poursaeed,1,3 Tomáš Matera3 and Serge Belongie2,3
                                                               1
                                                                School of Electrical and Computer Engineering, Cornell University
                                                           2
                                                               Department of Computer Science, Cornell University 3 Cornell Tech
                                                                            {op63,sjb344}@cornell.edu, tomas@matera.cz
arXiv:1707.05489v3 [cs.CV] 3 Oct 2018

                                                                   Abstract                               timates the value of a house based on the user-submitted in-
                                                                                                          formation and publicly available data. The Zestimate home
                                           Since the advent of online real estate database compa-         valuation is Zillow’s estimated market value for houses. It is
                                        nies like Zillow, Trulia and Redfin, the problem of automatic     calculated, using a proprietary formula, for about 110 mil-
                                        estimation of market values for houses has received consid-       lion homes in the United States. It takes into account fac-
                                        erable attention. Several real estate websites provide such       tors like physical attributes, tax assessments and prior trans-
                                        estimates using a proprietary formula. Although these es-         actions. The Zestimate has a median error rate of 7.9%2 ,
                                        timates are often close to the actual sale prices, in some        which means half of the Zestimates are closer than the error
                                        cases they are highly inaccurate. One of the key factors that     percentage and half are farther off. Redfin has also released
                                        affects the value of a house is its interior and exterior ap-     an estimator tool recently that purportedly outperforms Zes-
                                        pearance, which is not considered in calculating automatic        timate. It uses massive amounts of data from multiple list-
                                        value estimates. In this paper, we evaluate the impact of vi-     ing services. Redfin’s estimate considers more than 500
                                        sual characteristics of a house on its market value. Using        data points representing the market, the neighborhood and
                                        deep convolutional neural networks on a large dataset of          the home itself to arrive at an estimate for 40 million homes
                                        photos of home interiors and exteriors, we develop a method       across the United States. It is claimed to have 1.82% me-
                                        for estimating the luxury level of real estate photos. We also    dian error rate for homes that are listed for sale, and 6.16%
                                        develop a novel framework for automated value assessment          for off-market homes3 .
                                        using the above photos in addition to home characteristics           Neither Redfin nor Zillow consider the impact of inte-
                                        including size, offered price and number of bedrooms. Fi-         rior and exterior appearance in their automated valuation
                                        nally, by applying our proposed method for price estima-          methods. However, the visual aspects of a house are key
                                        tion to a new dataset of real estate photos and metadata, we      elements in its market value. Home staging companies use
                                        show that it outperforms Zillow’s estimates.                      this fact to make a home more appealing to buyers. In view
                                                                                                          of the importance of design and appearance on the value of
                                                                                                          a house, in this paper we propose a novel framework for
                                        1. Introduction                                                   incorporating the impact of interior and exterior design in
                                                                                                          real estate price estimation. By applying our network to a
                                            The real estate industry has become increasingly digital
                                                                                                          dataset of houses from Zillow, we evaluate its performance.
                                        over the past decade. More than 90% of home buyers search
                                                                                                             Our contributions can be summarized as follows:
                                        online in the process of seeking a property 1 . Homeown-
                                        ers list their properties on online databases like Zillow, Tru-      • We present the first method which considers the impact
                                        lia and Redfin. They provide information on characteristics            of appearance on real estate price estimation.
                                        such as location, size, age, number of bedrooms, number
                                        of bathrooms as well as interior and exterior photos. Home           • We elicit luxury-related information from real estate
                                        buyers, owners, real estate agents and appraisers all need a           imagery using deep neural networks and crowdsourced
                                        method to determine the market value of houses.                       2 This value refers to the reported error rate at the time we started col-

                                            A core component of real estate websites like Zillow and      lecting data (June 2016). While the latest reported median error rate of Zes-
                                        Redfin is an automated valuation method (AVM) which es-           timate is 5.6% (https://www.zillow.com/zestimate/#acc),
                                                                                                          the same approach as what we describe in the paper can be used to de-
                                           1 The Digital House Hunt: Consumer and Market Trends in Real   crease the error rate.
                                        Estate (https://www.nar.realtor/sites/default/files/                  3 About     the      Redfin     Estimate:           www.redfin.com/
                                        Study-Digital-House-Hunt-2013-01_1.pdf)                           redfin-estimate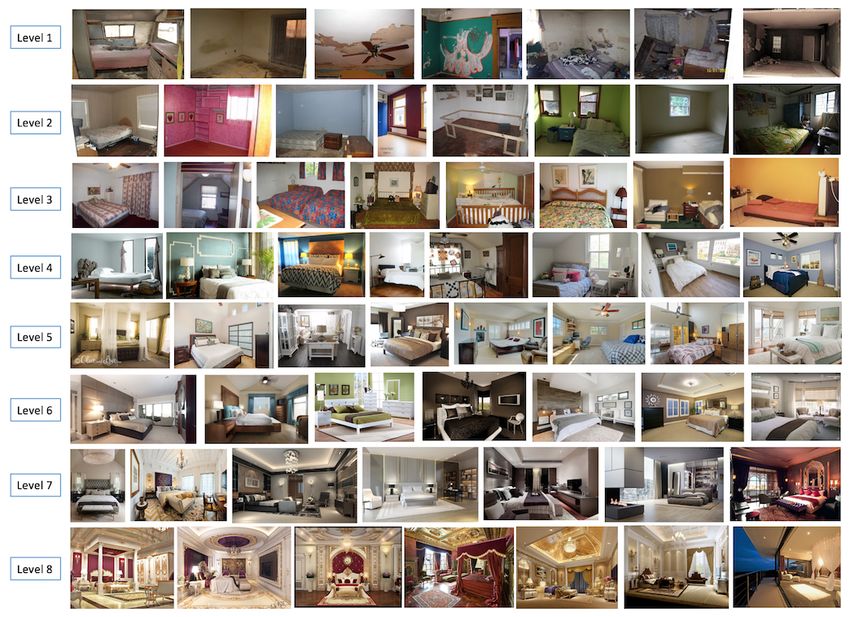
data.                                                         Given the market value and characteristics for a large num-
                                                                   ber of houses, the goal is to obtain a function that relates the
  • We release a new dataset of photos and metadata for            metadata of a house to its value. There are many bodies of
    9k houses obtained from Zillow. By applying our val-           work that apply regression methods to the problem of real
    uation method to this dataset, we show that it outper-         estate price estimation. Linear regression models assume
    forms Zillow’s estimates.                                      that the market value is a weighted sum of home charac-
                                                                   teristics. They are not robust to outliers and cannot address
  • We release a new, large-scale dataset of 140k interior         non-linearity within the data. Another model that is used for
    design photos from Houzz. The images are classi-               price estimation is the hedonic pricing model. It supposes
    fied based on their room types: bathroom, bedroom,             that the relationship between the price and independent vari-
    kitchen, living room, dining room, interior (miscella-         ables is a nonlinear logarithmic relation. The interested
    neous) and exterior.                                           reader is referred to [22], [3] and [18] for an overview of
                                                                   regression analysis for price estimation. Other approaches
  • We present a qualitative visualization of real estate
                                                                   for price estimation include Artificial Neural Networks [19]
    photos in which images at similar luxury levels are
                                                                   and fuzzy logic [1].
    clustered near one another.
                                                                       Zillow and Redfin use their own algorithms for real es-
                                                                   tate price estimation. Home characteristics, such as square
2. Related Work                                                    footage, location or the number of bathrooms are given dif-
   We now provide an overview of related work, with a fo-          ferent weights according to their influence on home sale
cus on automated real estate valuation methods and visual          prices in each specific location over a specific period of
design. We also give a brief overview of machine learning          time, resulting in a set of valuation rules, or models that are
methods and datasets relevant to our approach.                     applied to generate each home’s Zestimate4 . Redfin, hav-
                                                                   ing direct access to Multiple Listing Services (MLSs), the
2.1. Automated Valuation Methods                                   databases that real estate agents use to list properties, pro-
                                                                   vides a more reliable estimation tool5 . While Zillow and
    Real estate price estimation plays a significant role in
                                                                   Redfin do not disclose how they compute their estimates,
several businesses. Home valuation is required for pur-
                                                                   their algorithms are prone to error, and do not consider the
chase and sale, transfer, tax assessment, inheritance or es-
                                                                   impact of property photos on the market value of residential
tate settlement, investment and financing. The goal of au-
                                                                   properties.
tomated valuation methods is to automatically estimate the
market value of a house based on its available information.        2.2. Convolutional Neural Networks (ConvNets)
Based on the definition of the International Valuation Stan-
dards Committee (IVSC), market value is a representation              Convolutional neural networks (ConvNets) have
of value in exchange, or the amount a property would bring         achieved state-of-the-art performance on tasks such
if offered for sale in the open market at the date of valuation.   as image recognition [14, 9, 10, 26], segmentation
A survey of real estate price estimation methods is given in       [17, 5, 29, 31], object detection [7, 6, 25] and generative
[22]. In this section, we give an overview of these meth-          modeling [8, 24, 11, 13, 23] in the last few years. The
ods. To our knowledge, none of these methods consider the          recent surge of interest in ConvNets recently has resulted
impact of visual features on value estimation.                     in new approaches and architectures appearing on arXiv on
    One of the traditional methods for market valuation is the     a weekly basis. The interested reader is referred to [16] for
“comparables” model, a form of k nearest neighbors regres-         a review of ConvNets and deep learning.
sion. In this model, it is assumed that the value of the prop-
                                                                   2.3. Scene Understanding
erty being appraised is closely related to the selling prices of
similar properties within the same area. The appraiser must           One of the hallmark tasks of computer vision is Scene
adjust the selling price of each comparable to account for         Understanding. In scene recognition the goal is to deter-
differences between the subject and the comparable. The            mine the overall scene category by understanding its global
market value of the subject is inferred from the adjusted          properties. The first benchmark for scene classification was
sales prices of the comparables. This approach heavily de-         the Scene15 database [15], which contains only 15 scene
pends on the accuracy and availability of sale transaction         categories with a few hundred images per class. The Places
data [22].                                                         dataset is presented in [32], a scene-centric database con-
    The problem of price estimation can be viewed as a re-           4 What is a Zestimate? Zillow’s Home Value Forecast (http://www.
gression problem in which the dependent variable is the            zillow.com/zestimate/)
market value of a house and independent variables are home           5 About      the   Redfin     Estimate:       www.redfin.com/
characteristics like size, age, number of bedrooms, etc.           redfin-estimate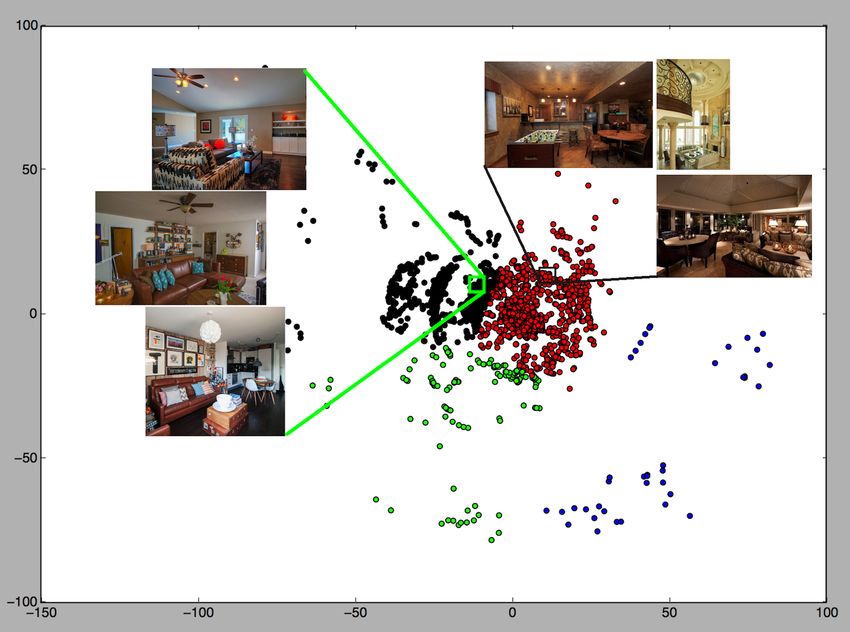
An approach for predicting the style of images is de-
                                                                             scribed in [12]. It defines different types of image styles,
                                                                             and gathers a large-scale dataset of style-annotated photos
                                                                             that encompasses several different aspects of visual style. It
                                                                             also compares different image features for the task of style
                                                                             prediction and shows that features obtained from deep Con-
                                                                             volutional Neural Networks (ConvNets) outperform other
                                                                             features. A visual search algorithm to match in-situ im-
                                                                             ages with iconic product images is presented in [2]. It also
                                                                             provides an embedding that can be used for several visual
                                                                             search tasks including searching for products within a cat-
                                                                             egory, searching across categories, and searching for in-
Figure 1: Examples of correctly and incorrectly classified                   stances of a product in scenes. [4] presents a scalable al-
pictures. The first row illustrates images classified correctly,             gorithm for learning image similarity that captures both se-
and the second row represents wrongly classified photos.                     mantic and visual aspects of image similarity. [21] discov-
                                                                             ers and categorizes learnable visual attributes from a large
taining more than 7 million images from 476 place cate-                      scale collection of images, tags and titles of furniture. A
gories. [30] constructs a new image dataset, named LSUN,                     computational model of the recognition of real world scenes
which contains around one million labeled images for 10                      that bypasses the segmentation and the processing of indi-
scene categories and 20 object categories. Table 1 shows                     vidual objects or regions is proposed in [20]. It is based
relevant categories of LSUN, Places and Houzz datasets                       on a low-dimensional representation of the scene, called the
as well as the number of images in each category. Sev-                       Spatial Envelope. It proposes a set of perceptual dimensions
eral categories in the Places dataset are subsumed under the                 that represent the dominant spatial structure of a scene.
term “Exterior”: “apartment building (outdoor)”, “build-
ing facade”, “chalet”, “doorway (outdoor)”, “house”, “man-                   3. Our Approach
sion”, “manufactured home”, “palace”, “residential neigh-                       In order to quantify the impact of visual characteristics
borhood” and “schoolhouse”. Miscellaneous indoor classes                     on the value of residential properties, we need to encode
such as “stairway” and “entrance hall” are categorized as                    real estate photos based on the value they add to the market
“Interior (misc.)”6 .                                                        price of a house. This value is tightly correlated with the
                                                                             concept of luxury. Luxurious designs increase the value of
Table 1: Number of images per room category in different                     a house, while austere ones decrease it. Hence, we focus on
datasets                                                                     the problem of estimating the luxury level of real estate im-
                                                                             agery and quantifying it in a way that can be used alongside
                              LSUN             Places      Houzz
                                                                             the metadata to predict the price of residential properties.
 Living Room                  1,315,802        28,842      971,512
 Bedroom                      3,033,042        71,033      619,180           3.1. Classifying Photos Based on Room Categories
 Dining Room                  657,571          27,669      435,160
                                                                                 To make a reasonable comparison, we consider photos
 Kitchen/Kitchenette          2,212,277        84,054      1,891,946
                                                                             of each room type (kitchen, bathroom, etc.) separately. In
 Bathroom                     −                27,990      1,173,365
                                                                             other words, we expect that comparing rooms of the same
 Exterior                     −                25,869      868,383
                                                                             type will give us better results than comparing different
 Interior (misc.)             −                20,000      368,293
                                                                             room categories. Hence, we trained a classifier to categorize
                                                                             pictures based on the categories shown in Table 1. In order
2.4. Visual Design                                                           to train the classifier, we used data from Places dataset [32],
                                                                             Houzz and Google image search. Our final dataset contains
   In spite of the importance of visual design and style, they               more than 200k images.
are rarely addressed in the computer vision literature. One                      Using labeled pictures from our dataset, we trained
of the main challenges in assigning a specific style to an                   DenseNet [10] for the task of classifying real estate photos
image is that style is hard to define rigorously, as its inter-              to the following categories: bathroom, bedroom, kitchen,
pretation can vary from person to person. In our work, we                    living room, dining room, interior (miscellaneous) and ex-
are interested in encoding information relevant to the luxury                terior. Using this classifier, we achieved an accuracy of 91%
level of real estate photos.                                                 on the test set. After collecting a large dataset of real estate
   6 While the Houzz dataset contains millions of images in each category,   photos and metadata from Zillow, we applied the classifier
we download and use 20k images in each category.                             to the images to categorize them based on their room type.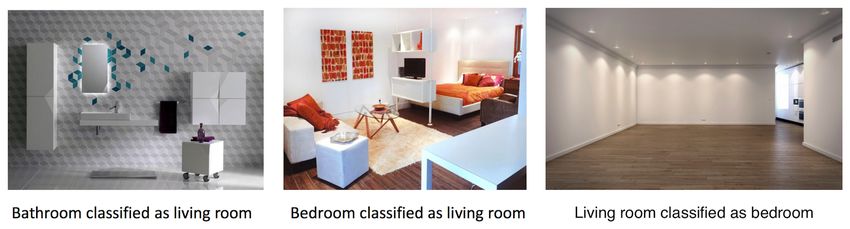
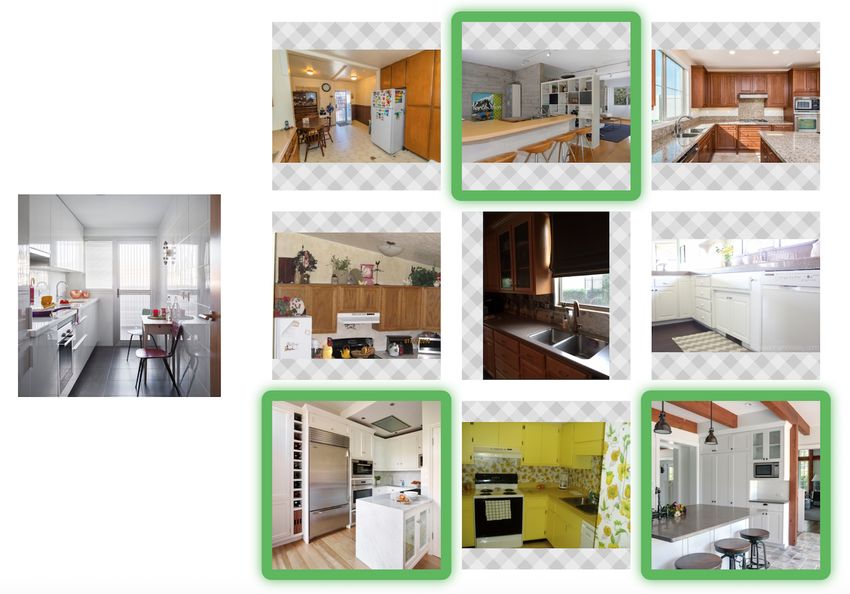
Figure 2: Crowdsourcing user interface for comparing photos based on their luxury level. Each probe image on the left is
compared with 9 other images, uniformly drawn from the dataset. Using these comparisons, we obtain an embedding of real
estate photos based on their luxury level and anchor images which represent different levels of luxury.

Figure 1 shows examples of photos that are classified cor-       the classification framework accordingly. We can also sam-
rectly and incorrectly. As we can observe from this fig-         ple images from each cluster to represent different classes
ure, the classifier performs well for typical photos, while it   in the classification framework.
sometimes wrongly classifies empty rooms and those rooms
which combine elements from different categories.                3.3. Crowdsourcing Framework
                                                                    We first discuss our crowdsourcing framework for com-
3.2. Luxury Level Estimation
                                                                 paring images based on their luxury. Motivated by [28],
   After classifying the images based on their room cate-        we presented a grid user interface to crowd workers, with a
gories, we used crowdsourcing for luxury level estimation.       probe image on the left and 9 gallery images on the right.
Since our goal is to quantify luxury level of photos, we need    We asked the workers to select all images on the right that
to assign a value to each photo to represent its level of lux-   are similar in terms of luxury level to the image on the left.
ury. Hence, we used a classification framework to catego-        In order to extract meaningful comparisons from each grid,
rize photos based on their luxury level. However, since it       we want it to have images from several different luxury lev-
was not clear how many classes should be used and which          els. Therefore, for each grid, we need to select images from
photos should represent each of those classes, we used an-       our dataset uniformly.
other crowdsourcing framework to compare images in our              The images from Houzz have a ‘budget’ label which de-
dataset according to their luxury level. Using these compar-     termines the cost of each design. There are 4 different bud-
isons, we could obtain a low-dimensional embedding of real       get levels, and photos with a higher level represent more
estate photos in which images with the same level of luxury      luxurious designs. Houses from Zillow are labeled with
are clustered near each other. By inspecting the embedding,      their offered price and Zestimates. We expect that houses
we can determine the number of clusters that best represent      with a higher price and Zestimate have more luxurious pho-
variations in luxury, and choose the number of classes for       tos, and vice versa. Hence, to uniformly divide our dataset,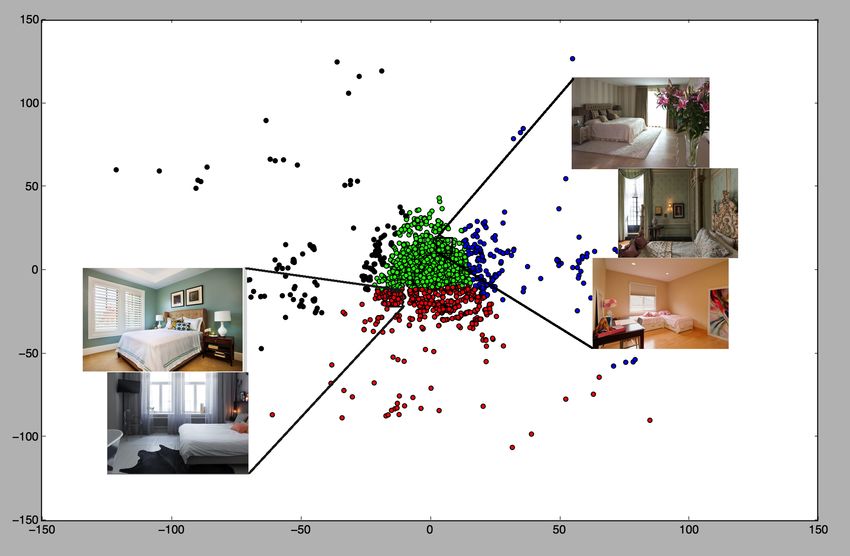
(b) Living room

                      (a) Bathroom

                       (c) Bedroom                                                      (d) Kitchen

Figure 3: 2D embedding visualization of real estate photos based on their luxury using the t-STE algorithm. The embedding
is obtained using 10,000 triplet comparisons. More luxurious photos are clustered at the center and more austere ones are
scattered around.

we divided Zillow houses into 2 classes based on the aver-     different luxury levels to help the crowd workers provide
age value of their offered prices and Zestimates. Moreover,    meaningful comparisons among the pictures. A schematic
to add images with low level of luxury to our dataset, we      of our crowdsourcing user interface is shown in figure 2.
used Google image search. We searched for terms like ‘ugly     We used Amazon Mechanical Turk (AMT) to collect com-
bedroom,’ ‘ugly kitchen,’ etc. In this way, we obtained pho-   parisons on our images.
tos from ugly and spartan designs which generally decrease        Using the crowdsourced data, we obtained triplet com-
the value of a house.                                          parisons based on luxury level for a large-scale dataset of
   In order to create each crowdsourcing grid, we sampled      real estate photos. We then used the t-STE algorithm [27]
two images from each of the 2 classes of Zillow photos, four   to obtain a two-dimensional embedding of the images. The
images from each of the 4 ‘budget’ categories of Houzz pic-    result is shown in figure 3. By examining the embedding,
tures, two photos from the Places dataset, and two photos      we observe that images with similar luxury levels are clus-
from Google search results. Then we selected one random        tered near one another. This indicates the quality of the
picture as the probe and constructed the grid from the other   crowdsourced data. Each cluster represents a specific lux-
9 images. In this way, each grid contains photos of several    ury level. We selected one anchor image from each cluster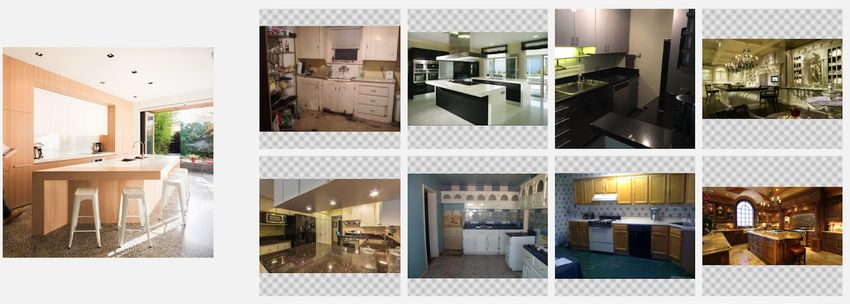
Figure 4: User interface for classifying real estate photos. Each of the 8 levels of luxury is represented with an anchor image,
and the worker is asked to classify the probe image according to its luxury level.

Figure 5: Examples of bedroom photos classified at different luxury levels. Level 1 represents the least level of luxury, and
level 8 shows the highest.

to represent photos in that cluster. Based on these repre-        to rank photos according to their degree of luxury. Fig-
sentative pictures, we created another crowdsourcing task         ure 4 shows this task for kitchen images. Figure 5 illus-
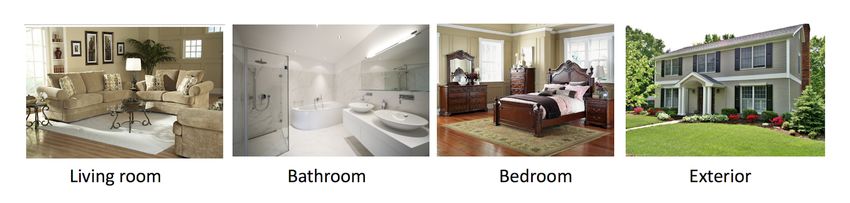
Figure 6: The price estimation network. After classifying photos based on their room category, a vector representing luxury
is extracted and concatenated with the normalized metadata vector and passed through a regression layer to produce the
estimated price. The loss function is then computed as difference between the estimated price and the purchase price.

trates examples of crowdsourcing results. It demonstrates         point of view.
that crowd workers generally performed well at categoriz-             The architecture for the price estimation network is
ing photos based on their degree of luxury. This is due to        shown in figure 6. In order to train the network, we use
the measures, such as tutorial rounds and catch trials, that      the purchase price of recently sold houses as the ground-
we provided to ensure that workers comprehend the task            truth labels. As discussed in [22], the price on which the
and perform it attentively.                                       homeowner and the buyer agree best represents the market
                                                                  value of a house. As shown in the figure, for each house
3.4. Price Estimation Network
                                                                  in the training dataset, we first classify its photos according
    Using the classification framework shown in figure 4, we      to room type. Pictures of each room type are then classi-
obtained luxury levels for a large training set of interior and   fied based on their luxury level. After extracting and nor-
exterior photos. We trained DenseNet [10] for the task of         malizing the metadata vector of each house, we concate-
classifying real estate images based on their luxury level        nate it with the vector that denotes the level of luxury. In
into 8 different categories. Then by using the trained clas-      this way, we obtain a representative vector for each house
sifier, we obtained levels of luxury for rooms of the houses      that captures the impact of its photos and metadata. Then
in the Zillow dataset. For each house we obtained the av-         we use kernel support vector regression (with Radial Ba-
erage level of luxury for each of its room types. In this         sis Function as the kernel) to relate this vector to the actual
way, we obtained 7 values (one for each room type) rep-           value of the house. The input is the representative vector
resenting luxury of each house. For houses with no pho-           of each house and the output is the estimated price of the
tos of a specific room category, we used the average value        house. This price is then compared with the purchase price
of other categories to represent luxury level of that particu-    as the ground-truth. The difference between them repre-
lar room. Then we concatenated the metadata vector with           sents the loss. Using the data from recently sold houses in
the vector representing the average luxury levels of rooms        our dataset, we obtained regression weights so as to mini-
of the house. The metadata vector contains all the infor-         mize the loss function.
mation about home characteristics like offered price, Zes-
timate, size, etc. Since different elements of the metadata       4. Results and Discussion
vector (like offered price, age, number of bedrooms, etc.)
are in different ranges, we first normalized the components.         Using the crowdsourced data, we trained the price esti-
We computed the average value and the standard deviation          mation network depicted in figure 6. Then we used the net-
of each component of the metadata vector for houses in our        work to estimate prices for a separate testing set of recently-
dataset. Then we used z-scoring for normalization: we sub-        sold houses. The error rate is determined by considering
tracted the mean from each component and divided it by            the difference between the price estimated by our network
its standard deviation. In this way, the mean value of each       with the purchase price of houses in the test set. We evalu-
entry of the metadata vector is approximately zero, and the       ated the network’s performance on a testing dataset of 1,000
standard deviation is approximately one. This allows us to        recently-sold houses from Zillow. We compared the esti-
obtain the function relating the market price of a house to       mated price obtained using our network with the purchase
its representative vector more easily from a computational        price to find the error rate. The median error rate of our
network is 5.8 percent which is better than the 7.9 percent     Table 2: Median error rate of automated valuation methods
median error rate of the Zestimate. Results are shown in Ta-
ble 2. Our automated valuation method improves upon that
                                                                                Method                     Median Error Rate
of Zillow by augmenting the input data with images.
                                                                             Zestimate                            7.9%
4.1. Ablation Studies                                                   Ours (Vision-based)                       5.8%
   We provide ablation analysis to evaluate effectiveness of              Only metadata                           8.0%
different parts of the model.                                         Ours – Room Classifier                      6.7%
                                                                         Direct Regression                        6.6%
  • We first consider using only the metadata and discard-
                                                                  Direct Regression + Fine-tuning                 6.4%
    ing visual information. The resulting median error rate
                                                                        Ours + Fine-tuning                        5.6%
    is 8.0%, which is very close to the Zestimate error rate.
    This is expected as Zestimate is included in the meta-
    data. In other words, the regression network almost
    ignores all other elements in metadata except the Zes-      ties. After collecting large datasets of real estate photos
    timate, which is optimized to be an accurate estimation     and metadata, we used a crowdsourcing pipeline to extract
    of the price.                                               luxury-related information from interior and exterior pho-
  • In the next experiment, we remove the room classifier       tos. Based on the data we obtained via crowdsourcing, we
    and train a single luxury level estimator for all rooms.    trained a convolutional neural network to classify photos
    As shown in Table 2, the resulting median error rate is     based on their level of luxury. Using purchase price of re-
    6.7%. The increase in error rate shows the importance       cently sold houses as their actual value, we trained a net-
    of room classification as it helps the model focus on the   work to relate the market value of a house to its photos and
    fine-grained signal relevant to luxury within images of     metadata. We used our algorithm to estimate the price of
    the same room type.                                         houses in our dataset, and we showed that it provides a bet-
                                                                ter value estimation than Zillow’s estimates. Future avenues
  • We consider directly regressing the price. Instead of       of research include assessing the effect of staging on the
    training the network for luxury estimation, we pre-         market value of a house, analyzing the impact of different
    train it on ImageNet. We use features extracted from        furniture styles on the luxury level of real estate imagery,
    the layer before the final classification layer to repre-   developing a user interface to help users select images that
    sent images. We train the regression network on these       add more value to their residential properties, evaluating in-
    features and metadata. The resulting median error rate      terior and exterior design photos from an aesthetic point of
    is 6.6%. If we also fine-tune the feature extraction net-   view, among others.
    work, the error rate would be 6.4%. The decreased
    performance is due to the fact that the amount of data      References
    containing the housing price is limited. This leads to
                                                                 [1] C. Bagnoli and H. Smith. The theory of fuzz logic and its
    features which do not correlate well with the value im-
                                                                     application to real estate valuation. Journal of Real Estate
    ages add to the price of the house. However, we have a
                                                                     Research, 16(2):169–200, 1998.
    larger set of images without housing price values. As
                                                                 [2] S. Bell and K. Bala. Learning visual similarity for product
    mentioned in the previous section, we annotate these             design with convolutional neural networks. ACM Transac-
    images with luxury levels, and use that data to train a          tions on Graphics (TOG), 34(4):98, 2015.
    network for efficient luxury level estimation. This in       [3] J. Benjamin, R. Guttery, and C. Sirmans. Mass appraisal:
    turn helps for the price estimation since luxury is cor-         An introduction to multiple regression analysis for real estate
    related with the additive value of images.                       valuation. Journal of Real Estate Practice and Education,
                                                                     7(1):65–77, 2004.
  • After training each part of the model separately, we
                                                                 [4] G. Chechik, V. Sharma, U. Shalit, and S. Bengio. Large
    fine-tune the whole model end-to-end. This allows bet-           scale online learning of image similarity through ranking.
    ter information flow from the regression model to the            The Journal of Machine Learning Research, 11:1109–1135,
    luxury estimation network. As demonstrated in Table              2010.
    2, this leads to slight improvement (0.2%) in the me-        [5] L.-C. Chen, G. Papandreou, I. Kokkinos, K. Murphy, and
    dian error rate.                                                 A. L. Yuille. Deeplab: Semantic image segmentation with
                                                                     deep convolutional nets, atrous convolution, and fully con-
5. Conclusion                                                        nected crfs. arXiv preprint arXiv:1606.00915, 2016.
                                                                 [6] R. Girshick. Fast r-cnn. In Proceedings of the IEEE inter-
  We have presented a novel algorithm to consider the                national conference on computer vision, pages 1440–1448,
impact of appearance on the value of residential proper-             2015.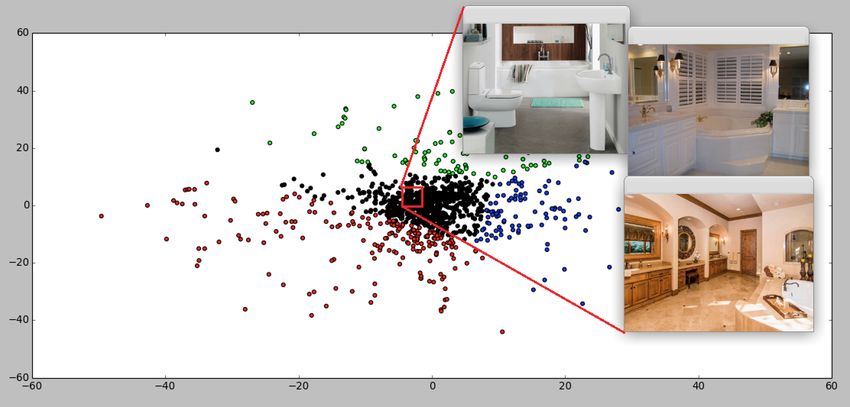
[7] R. Girshick, J. Donahue, T. Darrell, and J. Malik. Rich fea-      [23] O. Poursaeed, I. Katsman, B. Gao, and S. Belongie.
     ture hierarchies for accurate object detection and semantic            Generative adversarial perturbations.       arXiv preprint
     segmentation. In Proceedings of the IEEE conference on                 arXiv:1712.02328, 2017.
     computer vision and pattern recognition, pages 580–587,           [24] A. Radford, L. Metz, and S. Chintala. Unsupervised repre-
     2014.                                                                  sentation learning with deep convolutional generative adver-
 [8] I. Goodfellow, J. Pouget-Abadie, M. Mirza, B. Xu,                      sarial networks. arXiv preprint arXiv:1511.06434, 2015.
     D. Warde-Farley, S. Ozair, A. Courville, and Y. Bengio. Gen-      [25] J. Redmon, S. Divvala, R. Girshick, and A. Farhadi. You
     erative adversarial nets. In Advances in neural information            only look once: Unified, real-time object detection. In Pro-
     processing systems, pages 2672–2680, 2014.                             ceedings of the IEEE conference on computer vision and pat-
 [9] K. He, X. Zhang, S. Ren, and J. Sun. Deep residual learn-              tern recognition, pages 779–788, 2016.
     ing for image recognition. In Proceedings of the IEEE con-        [26] R. K. Srivastava, K. Greff, and J. Schmidhuber. Highway
     ference on computer vision and pattern recognition, pages              networks. arXiv preprint arXiv:1505.00387, 2015.
     770–778, 2016.                                                    [27] L. Van Der Maaten and K. Weinberger. Stochastic triplet
[10] G. Huang, Z. Liu, K. Q. Weinberger, and L. van der Maaten.             embedding. In Machine Learning for Signal Processing
     Densely connected convolutional networks. arXiv preprint               (MLSP), 2012 IEEE International Workshop on, pages 1–6.
     arXiv:1608.06993, 2016.                                                IEEE, 2012.
[11] X. Huang, Y. Li, O. Poursaeed, J. E. Hopcroft, and S. J. Be-      [28] M. J. Wilber, I. S. Kwak, and S. J. Belongie. Cost-effective
     longie. Stacked generative adversarial networks. In CVPR,              hits for relative similarity comparisons. In Second AAAI
     volume 2, page 3, 2017.                                                Conference on Human Computation and Crowdsourcing,
[12] S. Karayev, M. Trentacoste, H. Han, A. Agarwala, T. Darrell,           2014.
     A. Hertzmann, and H. Winnemoeller. Recognizing image
                                                                       [29] F. Yu and V. Koltun. Multi-scale context aggregation by di-
     style. arXiv preprint arXiv:1311.3715, 2013.
                                                                            lated convolutions. arXiv preprint arXiv:1511.07122, 2015.
[13] T. Karras, T. Aila, S. Laine, and J. Lehtinen. Progressive
                                                                       [30] F. Yu, A. Seff, Y. Zhang, S. Song, T. Funkhouser, and
     growing of gans for improved quality, stability, and variation.
                                                                            J. Xiao. Lsun: Construction of a large-scale image dataset
     arXiv preprint arXiv:1710.10196, 2017.
                                                                            using deep learning with humans in the loop. arXiv preprint
[14] A. Krizhevsky, I. Sutskever, and G. E. Hinton. Imagenet
                                                                            arXiv:1506.03365, 2015.
     classification with deep convolutional neural networks. In
                                                                       [31] H. Zhao, J. Shi, X. Qi, X. Wang, and J. Jia. Pyramid scene
     Advances in neural information processing systems, pages
                                                                            parsing network. In IEEE Conf. on Computer Vision and
     1097–1105, 2012.
                                                                            Pattern Recognition (CVPR), pages 2881–2890, 2017.
[15] S. Lazebnik, C. Schmid, and J. Ponce. Beyond bags of
     features: Spatial pyramid matching for recognizing natural        [32] B. Zhou, A. Lapedriza, J. Xiao, A. Torralba, and A. Oliva.
     scene categories. In Computer vision and pattern recogni-              Learning deep features for scene recognition using places
     tion, 2006 IEEE computer society conference on, volume 2,              database. In Advances in neural information processing sys-
     pages 2169–2178. IEEE, 2006.                                           tems, pages 487–495, 2014.
[16] Y. LeCun, Y. Bengio, and G. Hinton. Deep learning. Nature,
     521(7553):436–444, 2015.
[17] J. Long, E. Shelhamer, and T. Darrell. Fully convolutional
     networks for semantic segmentation. In Proceedings of the
     IEEE Conference on Computer Vision and Pattern Recogni-
     tion, pages 3431–3440, 2015.
[18] S. Malpezzi et al. Hedonic pricing models: a selective and
     applied review. Section in Housing Economics and Public
     Policy: Essays in Honor of Duncan Maclennan, 2003.
[19] S. McGreal, A. Adair, D. McBurney, and D. Patterson. Neu-
     ral networks: the prediction of residential values. Journal of
     Property Valuation and Investment, 16(1):57–70, 1998.
[20] A. Oliva and A. Torralba. Modeling the shape of the scene: A
     holistic representation of the spatial envelope. International
     journal of computer vision, 42(3):145–175, 2001.
[21] V. Ordonez, V. Jagadeesh, W. Di, A. Bhardwaj, and R. Pi-
     ramuthu. Furniture-geek: Understanding fine-grained furni-
     ture attributes from freely associated text and tags. In Ap-
     plications of Computer Vision (WACV), 2014 IEEE Winter
     Conference on, pages 317–324. IEEE, 2014.
[22] E. Pagourtzi, V. Assimakopoulos, T. Hatzichristos, and
     N. French. Real estate appraisal: a review of valuation meth-
     ods. Journal of Property Investment & Finance, 21(4):383–
     401, 2003.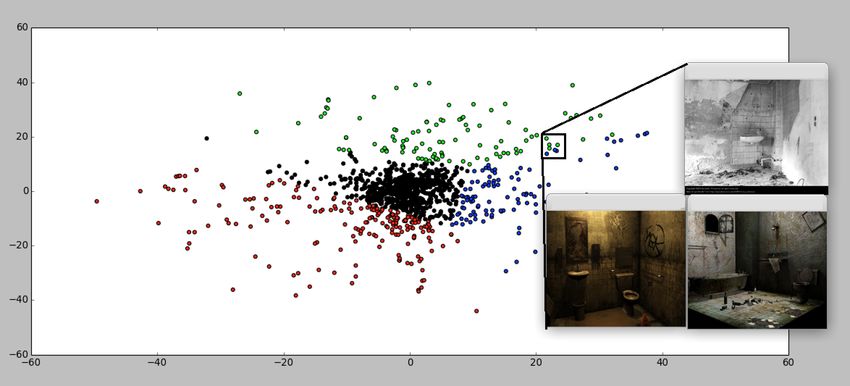
You can also read


