Stock Price Relation to News-Based Health Scores - Manzama
←
→
Page content transcription
If your browser does not render page correctly, please read the page content below
Stock Price Relation to News-Based Health Scores

                                           By Nico Nuñez, Andrew Duchon, and Phil Duong at Manzama, Inc.

          Introduction
          The objective of this report is to determine whether there is a correlation between a company’s corporate stock price
          and their news-based Manzama Insights Health Score (MIHS). In other words, the goal is to ascertain whether there is
          a quantitative relationship between (A) the collective behavior of investors when choosing to buy, sell or hold stock,
          as measured by stock price movements, and (B) the collective behavior of news editors when choosing whether or not
          to publish a corporate news event, as measured by the MIHS. By conceiving these two wisdom-of-crowds metrics as
          valuation estimates, we intend to provide a more holistic understanding of a company’s health.

          The relationship between new information and stock price movements has been extensively researched by behavioral
          psychologists, accounting researchers, financial mathematicians and financial economists. Although the interaction
          between investor behavior and price fluctuations has been modeled since the early 20th century (Bachelier, 1900),
          the Efficient Market Hypothesis (EMH) is often considered the starting point of the theoretical framework underlying
          market reactions to news (Mizuno, 2017). A main exponent of the EMH was the Nobel prize winner Friedrich August
          Hayek, who described the efficiency of markets in his 1945 essay “The Use of Knowledge in Society”. By comparing
          price movements to “a system of telecommunications which enables individuals to watch... merely the hands of a few
          dials in order to adjust their activities” (Hayek, 1945), Hayek applauds the time efficiency of market responses to new
          information, and the information efficiency of market price as a summary of all information. The EMH considers that
          stock prices incorporate new information as soon as it is available, and that price movements reliably summarize the
          information available to all market participants (Kuepper, 2019; Chen, 2019).

          The Efficient Market Hypothesis has faced intense yet sensible criticism, particularly by Daniel Kahneman and Amos
          Tversky’s Prospect Theory challenging human rationality1 and Benoit Mandelbrot’s Chaos Theory challenging market
          stability2. However, the fundamental notion that new information influences stock prices, albeit inefficiently, has not
          lost support (Mizuno, 2017). On the contrary, the availability of massive datasets and new algorithmic approaches like
          Word Embeddings, Support Vector Regression and Deep Learning have allowed researchers to experimentally capture
          the interaction between news and stock price changes, yielding significant results (Liu, 2018; Shah, 2018; Schumaker,
          2018; Mizuno, 2017; Li, 2014; Gidofalvi, 2001). Several researchers reported above 54% directional accuracy on stock
          price predictions, and some detected significant correlations approximately 20 minutes before and 20 minutes after
          relevant news was released. Most research obtained numerical signals from news by relying on financial dictionaries3 or
          the stock price itself to arduously train deep networks. The Manzama Insights Health Score, on the other hand, uses tens
          of thousands of manually labeled articles to train a neural network to discriminate between positive, negative and neutral
          corporate events.

          The algorithm to compute the MIHS operates as follows (Chart A): First, we gather all articles that mention a company
          name, product or CEO in the headline. Second, we preprocess each headline by making all words lower-case, removing
          uninformative and misleading words, and tokenizing remaining words. Third, we input each headline through a Long-
          Short Term Memory (LSTM) Neural Network with attentional and fully connected layers, which in turn outputs two
          pieces of information — the Category and the Valence — for each headline4. The Category takes one of twenty-five
          possible values, where each Category is a member of one of six Factors. For instance, the Financials Factor is made up of
          four Categories: Stock News, Analyst, Bankruptcy and Financials. The Operations Factor is made up of five Categories:
          Attacks & Disasters, Cyber Issues, Expansions & Contractions, Labor, and Supply Chain. The other four Factors are
          Management, which refers to news about executives and shareholders; Government, which takes into account political

          1 See Kahneman and Tversky’s 1979 paper “Prospect Theory: An Analysis of Decision under Risk”.
          2 See Mandelbrot’s 2004 book “The Misbehavior of Markets” or Nassim Nicholas Taleb’s 2010 book “The Black Swan: the Impact of the
            Highly Improbable”.
          3 Dictionary methods consist of assigning a fixed score of +1 or -1 to specific words like “buy” or “sell”, irrespective of the context.
          4 Manzama has an evolving set of Category-Valence Guidelines for analysts to use to classify headlines which are then used as a
            teaching signal.

US & CAN: +1 (541) 306 3271 | UK: +44 (0)203 282 1633 | AUS: +61 02 8417 2339 | Email: sales@manzama.com | Web: www.manzama.com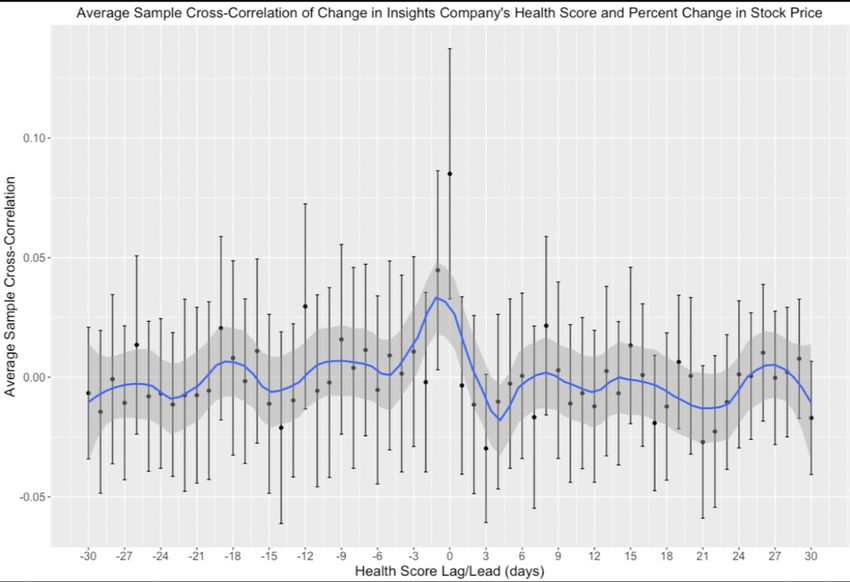
issues and regulatory news; Products & Services, which includes product
          news and customer reactions; and lastly, Partners & Competitors,                                              Headline
          which includes merger and acquisition activity and dealings with other
          companies. The Valence can be one of three possible values: Positive,
          Negative or Neutral--- depending on whether the corporate event is good,
          bad or neither good nor bad for the company mentioned in the headline.                                   Preprocessing
          The teaching signal for the network is a single Category-Valence pair.

          Once all headlines have a Factor and a Valence, the next step in the
          algorithm is to group all headlines by Factor and feed these Valences
          into a function. The function assigns a score of +10 to a positive valence                                LSTM +
          headline, a -10 to a negative valence headline and a 0 to a neutral valence                          Attentional Layer +
          headline5, and in turn computes the aggregate score for each Factor:                                MLP Neural Network
          six numbers between -10 and +10. These aggregates are the Manzama
          Insights Factor Health Scores (FHS’s). The headlines classified under all
          six Factors are then aggregated into the overall Manzama Insights Health
          Score (MIHS) by using the same function. Although this aggregation
          function weighs all headlines equally, resyndication and similar headlines
          are classified similarly, and therefore combine to have an additive impact
          on the Health Scores. In other words, the quantity of repeated and
          similar headlines, which theoretically represents news editors’ perceived                            Category            Valence
          importance of that corporate event, is proportional to the impact of those
          headlines on the Health Scores.
                                                                                                                     Aggregate
          It is especially interesting to relate the MIHS to the stock price because
                                                                                                                      30 Days
          they are both wisdom-of-crowds proxies for the perceived value of a
          company, albeit according to different crowds: the former algorithmically
          combines the perspectives of the news editor crowd about a company

                                                                                                                          fx
          and distills them into one number (the Health Score), while the latter uses
          the “invisible hand”6 of supply and demand to combine the actions of the
          investor crowd and distills them into one number (the stock price). The
          differences in the way these values come to exist, however, makes the                                     Aggregation
          comparison even more compelling. According to the wisdom of crowds                                         Function
          theory, four conditions characterize wise crowds: diversity of opinion
          (different interpretations of the same information), decentralization
          (specialization and local knowledge), aggregation (a mechanism that
          turns private judgments into a collective judgment), and independence                                    -6         -3        +5
          (opinions are not determined by others’ opinions) (Surowiecki, 2004).
          While the stock market is characterized as having diversity of opinion,                                  +1         -1        -4
          decentralization and an aggregation method built in via the mechanisms
          of the “invisible hand”, there is no self-organizational equivalent for
          the News Industry. Manzama incorporates diversity of opinion and
          decentralization by extracting information from tens of thousands of
          online sources from different geographic locations and political inclinations
          and uses a mathematical aggregation function to convert the multiplicity
          of headlines into one statistic. In the present report, we intend to                                              -5
                                                                                                                         HEALTH SCORE
          determine whether the aggregate decisions of news editors are correlated
          with the aggregate decisions of investors, and ultimately, find evidence for                       Chart A. Manzama Insights
          a relationship between two distinct wisdom-of-crowds metrics: the news-                            Health Score Computation
          based Manzama Insights Health Score and the corporate stock price.

          5 This mapping of valence to scores is valid when the article volume for a Company or a Factor is above 100 articles in 30 days.
          6 The “marvelous” self-regularization of market forces to reach equilibrium is dubbed “the invisible hand”.

US & CAN: +1 (541) 306 3271 | UK: +44 (0)203 282 1633 | AUS: +61 02 8417 2339 | Email: sales@manzama.com | Web: www.manzama.com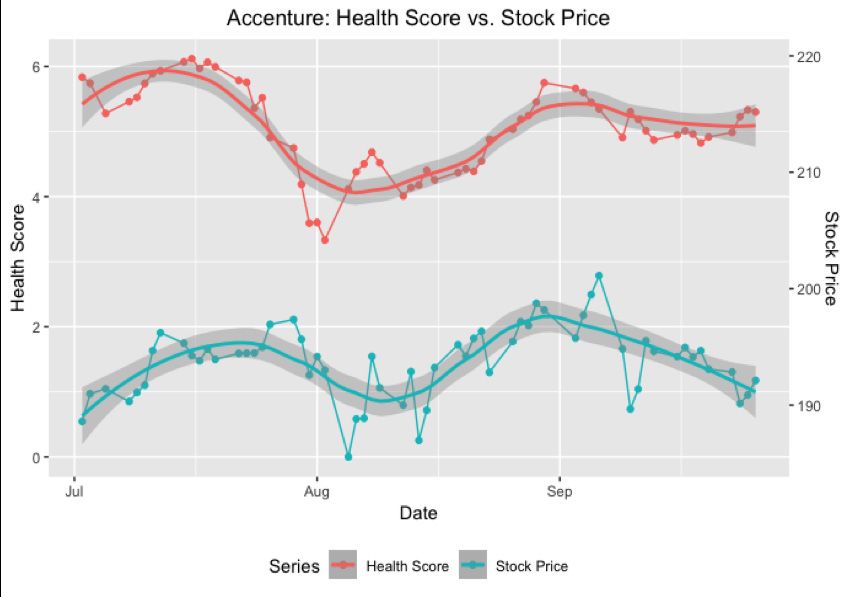
Data
          We selected the 99 companies with the largest headline volume from Manzama’s company database (Appendix I). We
          extracted 90 days’ worth of FHS’s and MIHS’s from Manzama’s database for the companies listed in Appendix I. Then,
          we obtained the 62 stock closing prices between June 30th, 2019 and September 26th, 2019 from Yahoo Finance.

          We standardized the stock prices by computing the percent change in the closing price since the last trading day, and
          standardized MIHS and FHS using the absolute change in value since the last trading day. This resulted in 61 unique data
          points for each health score per company, or 42,273 health score representations from an aggregate count of 173,327
          headlines and 6,039 stock price representations.

          Methods
          An understanding of lags, leads and correlations is necessary to comprehend the analysis. Consider the following 4
          arbitrary variables: X which takes on values [1, 6, 2, 8, 3] on January 1 through January 5; W, defined as the one-day lag
          of X, which constitutes all of the values of X the day before; Z, defined as the one-day lead of X, which constitutes the
          value of X the day after; and Y which takes on the values [14, 20, 10, 17, 14] during those same 5 days. Notice that the
          value of X on January 2nd corresponds to the value of W on January 3rd, and the value of Z on January 1st.

          Table 1.
                               January 1st       January 2nd        January 3rd       January 4th       January 5th          Mean
           W (lag one of X)       NA   -            1   ↓             6   ↑              2   ↓            8    ↑             4.25
           X                      1    ↓            6   ↑             2   ↓              8   ↑             3   ↓               4
           Z (lead one of X)      6    ↑            2   ↓             8   ↑              3   ↓            NA    -            4.75
           Y                      14 ↓              20 ↑              10 ↓               17 ↑              14 ↓               15

          The arrow next to each number represents the position of the variable with respect to its mean. The arrow is important,
          because the correlation between X and Y is a measure that quantifies how synchronized X and Y are with respect to their means.
          If the correlation is 1, it means that X and Y move up and down with respect to their means in complete synchrony; if the
          correlation is -1, it means X moves above (or below) its mean and Y moves below (or above) its mean in synchrony. If the
          correlation is 0, it means that there is no relationship between the movement of X and Y about their means. The correlation
          of X and Y comes down to 0.73, which makes sense because the arrows are pointing in the same direction on all 5 days.
          However, the correlation of W and Y is -0.78 and that of Z and Y is -0.98, because the arrows are pointing in different
          directions on each day. While the correlation quantifies the synchrony of X and Y moving about their means, the cross-
          correlation computes the synchrony of X and Y for various different lags and leads of X with respect to their means.

          The methodology I used to compare the corporate stock price with the MIHS was to compute the cross-correlation
          between the percent change in the stock price with the absolute change in the MIHS, resulting in one correlation
          estimate per company per lag/lead. I consequently computed the average cross-correlation and the standard deviation of
          the cross-correlation at each lag/lead.

          Results
          Chart B presents the average cross-correlation at each lag/lead, with error bars representing 3 standard deviations of
          the mean (99.6% confidence level; p-value = 0.004). On the x-axis is the lag/lead in days with respect to the stock price.
          On the y-axis is the average cross-correlation for the sample of 99 companies. Consider the leftmost point in the chart
          located at coordinates (-30, -0.006). This means that the percent change in the stock price has an average correlation
          of -0.006 with respect to the change in the MIHS thirty days before. Since the error bars for the correlation estimate
          cross 0, there is not enough evidence to support the claim that the percent change in the stock price and the change in
          the health score thirty days before are correlated. In fact, the only error bars that do not cross 0 are at a lag of 1 and at
          a lag of 0. This constitutes the first finding of the report: on average, the percent change in the stock price has a positive
          correlation with the absolute change of the Health Score the day before and on the same day. More specifically, the
          correlation point estimate at a lag of 1 was 0.045 ± 0.042, and the point estimate at a lag of 0 was 0.085 ± 0.052.

US & CAN: +1 (541) 306 3271 | UK: +44 (0)203 282 1633 | AUS: +61 02 8417 2339 | Email: sales@manzama.com | Web: www.manzama.com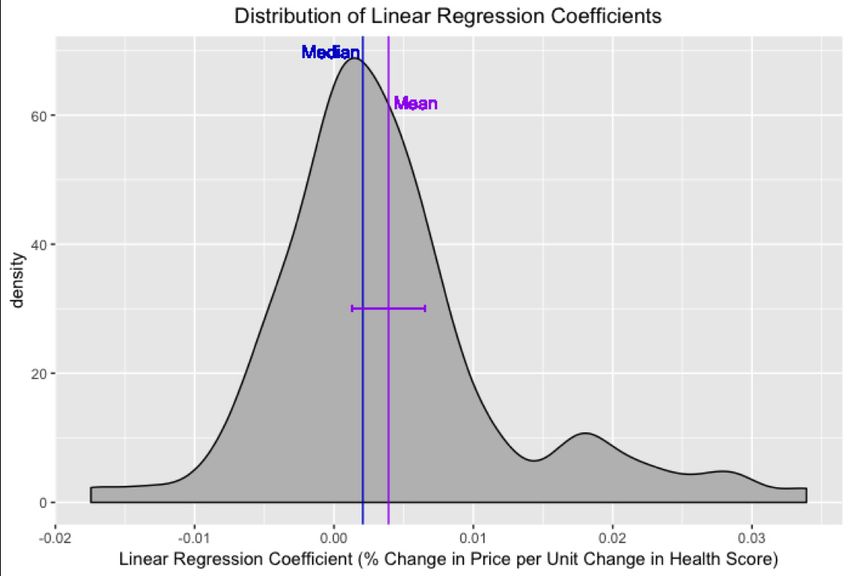
Chart B. Average Cross-Correlations of Change in MIHS and Percent Change in Stock Price
In addition to computing cross-correlations for the company health score overall, we also computed cross-correlations
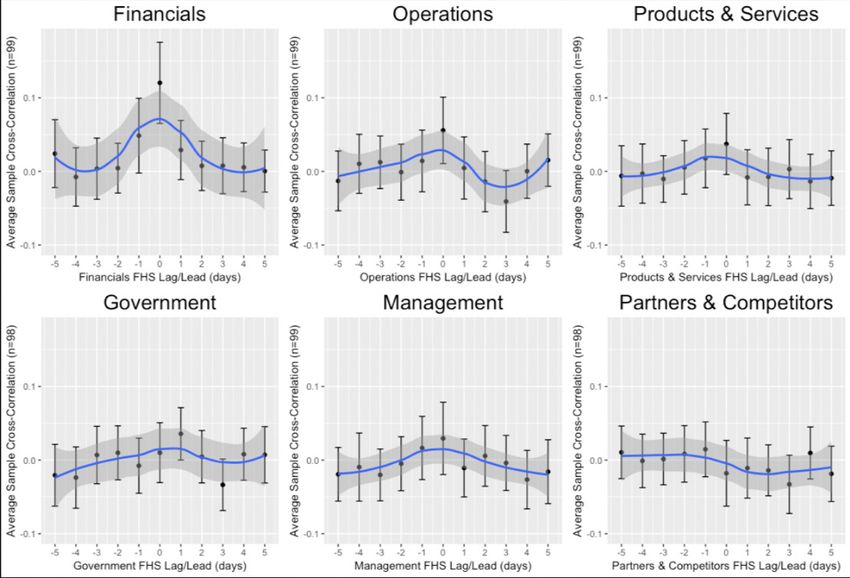
for all 6 Factors. The cross-correlations for these 6 Factors are presented in Chart C.
The second finding of the report is that three FHS’s stand out as having statistically significant (p-value = 0.01) positive
correlations on the same day as the stock price change: (1) Financials (0.120 ± 0.055); (2) Operations (0.056 ± 0.045);
(3) Products & Services (0.037 ± 0.041). One interpretation of this finding is that when headlines about earnings,
expansions into new markets or product releases are printed by news editors, there are corresponding responses by
investors. Conversely, another interpretation is that stock price movements impact news editors’ decisions on what to
publish, since news editors retroactively publish headlines about stock price changes, categorized under Financials. Also,
stock price movements could cause companies to make decisions regarding their Products or Operations, consequently
generating news on these fronts.
The third finding of the report is that there is a significant relationship between stock price and the Financials Health
Score the day before, namely, a positive correlation significant at a 99.4% confidence level (p-value = 0.006), with a point
estimate of 0.048 ± 0.051. This implies that, on average, the Financials Health Score weakly leads the stock price by one
day. This correlation could be caused by the fact that the Stock Exchange closes at 4PM ET, 4 hours before 24:00 GMT,
which is the end of the day for Health Scores. Therefore, new articles could impact the Health Scores during those 4
hours, which would be interpreted as occurring the day before. An alternative interpretation is that news published the
day before about Analysts’ opinions about what will occur, or specific news about funds buying or selling assets might
trigger stock prices to rise or fall.
US & CAN: +1 (541) 306 3271 | UK: +44 (0)203 282 1633 | AUS: +61 02 8417 2339 | Email: sales@manzama.com | Web: www.manzama.comChart C. Average Cross-Correlations of Change in 6FHS’s and Percent Change in Stock Price
The fourth finding is that there are significant relationships between stock prices and Factor Health Scores the day
after. Specifically, stock price is positively correlated with the Financials health score the day after, significant at a
96.6% confidence level (p-value = 0.04), and also positively correlated with the Government health score the day after,
significant at a 99.8% confidence level (p-value = 0.002). One possible interpretation for the positive correlation with
Financials is the effect of delayed or reprinted stock news. With regard to the correlation with the Government score,
a reasonable explanation would be that investors find out about regulatory actions or government involvement before
news editors print their headlines.
The fifth finding of the report is that there is a significant anti-correlation between the stock price and some Factor
Health Scores three days after. Specifically, the Operations score three days after has a point estimate of -0.041 ±
0.042, and Government score three days after has a point estimate of -0.034 ± 0.035. A possible interpretation for this
correlation is that health changes caused by Operations or Government news tend to revert after 3 days.
Limitations
This report has limitations that must be recognized. The Manzama Insights Health Score is generated from the output of
a Neural Network Classifier that has a Valence accuracy of 83%, and Factor accuracy of 90%. For this reason, the Health
Scores could be off by 15% or more, depending on the rarity of the headlines’ syntax or word choice. Another limitation
of this study is that we used the Pearson correlation statistic to relate stock prices and Health Scores, which is sensitive
to outliers because of its reliance on the average percent change in stock price for each company. Since financial
statistics tend to have heavy-tailed distributions, their average can be unstable, and therefore, the correlation coefficient
can also be unstable (Mandelbrot, 1997). In future research, we could use median-based correlation coefficients to
increase estimator stability.
US & CAN: +1 (541) 306 3271 | UK: +44 (0)203 282 1633 | AUS: +61 02 8417 2339 | Email: sales@manzama.com | Web: www.manzama.comThere are some limitations to the stock price and the Manzama Insights Health Score from a wisdom-of-crowds theory
perspective. From the four properties that characterize wise crowds --- diversity of opinion, decentralization, aggregation,
and independence --- market investors are most frequently criticized for their lack of independence. The decisions of
investors on whether to buy, sell and hold are influenced by the decisions of other investors during the same time, causing
bubbles (Surowiecki, 2004). The same could be true for the decisions of news editors, which would cause the quantity of
reprinted headlines to rise without a proportional increase in the importance of the information contained in the headlines,
resulting in the equivalent of a bubble in Health Scores. While stock prices automatically integrate the other characteristics
through market forces, the MIHS incorporates these characteristics programmatically and algorithmically. Our aggregation
function additively combines all headline scores, meaning that “minority” news editors’ points of view on an event, which
tend to have few headline occurrences, have a smaller impact on the Health Score than the headlines coming from
“mainstream” news organizations, which are well-connected and take advantage of resyndication. Although this ensures that
the majority’s vote wins, we risk presenting a statistic that does not represent the opinions of the news editor crowd overall.
Another limitation is that our aggregation function utilizes a 30-day window of headline news to compute the Health
Scores, after which the headlines are omitted from the calculation. The effect of this algorithmic design choice can
be appreciated by looking at the negative average correlation of stock prices and Health Scores at a lead of 21 and 22
days (the approximate number of trading days in a 30-day interval) in Chart B. Although this makes Health Scores
more interpretable, it adds noise to the impact of novel headlines on the Health Scores. For this same reason, the
absolute change in the Health Score, the variable selected to compute correlations against stock prices, is a function
of the difference between the impact of headlines today and the impact of headlines exactly 30 days ago. This implies that a
company that gets 60 new negative headlines and 40 new positive headlines every day will have an MIHS fixed at -2,
even though the 60 new negative headlines today could have been more important than the 60 old negative headlines
printed 30 days ago that are now being forgotten. Despite all of these limitations and the fact that the algorithmic design
choices for the Health Score computations were not intended to converse well with stock prices, correlations were
found, generating exciting prospects for future research directions.
Conclusion
The objective of finding a correlation between the changes in stock prices and the changes in Manzama Insights Health
Scores was fulfilled. Specifically, the change in the company Health Score overall is positively correlated to the changes
in stock prices, primarily due to three Factors: Financials, Operations, and Products and Services. The implication of this
finding is that the decisions of news editors and those of investors are interrelated: new information injected into the
market results in coordinated responses by news editors and investors alike. However, the most important finding of
this report is the evidence of a correlation beyond a short time window of 20 minutes before and after news releases.
Specifically, we discovered that, on average, the Operations FHS is positively correlated with stock price on the same day
and the Government FHS a day later, but both FHS’s are negatively correlated three days later. Due to the fact that stock
price changes and Health Score changes are correlated but are not numerically or deterministically related, they can be
used in conjunction to verify their signals and to ultimately provide a more holistic assessment of a company’s health.
Several interesting research questions emerge from this report. First, what sort of algorithmic design choices and data
transformation choices should be adopted to strengthen the signal between news headlines and stock prices? Regarding
algorithmic design choices: (1) the 30-day aggregation time interval could be shrunk to better match the stock price time
scale; (2) the Health Score formula could be tweaked to deliver a signal that is more dependent on new information than
old information; (3) we could adopt correlation metrics that are robust against outliers. Regarding Health Score data choices,
instead of using 6 FHS’s, we could use Manzama’s 25 Category Health Scores (CHS’s) to provide more topic granularity
and to pinpoint the types of articles that are correlated with investors’ decisions. Regarding stock data choices, instead of
using the percent change of closing price, we could use the Sharpe Ratio to standardize the volatility of each stock and the
increase in the index price. Another question left unanswered by this report is whether there are some company profiles for
which the correlations are more reliable. We could group companies into industries, or we could group companies according
to their predominant Factor, and then conduct statistical tests on correlation quality and stability.
A broader question we ask ourselves is what metrics besides stock prices could we analyze to validate Manzama Insights
Health Scores’ relation to the health of a company? Identifying and compiling various correlated corporate health metrics,
extracted from different data forms and originating from different crowds, could be an important first step in modernizing
Hayek’s metaphor of a time-efficient and information-efficient “system of telecommunications” about corporate health
and the economy overall.
US & CAN: +1 (541) 306 3271 | UK: +44 (0)203 282 1633 | AUS: +61 02 8417 2339 | Email: sales@manzama.com | Web: www.manzama.comAcknowledgments
We would like to thank Vitor Leongue, Kyle Jarrett, and Brigham Rockwell for offering feedback on the written content of
this report.
References
Bachelier, Louis (1900). “Theory of Speculation.” Annales scientifiques de l’Ecole Normale Supérieure, Ser. 3, 17, p. 21-86.
Chen, James (2019). “Announcement Effect.” Investopedia, Investopedia, www.investopedia.com/terms/a/announcment-effect.asp
Gidófalvi, Győző (2001). “Using News Articles to Predict Stock Price Movements.”
Hayek, Friedrich August (1945). “Use of Knowledge in Society.” https://www.econlib.org/library/Essays/hykKnw.html
Kuepper, Justin (2019). “Efficient Market Hypothesis (EMH) Definition.” Investopedia, Investopedia, www.investopedia.
com/terms/e/efficientmarkethypothesis.asp.
Li, Qing et al. (2014). “The impact of financial news and public mood on stock movements.”
Liu, Yang & Zeng, Qingguo & Yang, Huanrui & Carrio, Adrian. (2018). Stock Price Movement Prediction from Financial
News with Deep Learning and Knowledge Graph Embedding: 15th Pacific Rim Knowledge Acquisition Workshop, PKAW
2018, Nanjing, China, August 28-29, 2018, Proceedings. 10.1007/978-3-319-97289-3_8.
Mandelbrot B.B. (1997) The variation of certain speculative prices. In: Fractals and Scaling in Finance. Springer, New York, NY
Mizuno, T., T. Ohnishi and T. Watanabe (2017). ‘Novel and topical business news and their impact on stock market
activity’. EPJ Data Science 6(1), 1-3.
Schumaker, Robert P. and Maida, Nick (2018) “Analysis of Stock Price Movement Following Financial News Article Release,”
Communications of the IIMA: Vol. 16 : Iss. 1 , Article 1. Available at: https://scholarworks.lib.csusb.edu/ciima/vol16/iss1/1
Shah, Dev et al. (2018). “Predicting the Effects of News Sentiments on the Stock Market.” 2018 IEEE International
Conference on Big Data (Big Data): 4705-4708.
Surowiecki, J. (2004). The wisdom of crowds: Why the many are smarter than the few and how collective wisdom shapes
business, economies, societies, and nations. New York, NY, US: Doubleday & Co.
US & CAN: +1 (541) 306 3271 | UK: +44 (0)203 282 1633 | AUS: +61 02 8417 2339 | Email: sales@manzama.com | Web: www.manzama.comAppendices
Appendix I: Companies
Company Name Stock Articles Company Name Stock Articles Company Name Stock Articles
1 Apple AAPL 11220 42 Merck MRK 1308 83 Nokia NOK 716
2 Facebook FB 9734 43 Viacom Inc. VIAB 1305 84 Coca-Cola KO 703
3 Amazon.com AMZN 7977 44 IBM IBM 1287 85 NextEra Energy, Inc. NEE 668
4 Google GOOG 7151 45 PG&E Corporation PCG 1258 86 Dominion Energy, Inc. D 668
5 Boeing BA 6138 46 Chevron CVX 1256 87 Best Buy BBY 632
6 The Walt Disney Company DIS 5717 47 Lockheed Martin LMT 1245 88 Motorola Solutions, Inc. MSI 631
7 General Motors GM 4609 48 CBS Corporation CBS 1237 89 Philip Morris International PM 621
8 Microsoft MSFT 4566 49 Oracle ORCL 1193 90 General Mills, Inc. GIS 613
9 Walmart WMT 4378 50 Home Depot HD 1181 91 Dell DELL 599
10 Netflix NFLX 3456 51 Amgen AMGN 1148 92 The Williams Companies Inc WMB 592
11 Tesla Motors TSLA 3306 52 Accenture ACN 1141 93 Novartis NVS 591
12 AT&T T 3156 53 Pepsico, Inc. PEP 1138 94 Credit Suisse Group CS 581
13 Ford Motor Company F 2512 54 3M MMM 1108 95 Tyson Foods, Inc. TSN 580
14 Nike NKE 2464 55 Marriott International MAR 1101 96 Humana HUM 531
15 Deutsche Bank DB 2285 56 Broadcom Limited AVGO 1052 97 Lloyds Banking Group LYG 512
16 General Electric GE 2282 57 United Parcel Service UPS 1028 98 Dollar General Corporation DG 483
17 Capital One COF 2257 58 Hilton Worldwide Holdings Inc. HLT 1016 99 Gamestop Corp. GME 373
18 Starbucks SBUX 2174 59 Kraft Heinz Mondelez KHC 981
19 JP Morgan Chase JPM 2171 60 Costco Wholesale Corporation COST 978
20 Intel INTC 2133 61 EBay EBAY 968
21 American Airlines AAL 2086 62 Gilead Sciences, Inc. GILD 960
22 BlackRock BLK 1842 63 Raytheon RTN 953
23 Pfizer PFE 1804 64 Medtronic MDT 952
24 FedEx FDX 1799 65 Allergan AGN 919
25 Cisco Systems CSCO 1712 66 Honeywell International HON 899
26 Qualcomm QCOM 1700 67 Adobe Systems ADBE 880
27 Comcast CMCSA 1679 68 American Express Company AXP 848
28 Wells Fargo WFC 1671 69 Brookfield Asset Management Inc BAM 830
29 Verizon VZ 1637 70 The Kroger Co KR 827
30 Bank of America Merrill Lynch BAC 1633 71 Altria Group MO 799
31 Johnson & Johnson JNJ 1600 72 Target TGT 798
32 Goldman Sachs GS 1511 73 Prudential Financial PRU 790
33 Citigroup C 1476 74 Eli Lilly LLY 785
34 McDonald's Corporation MCD 1449 75 Nvidia Corporation NVDA 771
35 Delta Air Lines DAL 1446 76 BHP BHP 759
36 Exxon Mobil XOM 1440 77 GlaxoSmithKline GSK 757
37 Mastercard Incorporated MA 1418 78 Enbridge Inc ENB 753
38 BP BP 1408 79 Bristol-Myers Squibb BMY 749
39 Visa Inc. V 1393 80 Union Pacific Corporation UNP 740
40 The Procter & Gamble Company PG 1364 81 Moody's Corporation MCO 733
41 Advanced Micro Devices AMD 1329 82 Hewlett-Packard HPQ 719
US & CAN: +1 (541) 306 3271 | UK: +44 (0)203 282 1633 | AUS: +61 02 8417 2339 | Email: sales@manzama.com | Web: www.manzama.comAppendix II: Coefficient Analysis
Another way of interpreting the correlation statistics presented in Charts B and C is as the square root of the coefficient
of determination, or R squared value, of a linear regression. Therefore, I computed linear regressions with the percent
change in the stock price as y-variable and the change in the Health Score on the same day as the x-variable for all 99
companies. Although the linear fits are nowhere close to being predictive, the overall linear trend is still meaningful.
The average coefficient is 0.39%, while the median coefficient is 0.21%. The same analysis was conducted with the MIHS
the day before, and the average coefficient was positive with a 99.3% confidence level, with a point estimate of 0.17%,
and a median coefficient of 0.18%. This means that, on average, a unit change in the Health Score roughly corresponds
to a 0.39% change in the stock price on the same day, and a unit change in the Health Score corresponds to a 0.17%
change in the stock price the day after.
It is important to highlight that the linear regression coefficients aggregated into the above distribution were not statistically
significant. Therefore, the purpose of this coefficient analysis is to aid in the comprehension of the correlation analysis.
US & CAN: +1 (541) 306 3271 | UK: +44 (0)203 282 1633 | AUS: +61 02 8417 2339 | Email: sales@manzama.com | Web: www.manzama.comAppendix III: Accenture
To make these findings more concrete, let’s look at the stock price and the MIHS for Accenture, the leading professional
services company headquartered in Ireland. By looking at the trend lines superimposed on both series, we can observe a
possible relation between the stock price and the Manzama Insights Health Score. This relationship can be explained by
diving into Manzama’s raw inputs: news article headlines.
The first peak was prompted by a news release on July 11th, stating that Accenture had appointed Julie Sweet as their
new global chief executive, causing an increase of the stock price and an increase of the Management component of the
company’s MIHS. Subsequently, on July 24th, Manzama picked up on articles stating that Douglas Lane & Associates
LLC, Patten Group, and other investment firms were selling Accenture stock, causing a dip in the Financials component
of their Health Score. Then, on August 5th, two big stories caused Accenture’s Partners & Competitors Health Score to
jump: (1) “Accenture Named A Leader in Next-Generation IT Infrastructure Services for Banking, Financial Services, and
Insurance by Everest Group”; (2) “Accenture Acquires Northstream, Stockholm-Based Consultancy to Communications
Service Providers”. Throughout August and September, Accenture’s health score was bolstered by additional acquisitions
news: on August 12th, they acquired the Design and Innovation firm INSTITUM; on August 15th, Analytics and Data firm
Analytics8; on August 19th, the Financial Services company Parker Fitzgerald; on August 28th, the Engineering Services
company Fairway Technologies, and on September 10th, the Artificial Intelligence and Big Data company Pragsis Bidoop.
In September, Accenture maintained a very healthy score of +6 by: (1) hiring the Cyber Executive Aaron Faulkner and
partnering with AXA XL to provide cybersecurity services; (2) earning awards in Digital Technology Innovation and taking
the top spot in the Refinitiv Diversity and Inclusivity Index; (3) partnering with Exxaro and Qualtrics.
US & CAN: +1 (541) 306 3271 | UK: +44 (0)203 282 1633 | AUS: +61 02 8417 2339 | Email: sales@manzama.com | Web: www.manzama.comYou can also read