CONTEXT- AND SITUATION PREDICTION FOR THE MYAQI URBAN AIR QUALITY MONITORING SYSTEM
←
→
Page content transcription
If your browser does not render page correctly, please read the page content below
Context- and Situation Prediction for the
    MyAQI Urban Air Quality Monitoring System

          Daniel Schürholz1 , Arkady Zaslavsky1 , and Sylvain Kubler2
                     1
                         Deakin University, Melbourne, Australia
                            daniel.schurholz@deakin.edu.au
                            arkady.zaslavsky@deakin.edu.au
                         2
                           Université de Lorraine, Nancy, France
                              s.kubler@univ-lorraine.fr

      Abstract. Predicting the time and place where concentrations of pol-
      lutants will be the highest is critical for air quality monitoring- and
      early-warning systems in urban areas. Much of the research effort in this
      area is focused only on improving air pollution prediction algorithms,
      disregarding valuable environmental- and user-based context. In this pa-
      per we apply context-aware computing concepts in the MyAQI system,
      to develop an integral air quality monitoring and prediction application,
      that shifts the focus towards the individual needs of each end-user, with-
      out neglecting the benefits of the latest air pollution forecasting algo-
      rithms. We design and describe a novel context and situation reasoning
      model, that considers external environmental context, along with user
      based attributes, to feed into the prediction model. We demonstrate the
      adaptability and customizability of the design and the accuracy of the
      prediction technique in the implementation of the responsive MyAQI web
      application. We test the implementation with different user profiles and
      show the results of the system’s adaptation. We demonstrate the pre-
      diction model’s accuracy, when using extended context for 4 air quality
      monitoring stations in the Melbourne Region in Victoria, Australia.

      Keywords: Air Quality · Context-aware Computing · Internet of Things
      · Visualisation · Environmental Monitoring

1    Introduction
Throughout the last years, even decades, there has been a steady rise of air pol-
lution in major cities around the world. This has brought many health compli-
cations to citizens and even increased the mortality rate in urban areas. Already
in 2010 for example, a loss of 25 million healthy years and more than 1.2 million
premature deaths in China were attributed to outdoor air pollution [22]. A very
thorough study [4] done by the Global Burden of Diseases study published in
2017 showed that 4.2 million deaths were attributed to the influence of air pollu-
tion in 2015, from which 1.3 million happened in China and 1.2 million in India.
As a result of these terrible effects, the need for accurate monitoring and reason-
ing about environmental phenomena and creating effective measures to mitigate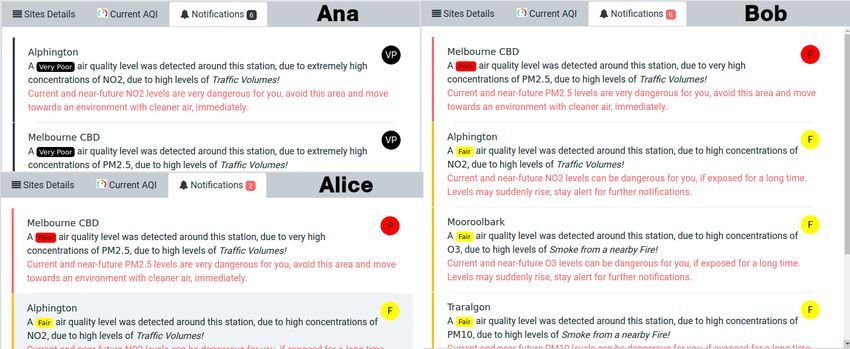
2      D. Schürholz et al.

the damage caused by air pollution is clear. A way to improve the understanding
of how air pollution behaves throughout time is by applying prediction solutions.
     Much of the effort done to predict air quality levels has been aimed at im-
proving the machine learning algorithms used for the forecasts as well as under-
standing the statistical correlation between the different input parameters [2,20].
However, too little has been done to make the prediction algorithms aware of
the context in which the end-user operates (e.g., depending on the end-user’s
location, identity, activity), which is referred to as context-aware computing in
the literature [15]. Some studies have applied context-aware computing on Air
Quality (AQ) monitoring and prediction systems, as in [21,3], but there is still
room for improvement. First, pollutant sources can be considered as contextual
information (e.g., surrounding air pollution incidents such as bushfires, traffic
volumes). Second, low-frequency high peaks of airborne pollutant concentration
could be predicted, by knowing the source of pollution. Third, provide a cus-
tomised and adaptive view of the real-time situations, through a accessible web
context-aware application.
     The objective of this paper is to research and propose an enhanced context-
aware AQ prediction model, and evaluate it by a system implementation for the
The Melbourne city urban area, in Victoria, Australia, that suffers of poor AQ
caused by seasonal bushfires and high traffic levels. Figure 1 gives a glimpse of
the structure of this study, to prove the benefits of context-aware computing
on AQ prediction. We first review in Section 2, some context-aware comput-
ing concepts, along with AQ monitoring definitions and prediction algorithms
for outdoor AQ prediction. In Section 3 we present the theoretical and archi-
tectural details of the proposed context-aware AQ prediction system, which is
called “MyAQI”, standing for “My Air Quality Index”. Section 4 explain the
architecture and implementation of the system. Next, Section 5 presents a real-
life scenario in Melbourne (Australia) that both shows (i) how MyAQI can be
used for predicting AQ in urban areas; and (ii) how the My Air Quality Index
(MyAQI) system’s prediction model performs over a historical test dataset. Fi-
nally, in Section 6 we discuss the contributions of this study and the possible
future work in the AQ prediction area.

Fig. 1. Research structure for the MyAQI system context and situation prediction
model.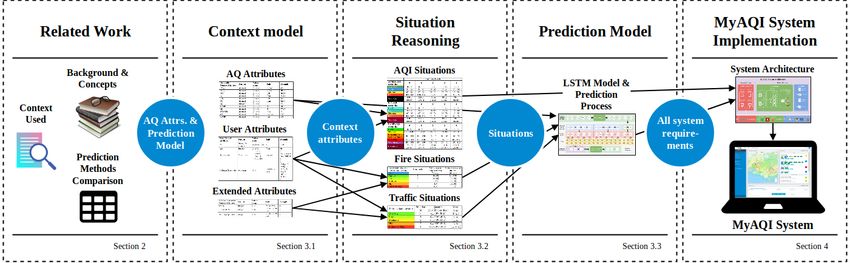
MyAQI System: Context- and Situation Prediction           3

2      Background

The core of context awareness is, obviously, the context. According to the widely
acknowledged definition given in [1], context is “any information that can be
used to characterize situation of an entity, where an entity is a person, place,
or object that is considered relevant to the interaction between a user and an
application, including the user and application themselves.” The Context Space
Theory (CST) is a method to design contextual models [14]. The approach taken
in this method represents the context as a multidimensional space that results in
a model that considers context attributes and situations defined to the specific
use case.
    In the case of this research, the field of application is air quality. The urge
to monitor AQ levels is directly linked to the health risks that high levels of
airborne pollutants or allergenic agents can have on humans [19]. There is big
debate concerning which pollutants are more hazardous and a thorough list
of pollutants and their impact on humans is offered in [19]. The selection of
these attributes for different outdoor air pollution prediction algorithms and
approaches can be seen in Table 1.

Table 1. Use of different air quality characteristics on Deep Learning Neural Network
prediction algorithms.

Approach PM2.5 PM10 NOx O3 SO2 CO RH TEMP WIND P VIS LUM RP
[3]           X       X     X    -    -    -   -      -        -    - -       -     -
[20]          X       X     X    X    X    X   X      X        X    - -       -     -
[2]           -       X     -    -    -    -   X      X        X    X X       -     -
[16]          X       X     X    X    X    X   X      X        X    - -       -     X
[24]          X       -     -    -    -    -   X      X        X    - -       X     X
[23]          X       X     X    X    X    X   X      X        X    X -       -     -
[21]          X       -     -    -    -    -   X      X        X    - -       -     -
[11]          X       -     -    -    -    -   X      X        X    - X       -     -
[13]          X       -     -    -    -    -   X      X        X    X -       X     -
[8]           X       -     -    -    -    -   -      -        X    X -       -     -
Total          9      5      4    3   3    3    8     8        9    4   2     2     2

    The goal of Table1 is to examine which pollutants are being currently moni-
tored and which ones are considered to be critical for the health of citizens; thus
allowing us to select the proper group of variables for the MyAQI system moni-
toring and prediction features. These values are taken from air quality prediction
techniques existing in the literature, which use different artificial intelligence al-
gorithms (incl. machine learning) to estimate the possible levels for pollutants
in the future. On this work we focus on methods that use Deep Learning (DL),
specifically Deep Learning Neural Networks (DNNs), as their main prediction
algorithm.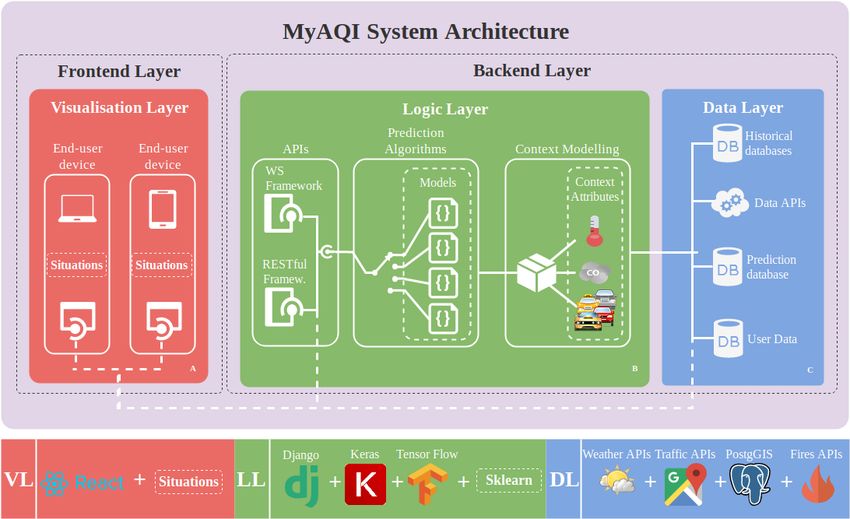
4       D. Schürholz et al.

    In recent years the focus of machine learning techniques has hugely shifted
towards DNN algorithms, because of their complexity and accuracy for solv-
ing previously unattainable problems; and AQ forecasting is not an exception.
Applying DL to the AQ problem was arguably started by B. Ong in [13] intro-
ducing a novel DL model for AQ prediction and in [24] a composite approach is
presented to predict Particle Matter under 2.5 μm of diameter (PM2.5 ) concen-
trations. Long Short-Term Memory Neural Networks (LSTM) is one of the most
widely applied DNNs implementation in AQ problems, as well as in many other
use cases, with high performance outcomes. Many approaches with high accu-
racy are presented for AQ prediction, such as in [20,2,16,11,23,8] where authors
improve LSTM algorithms and combine them with input tuning and optimisa-
tion techniques. But little has been done to extend the context of the information
used as input by the DNNs.
    The data structured by a context model is aimed at improving context pre-
diction of future context information, starting from low-level context prediction
and ending with situation prediction [18]. Some studies for AQ prediction have
applied these algorithms and have been designed considering context awareness.
Examples of such a context-aware system, mixed with DNNs are shown in [21,3].
Authors include auxiliary data such as meteorological and aerosol optical depth
data and geographic dependency between measuring stations, traffic informa-
tion, points of interest, social media check-ins, building types in the surround-
ings, amongst other characteristics, improving the accuracy of the prediction by
expanding the applied information.

3     Air Quality Context & Prediction Model

The MyAQI system is meant to be context-aware, thus, the context model used
to describe its parts is of critical importance. As mentioned before we use CST
to provide a structure to our context model. First we must define the context
attributes, which are comprised by AQ attributes, extended extra attributes and
user attributes.

3.1   Air quality attributes

As stated in the previous section we consider Context Attributes to be of crit-
ical importance for the functioning of the MyAQI system. Airborne pollutants
play the main role in air quality and must be included. As mentioned before we
refer to [19] and our comparison Table 1 to select the most relevant pollutants
in relation to human health. These pollutants are PM2.5 , Particle Matter
under 10 μm of diameter (PM10 ), Nitrogen Dioxide (NO2 ), Ozone
(O3 ), Sulphur Dioxide (SO2 ) and Carbon Monoxide (CO). These 6 pol-
lutants are broadly monitored in environmental systems, and are mapped to a
human-readable scale using an Air Quality Index (AQI), which are widely
implemented by governments worldwide [6,5,19].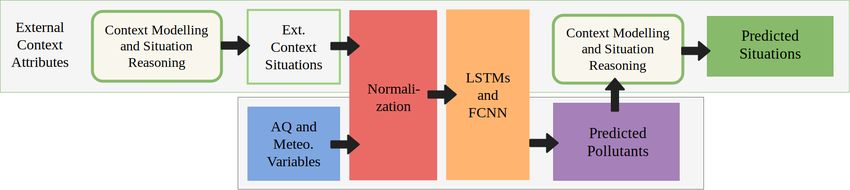
MyAQI System: Context- and Situation Prediction          5

    Meteorological Variables are crucial for understanding the behaviour of
“already emitted” pollutants, as they affect their location, distribution and tem-
porality. We consider Temperature (TEMP) as it affects the characteristics
of gases, by making more or less airborne [9], Relative Humidity (RH) is also
relevant as lower humidity enables pollutant particles to become more airborne
[17], Wind Speed (WSPEED) and Wind Direction (WDIR) are clearly
related to the dynamics of air pollutants, as they influence the present and future
locations of a mass of pollutants.

3.2   Extended external attributes
Air pollutants are measured once they are released into the air and move through
the environment. The sources that emit them are usually not considered, al-
though it can supply extra information to the spatio-temporal behaviour of
pollutants. One such sources is Traffic volume; that is, the amount of mo-
tor vehicles driving a certain segment of road or road crossing over a certain
period of time. Vehicle emissions are considered one of the primary sources of
pollution in cities and contribute largely to high NO2 and CO levels [5][6]. Other
source of pollution, specially in countries such as Australia, where summers can
reach high temperatures and low humidity, are Fire incidents. They contribute
largely to the pollution in urban areas surrounded by dry vegetation areas. Bush-
fires, specifically, contribute largely to high PM2.5 and PM10 levels [5][6].

3.3   User attributes
Finally, any context-aware system has to consider relevant user features, that
are significant in their interaction with the problem at hand. AQ monitoring is
no exception, as air pollutants can affect users differently depending on certain
characteristics. We consider the following user attributes: a User Id identifies a
user to the system and separates information for a customised experience, Geo-
location determines the spatial reference of a user’s location, crucial for outdoor
AQ monitoring, Timestamps give the specific time and date of interaction with
the system to provide updated information and a novel Pollutant sensitivity
scale, which represents the level of influence that a given pollutant has on the
user. Each user has 6 pollutant sensitivity levels assigned, which are derived from
answering a small questionnaire [12] at the system’s profile section. Each level
can take a value between 0 and 4. The values represent the following sensitivities:
0 - “neutral”, 1 - “low”, 2 - “moderate”, 3 - “high” and 4 - “extremely high”.

3.4   Situation reasoning
After defining the context attributes, another major building block of a context-
aware system is defining the Situation Space. For AQ monitoring the following
situations and their characteristics were defined. Table 2 shows the situations
for AQI levels for different user pollutant sensitivities, traffic volumes for sever-
ity levels and fire incidents for severity levels as well, and their corresponding
6 D. Schürholz et al.
triggering Context States. The traffic volumes are dependant of the road and
crossing type where the data was collected, so percentages are used for defining
the severity of a given measurement. Fire incidents are divided into urban and
suburban (and/or countryside) scenarios, because of the size of incidents in each
case and the obstacles that could stop the spread of smoke and ashes.
Table 2. Situation spaces definitions for AQ attributes, traffic volumes and fire inci-
dents and their mapped Context States.
AQI User Sensitivity Levels
categories 0 1 2 3 4
Very Good 0 - 33 0 - 33 0 - 33 0 - 33 0 - 23
Good 34 - 66 34 - 66 34 - 66 34 - 54 24 - 44
Moderate 67 - 99 67 - 99 55 - 79 55 - 79 45 - 59
Poor 100 - 149 100 - 124 80 - 99 80 - 89 60 - 69
Very Poor > 150 > 125 > 100 > 90 > 70
Traffic volume Situation Id Quantile Value
range
Very low 0 Q1 (0%-20%) [0, q1 ]
Low 1 Q2 (20%-40%) ]q1 , q2 ]
Moderate 2 Q3 (40%-60%) ]q2 , q3 ]
High 3 Q4 (60%-80%) ]q3 , q4 ]
Extremely High 4 Q5 (80%-100%) ]q4 , +∞[
Fire severity Situation Id City Suburban
range (kms) range (kms)
No fire 0 ]20, +∞[ ]100, +∞[
Very low 1 [16, 20] [80, 100]
Low 2 [12, 16[ [60, 80[
Moderate 3 [8, 12[ [40, 60[
High 4 [4, 8[ [20, 40[
Extremely High 5 [0, 4[ [0, 20[
3.5 Prediction Model
As previously mentioned, the reasoning module implements context-aware pre-
diction for future AQ levels. The selected algorithm for this purpose is an LSTM.
LSTMs are being widely used in forecasting solutions throughout different fields
and were first introduced in [7]. They improve regular Recurrent Neural Networks
(RNN) to keep information for long-term capabilities. In the MyAQI system the
algorithm takes the measurements from AQ and meteorological variables for the
previous 24 hours as input, as depicted in Figure 2. The notifications then sent
to the user will prioritise those pollutants to which the user has more sensitivity
towards.MyAQI System: Context- and Situation Prediction 7
Fig. 2. The MyAQI system prediction algorithm structure, components and data flow.
4 System Architecture & Implementation
4.1 System architecture
The MyAQI system architecture, depicted in Figure 3, is divided into two ma-
jor layers: Backend and Frontend. The backend layer comprises two other ma-
jor layers: the Data Layer and the Logic Layer. The data layer retrieves the
data required to fuel the context model attributes from external Application
Programming Interfaces (API) and stored in relational databases, along with
user-entered information. The logic layer is comprised by three modules: (i) the
context modelling module, that maps the raw data into usable context attributes,
(ii) the prediction algorithm module which executes data analysis, such as predic-
tion, on the context attributes, to augment the known information, and (iii) the
MyAQI API module which has two interfaces, a Representational State Transfer
(RESTful) Hyper Text Transfer Protocol (HTTP) API for regular exchange of
information with the frontend modules and a Web Sockets (WS) interface for
push notification from the backend server to the user devices. Finally, the fron-
tend layer has only one sub-layer, in charge of the context-aware visualisation of
AQ data. The modules of the Visualisation Layer are: (i) API consumer, which
maps incoming sever information into memory objects, which are then passed to
the (ii) Situation Reasoning module, where the context states are mapped into
real-life events, which are then visualised in the (iii) end-user device views.
4.2 Implementation
Previously the main functionalities, models and goals of the MyAQI system
where introduced. In this subsection the implementation of the system is pre-
sented. Considering the system architecture presented in section 4.1, the fol-
lowing step is to map each structural element to hardware equipment and it’s
functioning software.
The backend layer runs in a virtual server in the cloud for better availability.
The data modules such as the user and the PostgGIS database are installed in
this server. PostGIS is used for geographical queries, needed for the distance
from users to fires incidents, for example. The logic modules are implemented
in the Python programming language. Reasoning functionalities, such as pre-
diction, are implemented with the machine learning frameworks Keras (with a8 D. Schürholz et al.
Fig. 3. MyAQI system layers and overall architecture.
TensorFlow backend). Finally, the API modules are implemented using Django
Rest Framework for the RESTful API and Django Channels, plus the in-memory
database Redis, for the WS interface.
The frontend layer runs in end-user devices, such as mobile phones, tablets
and laptops. Thus, the chosen technology for its development is a JavaScript
responsive web application framework, called ReactJS. All the API consumer,
situation reasoning and context-aware visualisation logic is developed with this
framework and presented via Hyper Text Mark-up Language (HTML) and Cas-
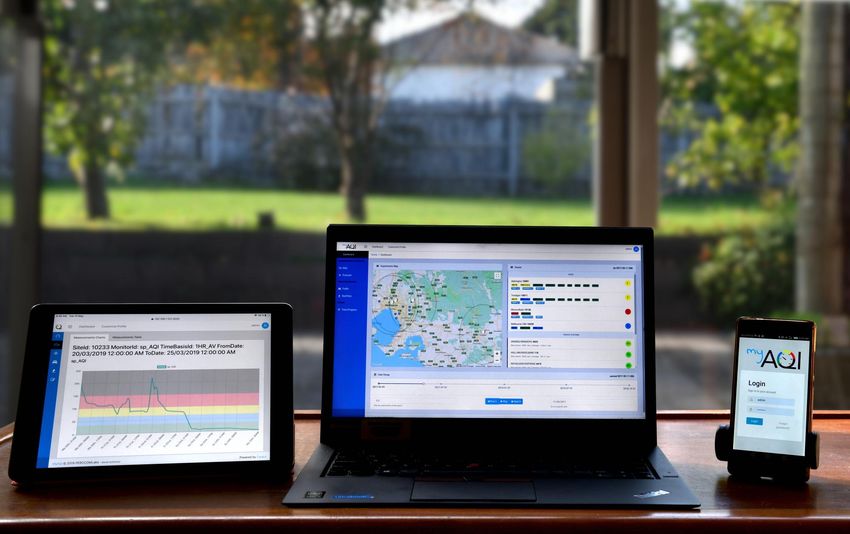
cade Style Sheet (CSS) views. Figure 4 shows different views of the MyAQI web
application rendered on different devices, to show the tools responsive nature.
5 Experiments & Results
The previous section introduced the architecture and implementation of the
MyAQI system and highlighted its different building blocks. This section presents
the experiments that were undertaken to specifically tackle those objectives.
First, the experiments’ setup and structure is explained, together with the re-
quired datasets, and finally, the results of the experimentation are shown.
5.1 Experiments
The AQ attributes required in the context model are presented in section 3. As
the data source for the experiments, the Australian Environmental Protection
Agency (AU-EPA) in Victoria, Australia, provides a live data API that suppliesMyAQI System: Context- and Situation Prediction 9
Fig. 4. The MyAQI system rendered on different end-user devices, for more accessibil-
ity.
both historical and current (updated hourly), and has almost all the needed
context variables for many of the sensor stations distributed throughout Vic-
toria, including meteorological data. For traffic information, data from one to
four nearby vehicle crossing stations (close to the AQ monitoring stations) where
selected to obtain the number of vehicles driving past the site every hour, mea-
sured by the SCATS system (developed by the government of New South Wales,
Australia). Finally, the fire incidents are obtained from a historical dataset, pro-
vided by the Victoria government, in which it keeps track of every fire incident
in its region since the year 1930. The prediction experiments use data from the
previously described data sources, from January 2017 to December 2018.
5.2 Results
In this section the accuracy comparisons of the prediction algorithm are pre-
sented, comparing an LSTM that is run considering external context attributes
versus one without the extended information. And, finally, the context-aware sys-
tem views are presented, to complete the user-oriented nature of context-aware
computing.
To evaluate AQ predictions we compare them against the ground truth and
against the model without the extended environmental context. Table 3 shows
the comparison of predictions’ MAE, RMSE and precision values for the four
stations, once with extended context and once without against the ground truth.
The indicators are defined by the following equations:10 D. Schürholz et al.
n
1X
M AE = |yi − ŷi | (1)
n i=1
v
u n
u1 X
RM SE = t (yi − ŷi )2 (2)
n i=1
|{true AQI situations} ∩ {total AQI situations}|
precision = (3)
|{total AQI situations}|
where n is the number of measurements, yi are the forecasted values and
ŷi are the ground truth values. Precision is a measure used for classification
problems, and we apply it see how well the AQI situations corresponding to the
ground truth values are kept after the forecast. For all stations except Alphington
the improvement in prediction is clear when using the extended environmental
context. The case with Alphington can be interpreted as a lack of correlation
between extended context variables and the AQ in the area, probably coming
from another pollution source. Precision is always improved in the other three
stations, specially in Mooroolbark and Traralgon, which are influenced the most
by seasonal bushfires.
Table 3. Comparison of MAE, RMSE and precision (Prec) for the prediction results
from the LSTM model with and without extended context values, for all four AQ
stations.
Performance Indicators
Station Attributes MAE RMSE Prec
Traralgon AQ station +1hr PM2.5 prediction
Without Extended Context PM2.5 , PM10 , NO2 , 1.678 2.411 0.916
SO2 , CO
With Extended Context + Fires 1.477 2.262 0.943
Mooroolbark AQ station +1hr PM2.5 prediction
Without Extended Context PM2.5 , PM10 4.295 6.769 0.872
With Extended Context + Traffic, Fires 2.124 8.775 0.909
Alphington AQ station +1hr PM2.5 prediction
Without Extended Context PM2.5 , PM10 , NO2 , 1.364 1.922 0.956
SO2 , CO
With Extended Context + Traffic, Fires 1.389 1.949 0.957
Melbourne CBD AQ station +1hr PM2.5 prediction
Without Extended Context PM2.5 2.869 4.115 0.912
With Extended Context + Traffic 2.797 3.85 0.93MyAQI System: Context- and Situation Prediction 11
A snapshot of the prediction algorithm accuracy is presented in Figure 5.
The background colours correspond to the AU-EPA AQI categories and show
that the prediction stays between the value range of each situations, excepting
on some few steps, explaining the overall good precision values.
Fig. 5. Alphington AQ measuring station PM2.5 levels prediction, considering PM2.5 ,
PM10 , NO2 , SO2 , CO and nearby traffic volumes. The background colours correspond
to the AU-EPA AQI categories, proving that the prediction of AQ situations is accurate.
Another important contribution of the MyAQI system is the personalisation
and context-aware views and notifications that the offered to users. Table 4 show
three user profiles with different health conditions and corresponding pollutant
sensitivities. Using this table’s values the MyAQI was run and the notifica-
tions received by the user tested. Figure 6 presents the MyAQI web application
context-aware air quality monitoring notifications for users with different sensi-
tivity levels to main pollutants, changing the severity according to user health
conditions. Finally, the notifications also highlight the source for the pollution
(e.g., high traffic volumes) expanding the knowledge of the user over the AQ
problem.12 D. Schürholz et al.
Table 4. Context-aware monitoring experiments setup for 3 users with different health
conditions and pollutant sensitivities.
User Id Health Condition General pollutant sensitivity
alice Completely healthy 0 - Neutral
bob Unhealthy diet, casual smoker, 2 - Moderate
no exercise.
ana Has asthma 4 - Extremely High
Fig. 6. MyAQI web application context-aware AQ monitoring notifications for users
with different health conditions and pollutant sensitivity levels.
6 Conclusion
In this work we research and propose a context-aware model and system archi-
tecture for AQ monitoring and prediction systems and we prove its benefits by
implementing the MyAQI system. It includes the proposed context- and situa-
tion model, the selected prediction algorithm, a thorough architectural design,
the implementation, the coupling with selected data sources and the layout of
experiments to prove the expected performance of the system. A web applica-
tion was developed to provide a user-friendly interface to allow user interaction
with the monitoring and prediction functionalities. The application is a cus-
tomisable tool that gives users a highly individualised experience and augments
their understanding of the air pollution problem. All the data used in the sys-
tem was obtained from trusted historical and current data sources and reflect
real-life situations obtained from the Victoria EPA in Australia, allowing for
an objective assessment of the research results. We prove that the use of ex-
tended environmental context sources on the AQ prediction problem improves
prediction accuracy, in our specific case, for 3 out of 4 AQ stations.
Finally, the MyAQI system, implemented in this work, provides a proof-
of-concept of a context-aware system for the use case of AQ monitoring andMyAQI System: Context- and Situation Prediction 13
prediction in the real-world scenario of the Melbourne area in Victoria, Aus-
tralia. It showed the benefits that can be drawn from using existing IoT data
sources and extracting more information from them by relating them to real-life
situations and phenomena.
Acknowledgment
This research was funded by the PERCCOM Erasmus Mundus Joint Masters
Program of the European Union [10]. Part of this study has been carried out in
the scope of the project bIoTope, which is co-funded by the European Commis-
sion under Horizon-2020 program, contract number H2020-ICT- 2015/688203-
bIoTope. The research was also supported by Deakin University, Australia. Air
pollution data in the city of Melbourne was freely obtained from Victoria EPA
API (http://sciwebsvc.epa.-vic.gov.au/aqapi/).
References
1. Abowd, G.D., Dey, A.K., Brown, P.J., Davies, N., Smith, M., Steggles, P.: Towards
a better understanding of context and context-awareness. In: Gellersen, H.W. (ed.)
Handheld and Ubiquitous Computing: First International Symposium, HUC’99
Karlsruhe, Germany, September 27–29, 1999 Proceedings, pp. 304–307. Springer
Berlin Heidelberg, Berlin, Heidelberg (1999)
2. Athira, V., Geetha, P., Vinayakumar, R., Soman, K.P.: Deepairnet: Applying re-
current networks for air quality prediction. Procedia Computer Science 132, 1394–
1403 (2018)
3. Chen, L., Cai, Y., Ding, Y., Lv, M., Yuan, C., Chen, G.: Spatially fine-grained
urban air quality estimation using ensemble semi-supervised learning and pruning.
Proceedings of the 2016 ACM International Joint Conference on Pervasive and
Ubiquitous Computing - UbiComp ’16 pp. 1076–1087 (2016)
4. Cohen, A.J., Brauer, M., Burnett, R., Anderson, H.R., Frostad, J., Estep, K.,
Balakrishnan, K., Brunekreef, B., Dandona, L., Dandona, R., Feigin, V., Freedman,
G., Hubbell, B., Jobling, A., Kan, H., Knibbs, L., Liu, Y., Martin, R., Morawska,
L., Pope, C.A., Shin, H., Straif, K., Shaddick, G., Thomas, M., van Dingenen, R.,
van Donkelaar, A., Vos, T., Murray, C.J., Forouzanfar, M.H.: Estimates and 25-
year trends of the global burden of disease attributable to ambient air pollution:
an analysis of data from the global burden of diseases study 2015. The Lancet
389(10082), 1907–1918 (2017)
5. EEA: Air quality in europe - 2017 report. Tech. Rep. 13, European Environmental
Agency (EEA) (2017)
6. EPA Victoria: Future air quality in victoria - final report future air quality in victo-
ria - final report. Tech. rep., Environmental Protection Agency Victoria Australia,
Melbourne (2013)
7. Hochreiter, S., Schmidhuber, J.: Long short-term memory. Neural Comput. 9(8),
1735–1780 (Nov 1997)
8. Huang, C.J., Kuo, P.H.: A deep cnn-lstm model for particulate matter (pm2.5)
forecasting in smart cities. Sensors (Switzerland) 18(7) (2018)14 D. Schürholz et al.
9. Kalisa, E., Fadlallah, S., Amani, M., Nahayo, L., Habiyaremye, G.: Temperature
and air pollution relationship during heatwaves in. Sustainable Cities and Society
43(June), 111–120 (2018)
10. Klimova, A., Porras, J., Andersson, K., Rondeau, E., Ahmed, S.: Perccom: A mas-
ter program in pervasive computing and communications for sustainable develop-
ment (April) (2016)
11. Li, X., Peng, L., Yao, X., Cui, S., Hu, Y., You, C., Chi, T.: Long short-term memory
neural network for air pollutant concentration predictions: Method development
and evaluation. Environmental Pollution 231, 997–1004 (2017)
12. Nurgazy, M., Zaslavsky, A., Jayaraman, P., Kubler, S., Mitra, K., Saguna, S.:
Cavisap: Context-aware visualization of outdoor air pollution with iot platforms.
International Conference on High Performance Computing and Simulation (HPCS)
(2019)
13. Ong, B.T., Sugiura, K., Zettsu, K.: Dynamically pre-trained deep recurrent neu-
ral networks using environmental monitoring data for predicting pm2.5. Neural
Computing and Applications 27(6), 1553–1566 (2016)
14. Padovitz, A., Wai Loke, S., Zaslavsky, A.: Towards a theory of context. Second
IEEE Annual Conference on Pervasive Computing and Communications (Work-
shops, PerCom), 38–42 (2010)
15. Perera, C., Zaslavsky, A., Christen, P., Georgakopoulos, D.: Context aware comput-
ing for the internet of things: A survey. IEEE Communications Surveys Tutorials
16(1), 414–454 (2014)
16. Qi, Y., Li, Q., Karimian, H., Liu, D.: A hybrid model for spatiotemporal forecast-
ing of pm2.5 based on graph convolutional neural network and long short-term
memory. Science of The Total Environment 664, 1–10 (2019)
17. Qiu, H., Tak, I., Yu, S., Wang, X., Tian, L., Tse, L.A.: Season and humidity
dependence of the effects of air pollution on copd hospitalizations in hong kong.
Atmospheric Environment 76, 74–80 (2013)
18. Sigg, S., Gordon, D., v. Zengen, G., Beigl, M., Haseloff, S., David, K.: Investiga-
tion of context prediction accuracy for different context abstraction levels. IEEE
Transactions on Mobile Computing 11(6), 1047–1059 (June 2012)
19. USEPA: Technical assistance document for the reporting of daily air quality - the
air quality index ( aqi ). Environmental Protection (May), 1–28 (2013)
20. Wang, J., Song, G.: A deep spatial-temporal ensemble model for air quality pre-
diction. Neurocomputing 314, 198–206 (2018)
21. Wen, C., Liu, S., Yao, X., Peng, L., Li, X., Hu, Y., Chi, T.: A novel spatiotemporal
convolutional long short-term neural network for air pollution prediction. Science
of the Total Environment 654, 1091–1099 (2019)
22. Yin, P., He, G., Fan, M., Chiu, K.Y., Fan, M., Liu, C., Xue, A., Liu, T., Pan, Y.,
Mu, Q., Zhou, M.: Particulate air pollution and mortality in 38 of china’s largest
cities: time series analysis. Bmj 667(March), j667 (2017)
23. Zhou, Y., Chang, F.J., Chang, L.C., Kao, I.F., Wang, Y.S.: Explore a deep learning
multi-output neural network for regional multi-step-ahead air quality forecasts.
Journal of Cleaner Production 209, 134–145 (2019)
24. Zhu, S., Lian, X., Wei, L., Che, J., Shen, X., Yang, L., Qiu, X., Liu, X., Gao,
W., Ren, X., Li, J.: Pm2.5forecasting using svr with psogsa algorithm based on
ceemd, grnn and gca considering meteorological factors. Atmospheric Environment
183(July 2017), 20–32 (2018)You can also read