Unveiling Tatun volcanic plumbing structure induced by post collisional extension of Taiwan mountain belt
←
→
Page content transcription
If your browser does not render page correctly, please read the page content below
www.nature.com/scientificreports
OPEN Unveiling Tatun volcanic
plumbing structure induced
by post‑collisional extension
of Taiwan mountain belt
Hsin‑Hua Huang1*, E.‑S. Wu1, C.‑H. Lin1, J. Y.‑T. Ko2, M.‑H. Shih1 & I. Koulakov3,4,5
The Tatun Volcanic Group (TVG) is proximal to the metropolis of Taipei City (population of ca. 7 million)
and has long been a major concern due to the potential risks from volcanic activity to the population
and critical infrastructure. While the TVG has been previously considered a dormant or extinct volcano,
recent evidence suggests a much younger age of the last eruption event (~ 6000 years) and possible
existence of a magma reservoir beneath the TVG. However, the location, dimension, and detailed
geometry of the magma reservoir and plumbing system remains largely unknown. To examine the
TVG volcanic plumbing structure in detail, the local P-wave travel time data and the teleseismic
waveform data from a new island-wide Formosa Array Project are combined for a 3D tomographic
joint inversion. The new model reveals a magma reservoir with a notable P-wave velocity reduction of
19% (ca. ~ 19% melt fraction) at 8–20 km beneath eastern TVG and with possible northward extension
to a shallower depth near where active submarine volcanoes that have been detected. Enhanced
tomographic images also reveal sporadic magmatic intrusion/underplating in the lower crust of
Husehshan Range and northern Taiwan. These findings suggest an active volcanic plumbing system
induced by post-collisional extension associated with the collapse of the orogen.
The Taiwan orogenic belt is a product of oblique collision between the Eurasian plate (EP) and the Philippine Sea
plate (PSP), where the EP subducts eastward at the Manila trench to the south and the PSP subducts northward
at the Ryukyu trench to the east (Fig. 1a). The collision initiated 4–6 Ma as the PSP Luzon arc collides toward
the EP continental margin and propagated southward from northern T aiwan1,2. The northern Taiwan has there-
fore experienced a tectonic transition from collision to post-collisional extension since ca. 2.8 Ma3–5 producing
multiple-stage and complex v olcanisms6,7 (Fig. 1b). Offshore in the east, the PSP subduction and subsequent
back-arc opening created the Ryukyu volcanic arc and a series of submarine volcanoes in the Okinawa trough and
Kueishantao Island (Ke). Offshore in the north, the northern Taiwan volcanic zone (NTVZ) in NE-SW trending
was suggested to form by the extensional collapse of the mountain b elt3,6. The most obvious inland manifestation
of this NTVZ is the Tatun volcano group (TVG) located north of Taipei city. Its proximity within 15 km of the
metropolis Taipei where more than 7 million people reside and two nuclear power plants on the northern coast
has posed a severe threat to communities across T aiwan8.
The TVG has been considered an dormant or extinct volcano until recently since no volcanic eruption was
recorded in historical times8,10. The two major time periods of volcanism pulses were suggested at 2.8–2.5 Ma and
0.8–0.2 Ma by the radiometric dating of volcanic rocks11–13. However, recent studies of volcanic ash characters in
the northern Taipei basin and volcaniclastic deposits in the TVG found much younger eruption records of 20 Ka
and 6000 years ago14,15. Meanwhile, growing evidences also suggested a magma reservoir likely existing beneath
the TVG. For instance, the high 3He/4He ratio from the fumarolic and bubbling gasses of TVG hot springs
requires a deep magmatic origin, e.g. magma reservoir16,17. The seismic analysis of S-wave shadows and P-wave
delays from deep subduction earthquakes suggested the existence of a magma reservoir in the lower crust slightly
to the east of the T VG18. While counterevidence for such a lower-crust magma reservoir was also proposed
recently19, the vigor of hydrothermal activity at several fumarole sites, identified volcanic tremors and phreatic
1
Institute of Earth Sciences, Academia Sinica, Taipei, Taiwan. 2Institute of Oceanography, National Taiwan
University, Taipei, Taiwan. 3Trofimuk Institute of Petroleum Geology and Geophysics SB RAS, Novosibirsk,
Russia. 4Novosibirsk State University, Novosibirsk, Russia. 5Institute of Volcanology and Seismology FEB RAS,
Petropavlovsk‑Kamchatsky, Russia. *email: hhhuang@earth.sinica.edu.tw
Scientific Reports | (2021) 11:5286 | https://doi.org/10.1038/s41598-021-84763-z 1
Vol.:(0123456789)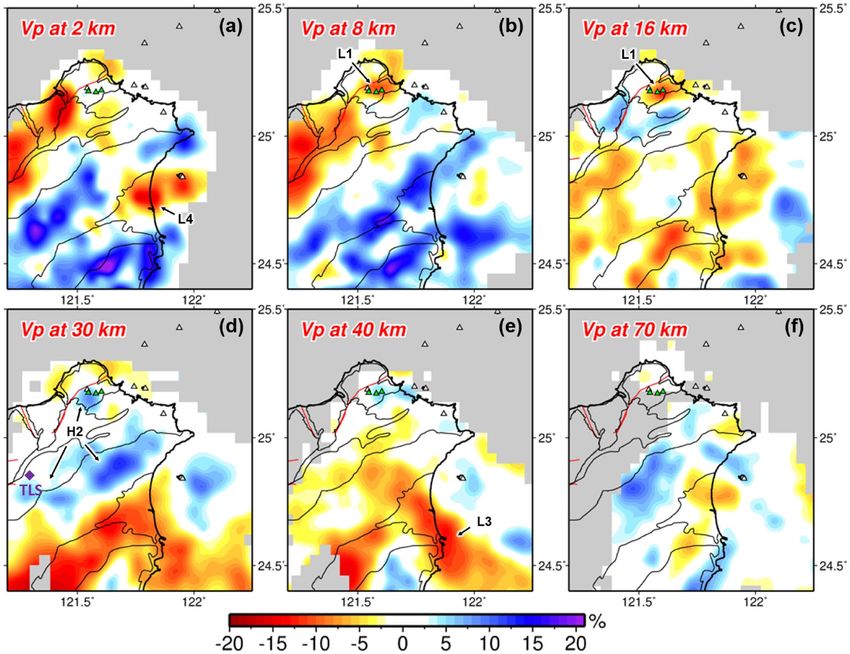
www.nature.com/scientificreports/
Figure 1. Tectonic and data distribution maps. (a) Tectonic setting of the Taiwan region where the Philippine
Sea plate subducts northward along the Ryukyu trench and the Eurasian plate subducts eastward along the
Manila trench. The black arrow shows the plate motion at 82 mm/year. (b) Study area showing the distribution
of stations used and regional volcanoes. Purple and blue squares denote the stations of local integrated seismic
network and Formosa Array. Red triangles indicate the volcanoes9. TVG Tatun volcano group, KVG Keelung
volcano group, Ke Kueishantao Island, Ki Keelungyu Island, Ksv Keelung submarine volcano, SV An unnamed
submarine volcano, HV Huapingyu island, MV Mienhuayu island, PV Pengchiayu island. Label 1–4 shows
geological units of western foothill, Hsuehshan Range, western and eastern Central Range, respectively. Taipei
City is outlined by the yellow curves. (c) Distribution of teleseismic events recorded (gray dots) and used (red
dots) by Formosa Array deployment period. (d) Distribution of used local earthquakes color coded by focal
depth. This figure is generated by GMT 4.5.18 https://www.generic-mapping-tools.org/.
eruptions, and frequent miscroearthquake activities8,20–22 all require a persistent heat source beneath the TVG. It
is therefore of great importance to image the location, dimension, and detailed geometry of the feeding system.
To illuminate the volcanic plumbing structure of the TVG, a deployment of dense broadband seismic array,
named Formosa A rray23, was launched in 2017 and has installed 120 out of 140 planned stations by October
2019 (Fig. 1b, blue squares). The station spacing is about 5 km uniformly across plain and mountain areas, pro-
viding a new opportunity to improve tomographic imaging of northern Taiwan24–27. In this study, we combine
the teleseismic waveform data from the Formosa Array and the local P-wave picking data from an integrated
seismic network to conduct a 3D joint inversion (Fig. 1c,d). The new model unveils a clear magma reservoir
beneath the east of the TVG and possible magmatic intrusion/underplating bodies related to post-collisional
extension in northern Taiwan.
Scientific Reports | (2021) 11:5286 | https://doi.org/10.1038/s41598-021-84763-z 2
Vol:.(1234567890)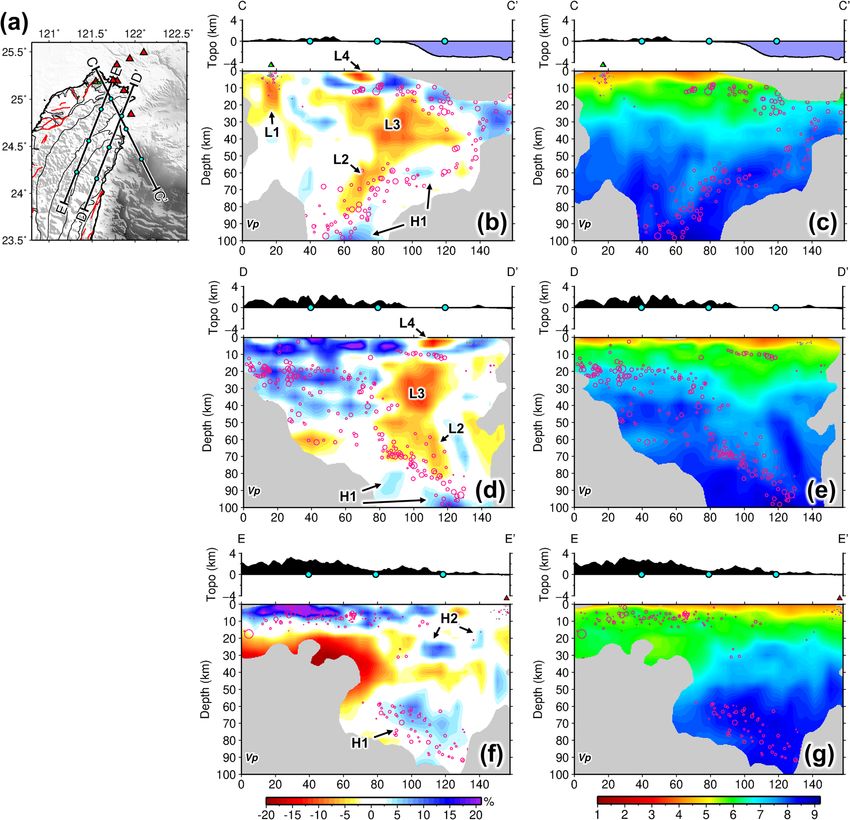
www.nature.com/scientificreports/
Figure 2. Model results at different depths (a–f). The warm and cold colors represent the low and high P-wave
velocities. White triangles denote the volcano locations of Northern Taiwan volcanic zone. Green triangles are
the main fumarole sites and craters in Tatun volcano group. The purple diamond in (d) shows the Tsaolingshan
lava site (TLS). Labels indicate the velocity anomalies discussed in the text. This figure is generated by GMT
4.5.18 https://www.generic-mapping-tools.org/ and Microsoft Office 2016 https://www.microsoft.com/zh-tw/
microsoft-365/microsoft-office?rtc=1.
Results
Model results and verification. The model slices at different depths are shown in Fig. 2, where poorly
resolved areas are masked and defined as a resolvability index R < 0.6 calculated from checkerboard tests (Sup-
plementary information and Supplementary Fig. S5). Benefiting from the uniform and dense station distribu-
tion of the Formosa Array, the joint inversion integrating teleseismic data greatly improves the resolution to the
north of latitude 25.3° and at depths of 5–50 km when compared to the inversion results without teleseismic data
(Supplementary Figs. S1 and S6). With the enhanced images, a pronounced low velocity anomaly (L1) stands
out beneath the Tatun volcano group (TVG) at the depth slice of 8 and 16 km (Fig. 2b,c). This slow anomaly is
elongated sub-vertically at a depth range of 8–20 km as shown in cross-sections AA′ and BB′ (Fig. 3b,d), with
most of the seismicity lying above the anomaly. According to the projected locations of craters (green triangles
in Fig. 3), this slow anomaly is not located at the center of TVG (i.e. Chihsingshan, CHS) but slightly to the east
beneath the Huangzuishan (HGS) and Dayoukeng fumarole (DYK). In the cross-section AA′, it can be seen that
the reservoir extends upward to a shallower depth of ~ 5 km and northward to the offshore areas near where
active submarine volcanoes (SV and Ksv in Fig. 1b) have been documented9.
Deep velocity structures beneath northern Taiwan are shown in regional cross-sections in Fig. 4. In cross-
section CC′, the subducting PSP is characterized by the seismicity with high velocity anomaly, H1 (Fig. 4b,c). The
low velocity anomaly L2 at a deep depth around 70–80 km has been identified and suggested as the subduction-
induced partial melting in the previous s tudies23,25. This slow anomaly L2 seems not to be connected to the Tatun
slow anomaly (L1) as a feeding source. Other two pronounced low velocity anomalies, L3 and L4, at shallower
depths have been observed previously and inferred as the serpentinized mantle w edge25,27 and sediments of Ilan
25
plain , respectively. Cross-section DD′ provides another angle of view for these structures (Fig. 4d,e). Further
to the west in cross-section EE’, it is noteworthy that an abrupt transition in crustal structure is observed from
Scientific Reports | (2021) 11:5286 | https://doi.org/10.1038/s41598-021-84763-z 3
Vol.:(0123456789)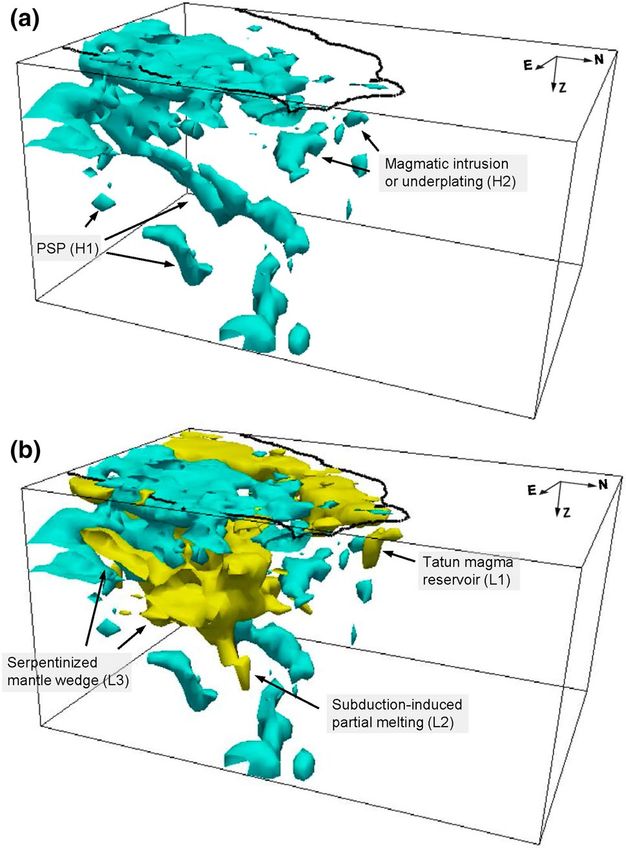
www.nature.com/scientificreports/
Figure 3. Model results in cross sections across the Tatun volcano group. (a) Locations of cross sections AA′
and BB′ shown in (b–e). Cyan dots mark the distance intervals of cross-sections for reference. P-wave velocity
perturbations and absolute values for cross-sections AA′ and BB′ are shown in (b,d) and (c,e) respectively. Red
triangles denote the volcano locations of Northern Taiwan volcanic zone. Green triangles are the main fumarole
sites and craters in Tatun volcano group. The pink and gray dots denote earthquakes from two different catalogs:
the former are the groping events used in the inversion and the latter are local microseismicity determined by
TVO seismic network. Labels indicate the velocity anomalies discussed in the text. This figure is generated by
GMT 4.5.18 https://www.generic-mapping-tools.org/ and Microsoft Office 2016 https://www.microsoft.com/
zh-tw/microsoft-365/microsoft-office?rtc=1.
thickened crustal root in the south to a few high velocity anomalies, denoted as H2, in the north (Fig. 4f,g).
This transition occurs roughly along the boundary between the Central range and Hsuehshan range (Fig. 2d).
Characteristic-model tests are conducted to evaluate the robustness of the geometry of the TVG L1 slow
anomaly (Supplementary Fig. S7). We test vertically-elongated and concentrated synthetic slow anomalies at
depth ranges of 8–20 and 12–16 km and find that the vertically-elongated shape of L1 is resolvable and not a
consequence of smearing effect. Other tests including data noise and different initial models are also conducted:
adding random noise with 0.12-s standard deviation (based on the residual RMS of actual inversion) to the syn-
thetic data and using a different initial model (e.g. 1-D velocity model) do not change the tomographic imaging
that much (Supplementary Figs. S8 and S9). Detailed descriptions of the tests are referred to the Supplementary
Information.
Discussion
Magma reservoir of Tatun volcano. The new model derived from joint inversion of local earthquake and
teleseismic data unveils a pronounced low velocity anomaly (L1) beneath the TVG, interpreted as the magma
reservoir (Figs. 2, 3). It is vertically elongated in shape and is about 10 km in diameter at depths of 8–20 km,
which is shallower than the previously proposed depth18,19. This vertically extended geometry of the imaged res-
ervoir seems to be robust through characteristic-model tests (Supplementary Fig. S7–S9). The maximum P-wave
velocity (Vp) reduction of the reservoir is about 12%. Since the regularization of tomographic inversions often
damps the magnitude of velocity perturbations, we conduct synthetic tests with different input Vp reductions for
the reservoir to assess the actual velocity anomaly magnitude (Supplementary Information and Supplementary
Fig. S10). The results find that a greater Vp reduction of 19% is needed to fit the inversion results (Supplementary
Scientific Reports | (2021) 11:5286 | https://doi.org/10.1038/s41598-021-84763-z 4
Vol:.(1234567890)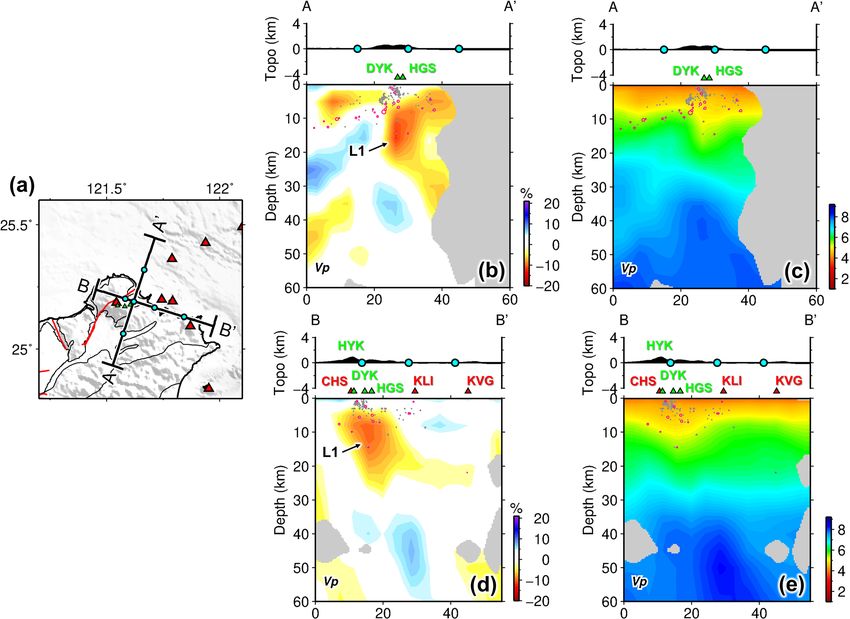
www.nature.com/scientificreports/
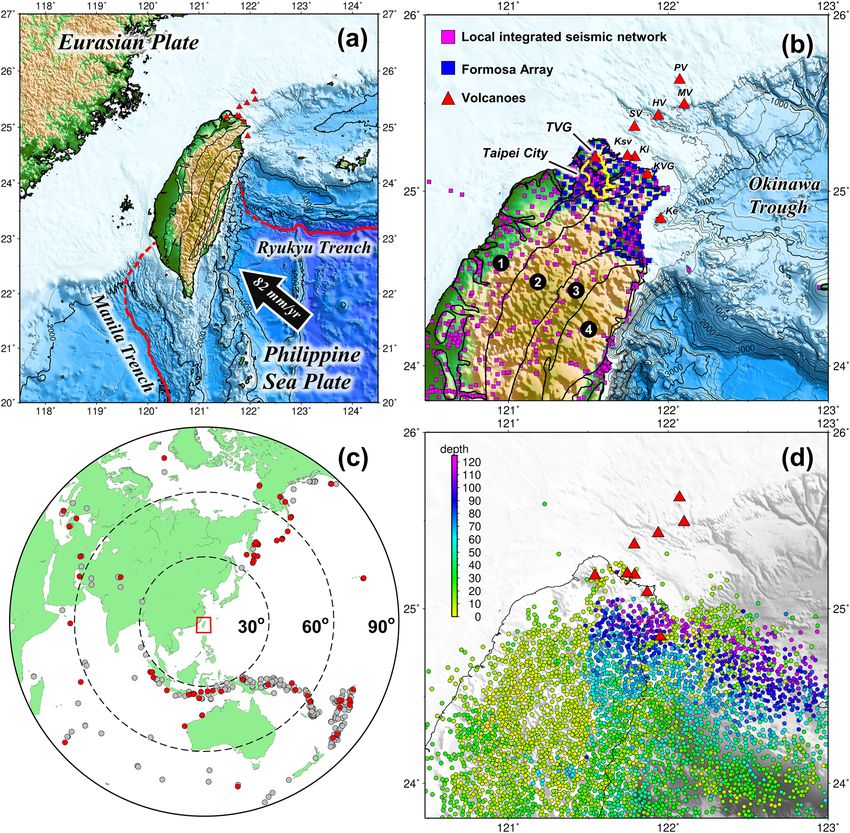
Figure 4. Model results in regional cross sections of northern Taiwan. (a) Locations of cross sections CC′–
EE′ shown in (b–g). Cyan dots mark the distance intervals of cross-sections for reference. P-wave velocity
perturbations and absolute values for cross-sections CC′–EE′ are shown in (b,d,f) and (c,e,g) respectively. Purple
circles indicate the local earthquakes. Red triangles denote the volcano locations of Northern Taiwan volcanic
zone. Green triangles are the main fumarole sites and craters in Tatun volcano group. Labels indicate the velocity
anomalies discussed in the text. This figure is generated by GMT 4.5.18 https://www.generic-mapping-tools.org/
and Microsoft Office 2016 https://www.microsoft.com/zh-tw/microsoft-365/microsoft-office?rtc=1.
Fig. S10a,f). This is a large value comparable to recently reported high-melt-reservoirs at Long Valley caldera in
USA28 and Santorini volcano in Greece29.
The high value of 19% is difficult to explain by temperature and composition alone and implies the presence of
melt. We estimate the melt fraction of the magma reservoir by using Gassmann’s r elations30,31. The calculation and
used parameters are described in “Data and methods” and Supplementary Table S2 in detail. Assuming andesitic
melt and granite frame rock, 19% Vp reduction yields a high melt fraction of ~ 19% (Fig. 5). Alternatively, replac-
ing andesitic melt by water or C O2 for a hydrothermal reservoir results in a pore fraction of ~ 15% (Supplementary
Table S2). While it is unlikely to have hydrothermal systems down to as deep as 20 km due to high pressure, a
certain mixture such like partial melt intruded at depths and hydrothermal gas/fluid accumulating at the top is
possible. Although the uncertainty of this simplified estimation is not trivial, the high melt fraction indicates
that the TVG plumbing system could remain active with sufficient heat supply.
Pu et al.32 recently relocated the micro-earthquakes in the TVG area and revealed a clear conduit-like struc-
ture beneath the Dayoukeng fumarole, which requires volcanic gas and fluid source ascending from below. The
consistent location of the magma reservoir we resolved can potentially be the gas/fluid source to either replen-
ish a shallower hydrothermal reservoir or feed directly to the fumaroles through fractured pathways (Fig. 3b).
Scientific Reports | (2021) 11:5286 | https://doi.org/10.1038/s41598-021-84763-z 5
Vol.:(0123456789)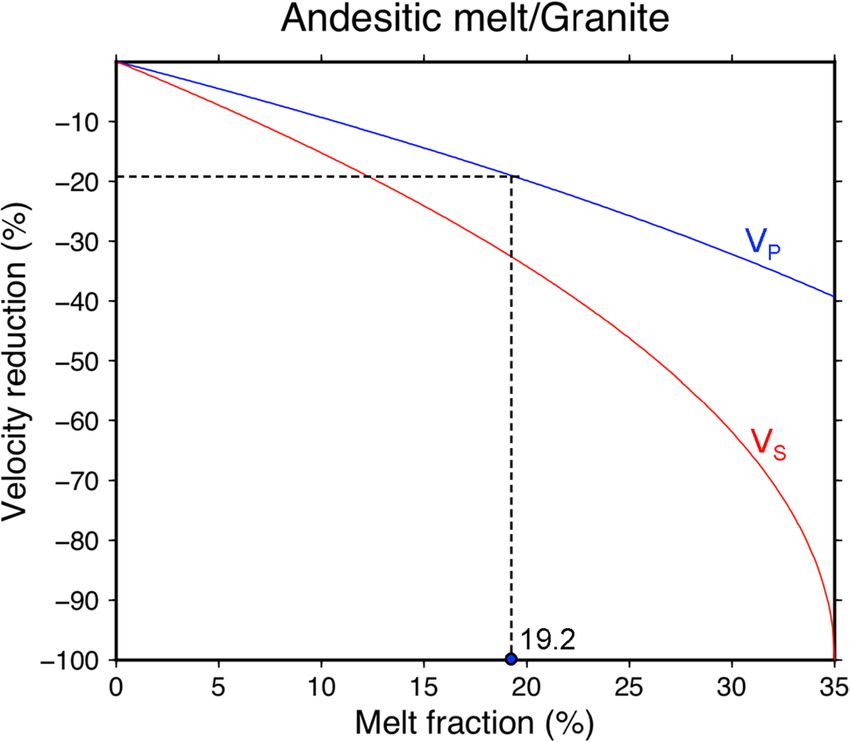
www.nature.com/scientificreports/
Figure 5. Melt fraction estimation for the magma reservoir. Blue and red curves are calculated relationship of
P-wave and S-wave velocity reduction as a function of melt fraction.
Origin of Tatun volcano magma reservoir. In a regional volcanism context, the next key piece of infor-
mation is to know the origin of magma in the reservoir. The TVG is located above the edge of the northward
subducting Philippine Sea Plate (Fig. 1a). But from Fig. 4, it is clear that the magma reservoir (L1) is not fed by
current subduction-induced partial melting (L2) as no pathway is identifiable in between. The magmatism of
the TVG, as well as the entire northern Taiwan volcanic zone (NTVZ, Fig. 1b), has been suggested to be part of
the Ryukyu volcanic front that was initiated by the westward advance of Philippine Sea Plate before 2 Ma and
ceased by the following slab rollback and opening of the Okinawa T rough3,4. Wang et al., in contrast, suggested
a mechanism of post-collisional delamination to form the NTVZ since geochemical characteristics of NTVZ
magmas show significant components of asthenosphere and metasomatized subcontinental m antle4,6. If exten-
sional magmatism occurred, we envisage that the crust should have been subjected to extensive magmatic intru-
sion or underplating which is often characterized by high velocity bodies in the lower crust or beneath M oho33.
In Figs. 2d and 4f, we do observe such plausible high velocity bodies (denoted as H2) sporadically present in the
lower crust of the Hsuehshan range and its north according to the Moho depth around 30 km in this region34–36.
To the south, the crust is thickened and relatively intact along the Central Range (Fig. 4f,g). Distribution of these
faster anomalies also largely overlays with the extent of NTVZ volcanism including the Tsaolingshan lava site
(TLS) at the southern end of NTVZ7 (Fig. 2d, purple diamond), as strong evidence of the magmatic intrusion/
underplating during the post-collisional extension of northern Taiwan mountain belt which is still ongoing to
the present day5,37.
A clearer 3-D perspective view of northern Taiwan velocity structure is shown in Fig. 6. In addition to fea-
tures, such as subduction-induced partial melting, serpentinized mantle wedge, and thickened crustal root, the
new model unveils the location and geometry of the Tatun magma reservoir and magmatic intrusion/under-
plating bodies in the lower crust of northern Taiwan, which sheds light on a clearer picture of post-collisional
magmatism and tectonics of Taiwan orogeny. In fact, during the slab roll back of Teng’s model3,4, extensional
magmatism could also o ccur38. By current tomographic imaging solely, it could be difficult to differentiate the
slab roll back and the delamination model4,6. A higher-resolution imaging of slab interaction between the
3,4
PSP and EP at deep depths beneath the northern Taiwan may help resolve the debate. However, limited by the
relatively narrow aperture of Formosa array, the teleseismic data do not provide additional resolution deeper
than 60–70 km (Supplementary Fig. S5).
Concluding remarks
The 120 uniformly-distributed broadband stations of the Formosa Array provide a unique opportunity to illu-
minate the Tatun volcanic plumbing system and deep subsurface velocity structure beneath northern Taiwan
(Fig. 1b). The wealth of this new dataset will facilitate further studies and findings to come. The unveiled Tatun
magma reservoir shows a shallower location (8–20 km) than previously thought and high melt content (~ 19%).
Since no clear mantle feeding source is identified, whether the melt is residual from a recent eruption or is new
from the mantle source is unknown. While the high melt does not imply an imminent eruption, it could probably
sustain an active hydrothermal system of the Tatun volcano in the long run. Monitoring all forms of activity in
the TVG (e.g. hydrothermal, microseismicity, gass/fluid chemistry, C O2/SiO2 flux, ground deformation, etc.) is
therefore of great importance for volcanic hazard forecasting and mitigation.
Scientific Reports | (2021) 11:5286 | https://doi.org/10.1038/s41598-021-84763-z 6
Vol:.(1234567890)www.nature.com/scientificreports/
Figure 6. 3-D perspective and interpretations of 3-D velocity structures in the northern Taiwan. Yellow and
cyan bodies represent the low and high velocity anomalies with values greater than ± 6%.
Data and methods
Seismic networks and data processing. We use both local and teleseismic earthquake data for a joint
inversion in this study. The local earthquake data are compiled from an integrated regional seismic network that
combines (1) the Central Weather Bureau permanent seismic network (CWBSN)39, (2) Taiwan Strong Motion
Instrumentation Program (TSMIP)40, (3) Broadband Array in Taiwan for Seismology (BATS)41, (4) stations
from the Japan Meteorological Agency (JMA) on the western Ryukyu a rc42, and (5) stations from the TAIGER
project that include inland broadband stations and western offshore OBS arrays43. A total of 671 stations are used
in the study area (Fig. 1b, purple squares). Based on the data criteria that (1) each event was recorded by at least 4
stations, (2) gap angle of recorded stations less than 180°, (3) focal depth shallower than 120 km, and (4) picking
quality less than level 2 (according to the CWB picking criteria), 60,081 events are sorted out from 1991 to 2017.
To avoid the dominance from compactly-distributed earthquake clusters for better conditioning the inversion, a
3-D event grouping m ethod25 with 2 km radius is applied to homogenize the event distribution and reduce the
event number to 3587 with 37,373 readings in the end (Fig. 1d).
For the teleseismic data, we collect waveform data from 371 teleseismic events ( ML ≥ 5.0) in a distance range
of 30°–90° recorded by the newly-deployed Formosa Array (Academia Sinica, Institute of Earth Sciences, 2017)
from April 2018 to October 2019 (Fig. 1c, gray dots). The vertical component of waveform data is bandpass-
filtered in 0.08–0.15 Hz to measure the P-wave relative travel times between stations using the adaptive stacking
method43. Through the iterative measuring process, only those with signal-to-noise ratio larger than 5 and cross-
correlation coefficients (CC) greater than 0.9 are retained. After final visual inspection and avoiding dominance
in the inversion by the events in Tonga subduction zone from the southeast, we sort and even the events in four
quadrants and obtain a total of 70 quality events with 4891 readings (Fig. 1c, red dots). Supplementary Fig. S2
shows the measured relative P-wave travel times for four example events coming from different quadrants. The
travel times for the stations around the TVG are consistently delayed regardless of the event azimuth, implying
the existence of low velocity anomalies underneath. 3-D distribution of ray paths from the local and teleseismic
events are shown in Supplementary Fig. S1.
Tomographic joint inversion and resolution tests. A recently developed tomographic code for multi-
dataset joint inversion is employed in this study25,26,31, in which the absolute travel-time residuals from local
earthquake data and the relative travel-time residuals from teleseismic data are simultaneously minimized (Sup-
plementary Information). The model grids are parameterized with 4 km in longitude and latitude and increasing
intervals from − 5 to 120 km in depth as shown in Supplementary Fig. S1a and Supplementary Table S1. The 3-D
Scientific Reports | (2021) 11:5286 | https://doi.org/10.1038/s41598-021-84763-z 7
Vol.:(0123456789)www.nature.com/scientificreports/
P-wave velocity (VP) model of Huang et al.25 is interpolated to the current model grids and used as the initial
model for joint inversion. The damping and smoothing factors are chosen to be 20 and 10 after a series of trade-
off tests (Supplementary Fig. S3).
We iterate the inversion until the root-mean-square of travel-time residuals (RMS) reduces insignificantly.
After 3 iterations, the RMS is reduced from 0.29 to 0.18 s (~ 40% reduction). The relatively less RMS reduction
is because of the 3-D initial model used. The residual distribution for local earthquake and teleseismic data is
plotted separately in Supplementary Fig. S4. Both the residuals are effectively reduced and concentrated toward
zero after the inversion.
The checkerboard test is conducted for assessing general resolution power of the obtained velocity model
(Supplementary Information). In Supplementary Fig. S5, the results of the checkerboard tests show good recov-
ery in most inland region and to the east of longitude 122.1° E as well as above 30 km depth. Below 30 km, the
well-recovered region is gradually shifted eastward as the depth increases. At 90 km depth, the well-recovered
region is primarily limited beneath the Ilan plan and its east offshore. The recovered checkerboard model is then
used to calculate a resolvability index, R, at each model node (Supplementary Equation S5 and Supplementary
Fig. S5). R ranges from 0 to 1 where the value 1, 0.5, and 0 indicate the node is 100%, 0%, and − 100% recovered,
respectively. R = 0.6 is used as a lower bound for the resolvable nodes in tomographic images31.
Estimation on melt fraction and volume of magma reservoir. We calculate effective elastic moduli
of fluid-saturated porous materials using Gassmann’s relations44 as
Keff Kd Kf
Ko − Keff
=
Ko − Kd
+
, µeff = µd , (1)
ϕ Ko − Kf
where Ko , Kd and Kf represent bulk modulus for the material of the frame rock, the drained matrix, and the
saturating fluid, respectively. µd is shear modulus of the drained matrix. ϕ is porosity. For porosity below the
critical value (ϕc ) that defines the transition from a medium which is supported by the frame to a medium where
solid materials are suspended in the fluid45,
ϕ ϕ
Kd = Ko 1 − , µd = µo 1 − . (2)
ϕc ϕc
Substituting Eq. (2) into Eq. (1), the density and seismic velocities of the fluid-saturated porous material can
be obtained by
Keff + 43 µeff
µeff
ρeff = (1 − ϕ)ρo + ϕρf , VP = , VS = , (3)
ρeff ρeff
where ρo and ρf are density for the drained matrix and the saturating fluid. Given known density and seismic
velocities of frame rocks, Eq. (3) can also be used for deriving elastic moduli Ko and µo. Supplementary Table S2
collects the physical parameters of rocks and fluid for calculation, where we assume the frame rock of granite
and saturating fluid of andesitic melt for imaged magma reservoir (L1, Fig. 3). The calculation then yields a
relationship of the V
p reduction and porosity (i.e. melt fraction) as shown in Fig. 5. So, given the Vp reduction
of 19% for the magma reservoir from characteristic-model tests in Supplementary Fig. S10, the melt fraction is
estimated to be ~ 19%.
Received: 19 December 2020; Accepted: 19 February 2021
References
1. Suppe, J. Kinematics of arc–continent collision, flipping of subduction, and back-arc spreading near Taiwan. Mem. Geol. Soc. China
6, 21–33 (1984).
2. Liu, T.-K., Hsieh, S., Chen, Y.-G. & Chen, W.-S. Thermo-Kinematic evolution of the Taiwan oblique-collision mountain belt as
revealed by zircon fission track dating. Earth Planet. Sci. Lett. 186, 45–56 (2001).
3. Teng, L. S. Extensional collapse of the northern Taiwan mountain belt. Geology 24, 949–952 (1996).
4. Teng, L. S., Lee, C.-T., Tsai, Y.-B. & Hsiao, L.-Y. Slab breakoff as a mechanism for flipping of subduction polarity in Taiwan. Geology
28, 155–158 (2000).
5. Huang, H.-H., Shyu, J. B. H., Wu, Y.-M., Chang, C.-H. & Chen, Y.-G. Seismotectonics of northeastern Taiwan: Structural charac-
teristics of a transitional area from wanning collision to subduction and post-collisional extension. J. Geophys. Res. 117, B01313.
https://doi.org/10.1029/2011JB008852 (2012).
6. Wang, K.-L. et al. Post-collisional magmatism around northern Taiwan and its relation with opening of the Okinawa trough.
Tectonophysics 308, 363–376 (1999).
7. Wang, K.-L. et al. Geochemical constraints for the genesis of post-collisional magmatism and the geodynamic evolution of the
Northern Taiwan Region. J. Petrol. 45, 975–1011 (2004).
8. Konstantinou, K. I., Lin, C.-H. & Liang, W.-T. Seismicity characteristics of a potentially active Quaternary volcano: The Tatun
Volcano group, northern Taiwan. J. Volcanol. Geotherm. Res. https://doi.org/10.1016/j.jvolgeores.2006.09.009 (2007).
9. Tsai, C.-H. et al. The Keelung Submarine Volcano in the near-shore area of northern Taiwan and its tectonic implication. J. Asian
Earth Sci. 149, 86–92 (2017).
10. Kim, K. H., Chang, C.-H., Ma, K.-F., Chiu, J.-M. & Chen, K.-C. Modern seismic observations in the Tatun volcano region of
northern Taiwan: seismic/volcanic hazard adjacent to the Taipei metropolitan area. Terr. Atmos. Ocean. Sci. 16, 579–594 (2005).
Scientific Reports | (2021) 11:5286 | https://doi.org/10.1038/s41598-021-84763-z 8
Vol:.(1234567890)www.nature.com/scientificreports/
11. Tsao, S.-J. Potassium-argon age determination of volcanic rocks from the Tatun volcano group. Bull. Central Geol. Surv. 9, 137–154
(1994).
12. Wang, W.-S. & Chen, C.-H. The volcanology and fission track age dating of pyroclastic deposits in Tatun Volcano group, northern
Taiwan. Acta Geol. Taiwan. 28, 1–30 (1990).
13. Song, S.-R., Yang, T.-F., Yeh, Y.-H., Tsao, S.-J. & Lo, H.-J. The Tatun volcano group is active or extinct?. J. Geol. Soc. China 43,
521–534 (2000).
14. Chen, C.-H. & Lin, S.-B. Eruptions younger than 20 ka of the Tatun Volcano Group as viewed from the sediments of the Sungshan
Formation in Taipei Basin. West Pac. Earth Sci. 2, 191–204 (2002).
15. Belousov, A., Belousova, M., Chen, C.-H. & Zellmer, G. F. Deposits, character and timing of recent eruptions and gravitational
collapses in Tatun Volcanic Group, Northern Taiwan: Hazard-related issues. J. Volcanol. Geotherm. Res. 191, 205–221 (2010).
16. Yang, T.-F., Sano, Y. & Song, R.-S. 3He/4He ratios of fumaroles and bubbling gases of hot springs in Tatun volcano group, north
Taiwan. Nuovo Cim. 22, 281–285 (1999).
17. Lee, H.-F. et al. Temporal variations in gas compositions of fumaroles in the Tatun Volcano Group, northern Taiwan. J. Volcanol.
Geotherm. Res. https://doi.org/10.1016/j.jvolgeores.2008.06.005 (2008).
18. Lin, C.-H. Evidence for a magma reservoir beneath the Taipei metropolis of Taiwan from both S-wave shadows and P-wave delays.
Sci. Rep. 6, 39500 (2016).
19. Yeh, Y.-L., Wang, W.-H. & Wen, S. Dense seismic arrays deny a massive magma chamber beneath the Taipei metropolis, Taiwan.
Sci. Rep. 11, 1083 (2021).
20. Lin, C.-H. et al. Preliminary analysis of volcanoseismic signals recorded at the Tatun volcano group, northern Taiwan. Geophys.
Res. Lett. 32, L10313. https://doi.org/10.1029/2005GL022861 (2005).
21. Lin, C.-H. Probable dynamic triggering of phreatic eruption at the Tatun volcano group of Taiwan. J. Asian Earth Sci. 149, 78–85
(2017).
22. Lin, C.-H. Dynamic triggering of drumbeat seismicity at Tatun volcano group in Taiwan. Geophys. J. Int. 210, 354–359 (2017).
23. Wu, Y.-M. et al. Seismic tomography of Taiwan: Improved constraints from a dense network of strong motion stations. J. Geophys.
Res. 112, B08312. https://doi.org/10.1029/2007JB004983 (2007).
24. Kuo-Chen, H., Wu, F. T. & Roecker, S. W. Three-dimensional P velocity structures of the lithosphere beneath Taiwan from the
analysis of TAIGER and related seismic datasets. J. Geophys. Res. 117, B06306. https://doi.org/10.1029/2011JB009108 (2012).
25. Huang, H.-H. et al. Joint Vp and Vs tomography of Taiwan: Implications for subduction-collision orogeny. Earth Planet. Sci. Lett.
392, 177–191 (2014).
26. Huang, H.-H. et al. Investigating the lithospheric structures beneath Taiwan region by nonlinear joint inversion of local and
teleseismic P-wave data: Slab continuity and deflection. Geophys. Res. Lett. https://doi.org/10.1002/2014GL061115 (2014).
27. Chou, H.-C., Kuo, B.-Y., Chiao, L.-Y., Zhao, D. & Hung, S.-H. Tomography of the westernmost Ryukyu subduction zone and the
serpentinization of the fore-arc mantle. J. Geophys. Res. 114, B12301. https://doi.org/10.1029/2008JB006192 (2009).
28. Flinders, A. et al. Seismic evidence for signigicant melt beneath the Long Valley Caldera. Calif. Geol. 46(9), 799–802 (2018).
29. McVey, B. G. et al. Magma accumulation beneath Santorini volcano, Greece, from P-wave tomography. Geology https://doi.
org/10.1130/G47127.1 (2019).
30. Chu, R., Helmberger, D. V., Sun, D., Jackson, J. M. & Zhu, L. Mushy magma beneath Yellowstone. Geophys. Res. Lett. 37, L01306.
https://doi.org/10.1029/2009GL041656 (2010).
31. Huang, H.-H. et al. The Yellowstone magmatic system from the mantle plume to the upper crust. Science https://doi.org/10.1126/
science.aaa5648 (2015).
32. Pu, H.-C. et al. Active volcanism revealed from a seismicity conduit in the longresting Tatun volcano group of northern Taiwan.
Sci. Rep. 10, 6153 (2020).
33. Thybo, H. & Artemieva, I. M. Moho and magmatic underplating in continental lithosphere. Tectonophysics 609, 605–619 (2013).
34. Kim, K. H., Chiu, J.-M., Kao, H., Liu, Q. & Yeh, Y.-H. A preliminary study of crustal structure in Taiwan region using receiver
function analysis. Geophys. J. Int. 159, 146–164 (2004).
35. Ustaszewski, K. et al. Crust-mantle boundaries in the Taiwan—Luzon arc-continent collision system determined from local earth-
quake tomography and 1D models: Implications for the mode of subduction polarity reversal. Tectonophysics 578, 31–49 (2012).
36. Wang, H.-L., Zhu, L. & Chen, H.-W. Moho depth variation in Taiwan from teleseismic receiver functions. J. Asian Earth Sci. 37,
286–291 (2010).
37. Ching, K.-E. et al. Modern vertical deformation rates and mountain building in Taiwan from precise leveling and continuous GPS
observations, 2000–2008. J. Geophys. Res. 116, B08406. https://doi.org/10.1029/2011JB008242 (2011).
38. Chen, C.-H. Extensional collapse of the northern Taiwan mountain belt: Comment and reply. Geology 25, 855–856 (1997).
39. Shin, T.-C. Some implications of Taiwan tectonic features from the data collected by the Central Weather Bureau Seismic Network.
Meteorol. Bull. 38, 23–48 (1992).
40. Shin, T.-C., Tsai, Y.-B., Yeh, Y.-T., Liu, C.-C. & Wu, Y.-M. Strong motion instrumentation programs in Taiwan. In Handbook of
Earthquake and Engineering Seismology (eds Lee, W. H. K. et al.) 1057–1602 (Academic Press, 2003).
41. Kao, H., Jian, P.-R., Ma, K.-F., Huang, B.-S. & Liu, C.-C. Moment-tensor inversion for offshore earthquakes east of Taiwan and
their implications to regional collision. Geophys. Res. Lett. 25(19), 3619–3622 (1998).
42. Wu, Y.-M. et al. Improved seismic tomography offshore northeastern Taiwan: Implications for subduction and collision processes
between Taiwan and the southernmost Ryukyu. Geophys. J. Int. 178, 1042–1054 (2009).
43. Rawlinson, N. & Kennett, B. L. N. Rapid estimation of relative and absolute delay times across a network by adaptive stacking.
Geophys. J. Int. 157, 332–340 (2004).
44. Gassmann, F. Elastic waves through a packing of spheres. Geophysics 16(4), 673–685. https://doi.org/10.1190/1.1437718 (1951).
45. Nur, A., Mavko, G., Dvorkin, J. & Galmudi, D. Critical porosity: A key to relating physical properties to porosity in rocks. Lead.
Edge 17, 357–362 (1998).
Acknowledgements
We thank Kuo-Lung Wang, Sheng-Rong Song, and Doug Toomey for valuable discussion and Kyle Smith for
help improve the manuscript. The data are available on request by the Central Weather Bureau (https://www.
cwb.gov.tw/V8/C/E/index.html) and the Formosa Array (https://fmarray.earth.sinica.edu.tw/). This work was
supported by Ministry of Science and Technology, Grants 107-2923-M-001-006-MY3, 108-2116-M-001-009,
and 108-2119-M-001-010, and Russian Foundation for Basic Research, Grant 18-55-52003_MNT_a.
Author contributions
H.H. designed the research, E.W. and M.S. collected and processed the data; J.K., C.L., and I.K. contributed to
the discussion and interpretations; H.H. and E.W. analyzed the data and wrote the paper.
Scientific Reports | (2021) 11:5286 | https://doi.org/10.1038/s41598-021-84763-z 9
Vol.:(0123456789)www.nature.com/scientificreports/
Competing interests
The authors declare no competing interests.
Additional information
Supplementary Information The online version contains supplementary material available at https://doi.
org/10.1038/s41598-021-84763-z.
Correspondence and requests for materials should be addressed to H.-H.H.
Reprints and permissions information is available at www.nature.com/reprints.
Publisher’s note Springer Nature remains neutral with regard to jurisdictional claims in published maps and
institutional affiliations.
Open Access This article is licensed under a Creative Commons Attribution 4.0 International
License, which permits use, sharing, adaptation, distribution and reproduction in any medium or
format, as long as you give appropriate credit to the original author(s) and the source, provide a link to the
Creative Commons licence, and indicate if changes were made. The images or other third party material in this
article are included in the article’s Creative Commons licence, unless indicated otherwise in a credit line to the
material. If material is not included in the article’s Creative Commons licence and your intended use is not
permitted by statutory regulation or exceeds the permitted use, you will need to obtain permission directly from
the copyright holder. To view a copy of this licence, visit http://creativecommons.org/licenses/by/4.0/.
© The Author(s) 2021
Scientific Reports | (2021) 11:5286 | https://doi.org/10.1038/s41598-021-84763-z 10
Vol:.(1234567890)You can also read