MTU Aero Engines (MTX.DE) - Investment Memo Date: 6/11/2020; Closing stock price: €154.4 (EUR) - LRT Capital Management, LLC
←
→
Page content transcription
If your browser does not render page correctly, please read the page content below
MTU Aero Engines (MTX.DE)
Investment Memo
Date: 6/11/2020; Closing stock price: €154.4 (EUR)

Disclaimer
This report is for informational purposes only and does not constitute an offer to sell, solicitation to buy,
or a recommendation for any security, or as an offer to provide advisory or other services in any jurisdiction
in which such offer, solicitation, purchase or sale would be unlawful under the securities laws of such
jurisdiction. Any offer to sell is done exclusively through the fund's Private Placement Memorandum.

Past performance may not be indicative of any future results. No current or prospective client should
assume that the past performance of any investment or investment strategy referenced directly or
indirectly herein will perform in the same manner in the future. Different types of investments and
investment strategies involve varying degrees of risk—all investing involves risk—and may experience
positive or negative growth. Nothing herein should be construed as guaranteeing any investment
performance.

Investment funds advised by LRT Capital Management, LLC may maintain positions in the securities
discussed within. The views presented here are subject to risk and uncertainties. The views presented
herein may change without notice. For more information contact ir@lrtcapital.com.

Overview
MTU Aero Engines (“MTU”) operates in the aerospace engine market as an engine sub-system supplier
and an independent provider of maintenance, repair, and overhaul services (MRO). MTU’s business is
broken down into three divisions – commercial OEM business, military OEM business, and commercial
MRO business.

MTU’s revenues are split 40/60 between new engine manufacturing and MRO services, respectively. The
company possess significant competitive advantages, operates in an industry which has historically grown
faster than global GDP and is lead by a management team that has a long track record of intelligent capital
allocation. The company’s relatively high ROIC is underpinned by extremely high barriers to industry entry,
a very long cash conversion cycle and decades of R&D knowhow that help limit the intensity of industry
competition. Since the beginning of the year, MTU’s share price is down over 40%, representing a
compelling opportunity for investors willing to have a longer-term view of the industry’s growth prospects
beyond the current Coronavirus induced uncertainty.
Contents
Overview....................................................................................................................................................... 1
Company History .......................................................................................................................................... 3
   Stage 1: From military engine to commercial engine ............................................................................. 3
   Stage 2: Participate in engine programs and expand MRO capacities ................................................... 3
Growth Profile / Opportunity ...................................................................................................................... 4
   Air traffic ................................................................................................................................................... 4
   Opportunities in emerging markets ........................................................................................................ 5
   Increasing stake in engine programs ....................................................................................................... 6
   GTF engines opportunities ....................................................................................................................... 7
Moat ............................................................................................................................................................. 9
   Intangible assets ....................................................................................................................................... 9
   Barriers to entering the industry ........................................................................................................... 10
   Sub-system players ................................................................................................................................ 11
   High switching cost................................................................................................................................. 12
   Cost advantages ..................................................................................................................................... 12
Capital Allocation ....................................................................................................................................... 13
   Dividend policy and debt ....................................................................................................................... 13
   Acquisition .............................................................................................................................................. 13
   Balanced portfolio .................................................................................................................................. 14
   Low-cost capacity ................................................................................................................................... 16
Conclusion .................................................................................................................................................. 17
Valuation .................................................................................................................................................... 17
   P/E........................................................................................................................................................... 17
Appendix..................................................................................................................................................... 18
References .................................................................................................................................................. 21
Company History
MTU has a rich history in producing airplane engines. It started from military engines in the first 40 years
and then participated in developing commercial engines and Maintenance, Repair and Overhaul
(“MRO”) business in its second 40 years.

Stage 1: From military engine to commercial engine
1934 - The company was founded as BMW Flugmotorenbau1 GmbH which was spun-off from BMW

1940 - The plant was expanded significantly to start large-scale production of BMW 801 aircraft engines,
which powered for instance the Focke-Wulfe FW 190 fighter aircraft (Würger)

1945 - After WWII, U.S. troops occupied the factory as a U.S. Army vehicle and artillery repair shop

Late 1950s - the company resumed engine production under license agreements

1971 - MTU invaded the commercial engine market as a subcomponent manufacturer in the CF6-50
engine powering the Airbus A300

1979 - Growing demand for MRO services caused MTU to form its maintenance segment

Stage 2: Participate in engine programs and expand MRO capacities
1980s - Took stake in V25002, EJ2003, MTR3904, etc. programs

1990s - Launch of MTU Maintenance in Berlin-Brandenburg and Malaysia

2000s - Entered into a commercial core engine by providing high-pressure compressor (HPC) and low-
pressure turbines (LPT); Launch of MTU Aero Engines Polska; Took stakes in the GEnx5; launch of MTU
Maintenance with China Southern Airlines in Zhuhai, China

2011 - MTU took an 18-percent stake in the PW1100G-JM, the first engine selected to power the
A320neo; Launch of MTU Maintenance Dallas

2014 - Participated in the GE9X engine for the new “Triple Seven”

2017 - Set up a joint maintenance company for Geared Turbofan™ engines in Rzeszów, Poland

2018 - Expand capacities in Canada, Poland and Berlin-Brandenburg

1
  German, means aircraft engine construction
2
  The IAE V2500 is a two-shaft high-bypass turbofan engine which powers the Airbus A320 family (A320, A321,
A319 and the Airbus Corporate Jet), the McDonnell Douglas MD-90, and the Embraer KC-390.
3
  The Eurojet EJ200 is a military low bypass turbofan used as the powerplant of the Eurofighter Typhoon.
4
  The MTU Turbomeca Rolls-Royce MTR390 is a turboshaft developed for light helicopter applications by MTU
Turbomeca Rolls-Royce.
5
  The General Electric GEnx ("General Electric Next-generation") is an advanced dual rotor, axial flow, high-bypass
turbofan jet engine in production by GE Aviation for the Boeing 787 and 747-8.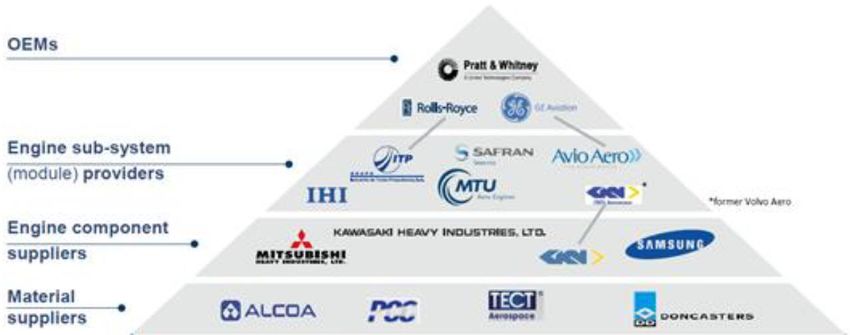
Growth Profile / Opportunity
Air traffic
Traffic is measured by Revenue Passenger Kilometers (RPK), which is calculated by the sum of kilometers
each passenger traveling in a year. In the last two decades, the growth of traffic is twice as growth of GDP
world widely. From the figure below, there are two recessions: 1) "9/11" & SARS; 2) Financial crisis. Now,
we're under Coronavirus pandemic, another aerospace recession, and the International Air Transport
Association (IATA) released updated analysis showing that the COVID-19 crisis will see airline passenger
revenues drop by $314 billion in 2020, a 55% decline compared to 2019i.

                                   9
                                            y = 0.5715e0.0321x
                                               R² = 0.9922
                                   8
                                                                                                                                                                     18
                                                                                                                                                              17
      PASSENGER-KM (IN TRILLION)

                                   7
                                                                                                                                                      16
                                                                                                                                               15
                                   6
                                                                                                                                        14
                                                                                                                                 13
                                   5                                                                                       12
                                                                                                 09                11
                                                                                                             10
                                   4
                                                                                                 07 08
                                                                                          06
                                                                                  05
                                   3                                       04
                                                        00 01 02 03
                                                 99
                                            98
                                   2
                                       45               50            55               60               65                 70                 75              80
                                                                                          GDP (IN TRILLION USD)

                                                                           Figure 1 World passenger traffic and GDPii

Regionally, all the traffic growth rates are stronger than GDP. In Asia and Pacific, an emerging market, its
traffic-to-GDP ratio is 1.6x. At the same time, the traffic growth of mature markets, such as North America
and Europe, are much higher than their GDP growth rates.
                                                          Table 1 Median traffic growth to GDP growth ratio by continent, 2007-2018

                                                                                                              Middle            Asia and            North            Latin
                                                                                Europe         Africa
                                                                                                                East              Pacific          America         America
    RPK in 2018, in billion                                                      2,175           176             758               2,871             1,852            424
    Passengers per capita                                                         1.52          0.08               0.98               0.38            1.99            0.47
    Traffic growth rate (Median)                                                 6.3%           5.8%              10.7%               9.4%           3.6%             7.7%
    Real GDP growth rate (Median)                                                1.7%           3.7%               3.0%               5.7%           2.1%             2.1%
                                                                  6
    Median traffic to GDP ratio                                                   3.9 x         1.0 x              4.5 x              1.6 x           1.7 x           3.6 x

6
    Median of traffic growth rate to GDP growth rate ratio which is calculated each year from 2007-2018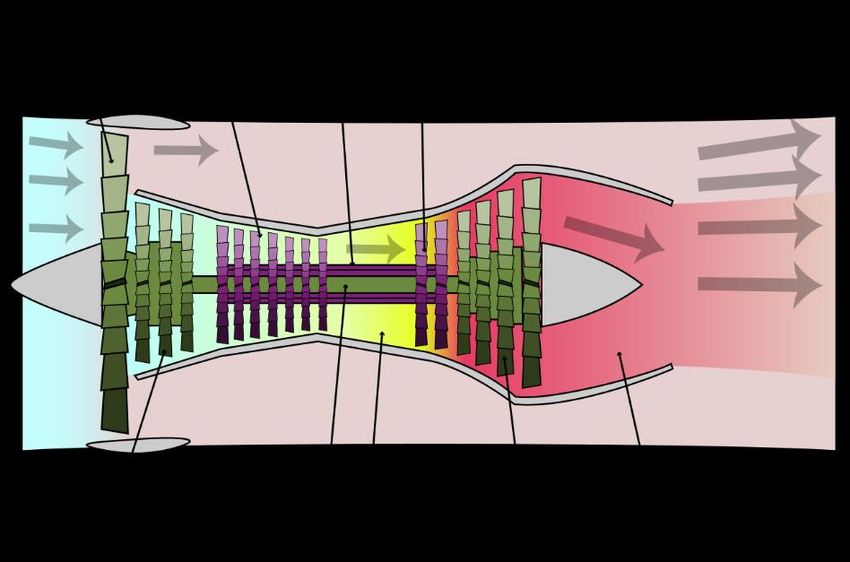
More and more people choose to travel by airplane – a trend underpinned by the fact that ticket prices
in real terms are at all time lows. Passengers per capita doubled in the last two decades. One reason for
low fares is the use of new and more efficient jet engines.

    600                                                      5%       0.60
    500                                                      0%       0.55
                                                             -5%                                                               CAGR:
    400                                                               0.50
                                                             -10%                                                              6.3%
    300                                                               0.45
                                                             -15%
    200                                                               0.40
                                                             -20%                                   CAGR:
    100                                                      -25%     0.35                          3.4%
                                                                                CAGR:
     0                                                       -30%     0.30      1.3%
          2001
          1995
          1997
          1999

          2003
          2005
          2007
          2009
          2011
          2013
          2015
          2017
          2019
                                                                      0.25

                   Average Fare, Inflation-Adjusted ($)               0.20

                                                                             1997
                                                                                    1999
                                                                                           2001
                                                                                                  2003
                                                                                                          2005
                                                                                                                 2007
                                                                                                                        2009
                                                                                                                                2011
                                                                                                                                       2013
                                                                                                                                              2015
                                                                                                                                                     2017
                   Cumulative from 1995 (%)

      Figure 2 Annual U.S. domestic average itinerary fare                             Figure 3 World passenger per capita

Opportunities in emerging markets
As air traffic is highly correlated with GDP, the opportunity in emerging markets cannot be overlooked.
Boeing forecasts the growth rate of traffic, fleet and services in Asia-Pacific are 5.5%, 4.6% and 5.1%,
respectively in next two decades. Airbus’s forecast for traffic growth is 5.4% in Asia-Pacific. We believe
the Coronavirus pandemic will only temporarily affect the demand for air travel, with the long-term trend
of RPKs growing faster than GDP reasserting itself over the next twelve months. The figure below speaks
to the enormity of the growth opportunity for travel in Emerging Markets.

               70,000

               60,000                                                                                                             USA
                                                     JPN
               50,000

               40,000

               30,000

               20,000                                 RUS
                                    BRA
               10,000         IND IDN   MEX
                                        CHN
                    PAK
                     0               ETH
                          0        500   1,000     1,500    2,000    2,500   3,000         3,500         4,000      4,500         5,000

                              Figure 4 GDP per capita (Y in $) and RPK per capita (X) for top 10 populations7

7
 GDP, constant 2010 USD; USA: United States; JPN: Japan; RUS: Russian Federation; MEX: Mexico; CHN: China;
BRA: Brazil; IDN: Indonesia; ETH: Ethiopia; IND: India; PAK: Pakistan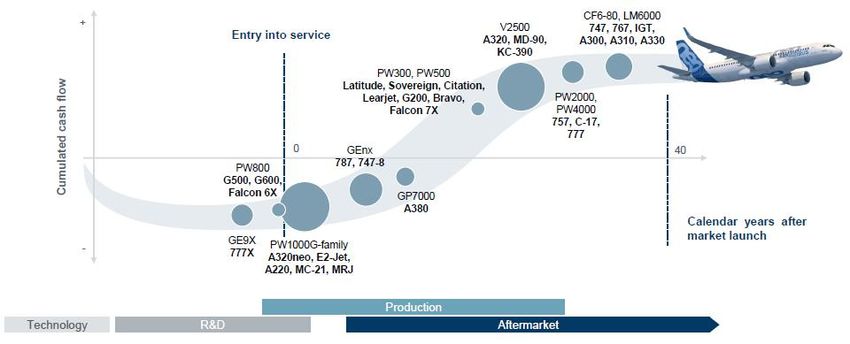
Increasing stake in engine programs
The market that MTU operates in has historically grown faster than GDP and within this fast growing
market MTU continues to take market share by increasing its stake of many important risk and revenue
sharing partnership (RRSP) with other OEMs or sub-system suppliers.

For a jet engine maker, it is crucial to be part of a successful engine program – a decision made by the
aircraft companies (predominantly Airbus and Boeing). As the figure below shows, MTU has significant
shares between 6% and 21% in many of the most important Narrow and Widebody engine programs
which provides high visibility on the future OEM revenue developmentiii.

                               Figure 5 MTU's shares in major civil engine programs

The group is currently stepping up from a former 9-12% typical involvement to a figure in the range of 14-
18%. On the widebody programs, MTU’s highest stake in the past used to be on the PW2000, with a 21.5%
stake. The program was ended in 2005 and since then the GP7000 for the A380 has taken over the position
with a 22.5% stake. The ramp-up of this aircraft will further push new engine salesiv.

MTU has succeeded in securing future revenue from the fast growing single-aisle airplane market. The
PW1000G engine, codeveloped with Pratt & Whitney is one of the two engine options powering the
A320neo – the fastest selling airplane in the history of the world. Moreover, MTU is targeting up to 25%
share on Gen2 GTF.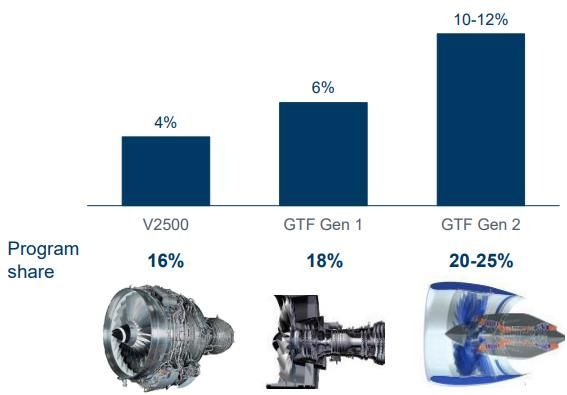
Figure 6 Program share for V2500/GTF engines Figure 7 MTU stake in narrow engine programs
GTF engines opportunities
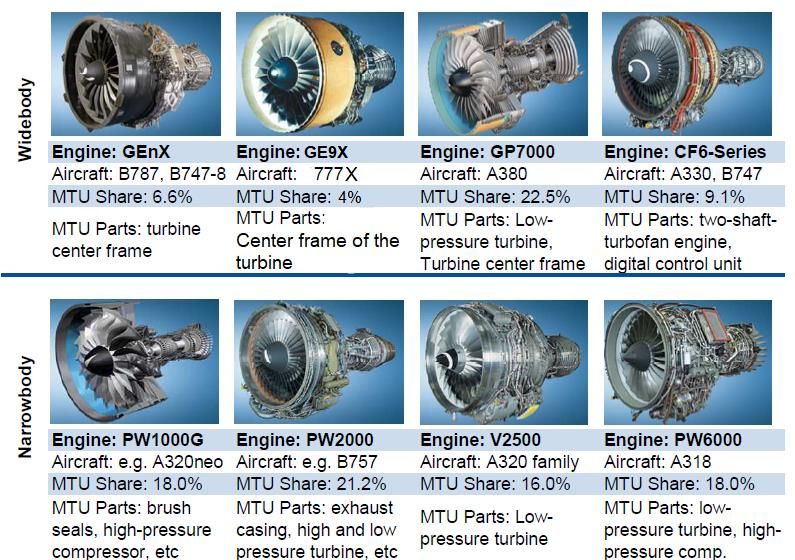
Geared Turbofan Engines (“GTF”) are developed in conjunction with Pratt & Whitney (one of the largest
engine OEMs) and entered series production in early 2016 for Airbus A320neo. The GTF reduces fuel
consumption – decreasing carbon dioxide emissions by ~16% compared to engines like the V2500. The
GTF engine powers five aircraft platforms, with the Airbus A220, the Airbus A320neo family, and Embraer
E190-E2 already in commercial service.
Figure 8 GTF powered aircrafts
PW1100G-JM powering the A320neo will be the key revenue driver in coming years. PW1100G-JM (A320
family) covers roughly 55% of the total GTF order book. At the end of April 2020, ~1,300 A320neo family
jets have been delivered with ~7,400 remaining in the backlog. The A320neo is dual engine – offering both
the GTF and the LEAP-1 engine made by CFM (a joint venture of Safran and GE). As the decided order book
of the A320neo family, 3,027 orders chose LEAP engine by Safran, while 2,066 orders chose GTF engine.
In other words, ~40% of the orders selected PW1100G-JM as their engines for A320neo family jets.
We believe that the GTF taking “only” 40% of the orders on the A320neo reflects the perceived risk and
uncertainty of this new engine type. The GTF is after all a completely new design architecture, while the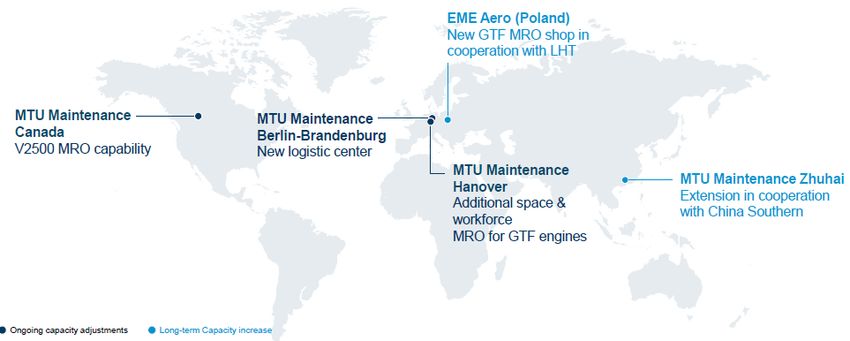
LEAP-1 engine uses a more traditional engine setup but pushes the limits of material science to achieve
extremely high pressures and temperatures which aid engine efficiency. However, it may be the case that
the LEAP-1 engine represents the limits of efficiency that can be achieved in this design paradigm, with
further engine efficiency gains coming for optimizing the GTF design. Royce Rolls, for example, is currently
working its next generation of engines which it calls the “Ultrafan” – itself a GTF design. If the GTF is in
fact the breakthrough needed to achieve higher engine efficiency, we would expect the share of the GTF
engines to grow on future airplane models.

PW1500G is also the exclusive engine option designed for the A220 family (former Bombardier C-Series
regional jet) – delivering ~20% lower fuel burn per seat than previous generation aircraft, half the noise
footprint, and decreased emissions. As of April 2020, Airbus received 755 orders, delivering 113 of them.

Embraer’s E190-E2 and E195-E2 chose PW1900/1700 as their engines. At the end of 2019, the company
received 171 orders of these two jets.
                                     Table 2 GTF engine breakdown by aircraft

   Breakdown by aircraft      A220-100      A220-300        A320neo          A321neo   E190-E2    E195-E2
                 Orders             94           548           3948             3413        27        144
              Deliveries            40            73            961              326        11          7

MTU estimates that the GTF engine fleet will increase to ~15,000 in 2030 – backed by the strong demand
of the A320neo GTF engine. MTU will benefit from the strong demand of narrow-body jets over the course
of the next few decades. Since Airbus has now surpassed Boeing in the narrow-body and regional jet
market, MTU’s GTF exposure will continue to gain MRO revenue as sales increase. MRO revenue is
relatively predictable and high margin, allowing for revenue and profit visibility many years into the future.

                                        Figure 9 GTF engine fleet forecast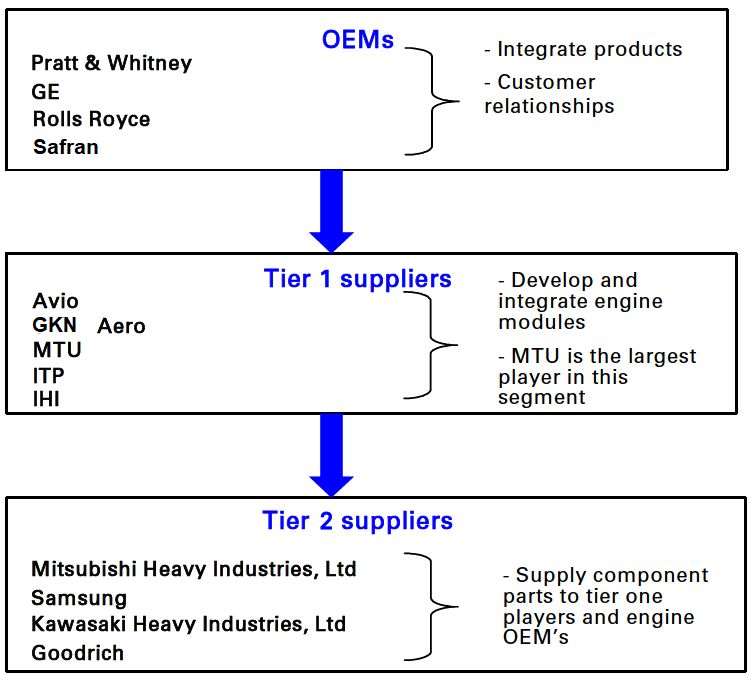
Moat
MTU Aero Engines benefits from high barriers to entry in its core aero engine markets. At first, the high
upfront costs and rich experience are required to develop a new engine and the long time to generate
returns. Secondly, the airline industry is so conservative that OEMs prefer to corporate with reliable
suppliers under long-term contracts or RRSP8. It means stable cash flows from profitable MRO after sales.
Thirdly, Certification requirements and regulatory approvals also protect the company from new entrants.
Lastly, political preferences help the company get military OEM orders in Europe. The competition is in an
oligopolistic structure throughout the complete engine value chain since entry barriers and capital
requirements are very high.

Intangible assets
MTU is not responsible for building the whole engine but for supplying the largest engine OEM
manufacturers (GE, Pratt & Whitney and Rolls-Royce) with the respective engine sub-system. The level of
specialization in the industry is high, and every player has its focus with regard to their modules and
technologiesv. MTU focus on the High-Pressure Compressor (HPC) and the Low Pressure Turbine (LPT).

                                              Figure 10 Engine value chain

Here is how a turbofan worksvi:

Step 1: Suck. Thrust creation begins at the inlet where a large-diameter fan rotates thousands of times
per minute, taking in massive amounts of air. Some of the air makes its way to the combustor, where it
undergoes the fuel ignition sequence, while the majority of the air bypasses the core and enters a narrow
fan duct where its speed increases before exiting at the rear.

Step 2: Squeeze. The remaining airflow enters the low- and high-pressure compressors where it passes
through a series of rotating and stationary blades. During this stage, as the air is squeezed, the air-pressure
ratio can reach 40-to-1 while air temperatures rise several hundred degrees.

Step 3: Burn. This high-pressure air then moves into the combustor, where fuel is added, and the mixture
is ignited. The resulting energy spins both the high- and low-pressure turbines, which are connected

8
    RRSP: • Risk and revenue sharing partnership
concentrically via shafts to the compressors and the fan at the front of the turbofan engine. As the
turbines turn, so do the fan and the compressors, creating the engine's continuous process of air intake
and expulsion.
Step 4: Blow. After powering the turbines and decreasing in pressure, the air moves to the exhaust
assembly and exits the engine, providing the remaining thrust.
Figure 11 Structure of turbofan engine
Barriers to entering the industry
High capital investments and long cash conversion cycle
The aero engine industry’s business model consists of selling the original equipment at a loss, and then
recouping economic value over the engine’s life though the sale of high margin spare parts and services.
This creates significant entry barriers to new entrants. The players in the industry have a well-balanced
engine portfolio that utilizes the cash from mature engine programs to research, develop new engines, as
well as absorb the loss from selling the engines in the early stages of production. On the other hand, the
lifespan of a typical engine program is ~40 years, which is a very long time to achieve a full payoff on an
investment program.
Historical accumulation of experience
Extensive experience, the strong ‘know-how’ in engine technologies, patents, and scale advantages have
enabled the few players to continue to capture and grow their aero engine business. MTU started as a
BMW aero engine company and built numerous BMW 801 engines for the famous fighter aircraft during
WWII. Moreover, Safran and Royce-Royce began making aircraft engines simultaneously in 1914; Pratt &
Whitney started its first engine program in 1925, etc. Players are also required to master the wholeprocess – going from design to final production requires a complete system-integration knowledge and
capability.
Closed partnership within the few players
Risk and Revenue Sharing Partnership (RRSP) builds a solid relationship between OEMs (Rolls-Royce, Pratt
& Whitney or GE) and sub-system providers (MTU, IHI, GKN, etc.). Partner takes an equity stake on an
individual engine program by RRSP. Furthermore, the partners usually join the new engine RRSP together
after the previous engine reach to the end. MTU key competences lie within low-pressure turbines and
high-pressure compressors. The high-pressure compressor and the low-pressure turbine each account for
10%-15% of the value of an engine. Due to the long life of aero engine programs (30-40 years), these
permanent relationships provide good revenue visibility into the future.
All three of these factors make the industry more and more consolidated…with fewer players every year.
Nowadays, there are only four major engine OEMs and five Tier 1 suppliers in the value chain.
Sub-system players
Compared to GE, Pratt & Whitney, Rolls-Royce and even Safran, MTU operates at a lower tier of the aero
engine industry, acting as a tier one supplier rather than a prime contractor or integrator of complete
engines. However, MTU still has full design authority for its module work and significant technology
expertise in design and production of these complex components. Within the tier-one supplier base, MTU
competes with IHI, ITP, GKN Aero, and Avio. The level of specialization in the industry is high, and every
player has its focus with regard to their modules and technologies.
Figure 12 Key aero engine players and industry structure
IHI is Japan’s leading maker of jet engines. IHI collaborates in international projects to develop and supply
both large and small engines, components, and modules for all types of civilian aircraft. IHI focuses on fan
modules and shafts. IHI participated in the V2500 program (for Airbus A320ceo), PW1100G-JM (for Airbus
320neo), GEnx (for Boeing 787 and 747-8), etc.
ITP Aero is a Rolls-Royce Group corporate entity as a Tier 1 supplier to the main aircraft engine
manufacturers and is responsible for the design, development, production, and assembly of enginesubsystems and components, including the low-pressure turbine (LPT). ITP focuses on the low-pressure
turbine on wide-body aircrafts. ITP also joined the PW1000G program for A320neo as a supplier who
designs and produces inter-turbine structures, external connection systems, and integrated bladed rotors.
GKN Aero (historically Volvo Aero) is a leading Tier 1 provider of high performance metallic and composite
structural engine components. GKN focuses on regional and narrow-body jets. GKN Aerospace is a risk
and revenue sharing collaborator (RRSP) directly with Pratt & Whitney. GKN has design and production
responsibility for the intermediate compressor cases and the turbine exhaust cases for the entire Geared
Turbofan family.
Avio Aero is a GE Aviation business which designs, manufactures, and maintains components and systems
for civil and military aviation. Under the PW1100G-JM engine program, Avio designs and produces the
gear system, the accessory gearbox, and the oil tank for the engines.
High switching cost
Not only engines and parts need to be certified by the authorities but also the engine manufacturers and
the suppliers. MTU holds certificates from the world’s major aviation authorities: EASA, FAA, and CAAC.
The individual locations of the MTU Maintenance network additionally hold all relevant approvals
required by and issued in the respective countries.
The risk and revenue sharing agreements span over the full lifetime of an engine program making it
impossible for new entrants to break into the OEM partnerships. Furthermore, the aircraft manufacturers
close long-term contracts with the OEMs to equip the airplanes with the chosen engine types also
preventing new entrants from winning contracts with existing aircraft programsvii.
As a result, airlines cannot switch their engine because of certification and regulation. This means MTU
has a steady cash flow when providing spare parts and MRO services as a subsystem supplier. Due to the
rising complexity of engine design, and the extremely high upfront development costs, the trends in the
industry has been for airframe makers to over fewer engine options than in the past. For example, 737
Max only chose the Leap-1 engine by CFM and Airbus 320neo chose Leap-1 and PW1100G. Table 4 in
appendix shows a detailed list of all the engines of major fleets.
Table 3 Engine options (new vs previous)
Number of new options Number of previous options
737 1 1
747 1 2
767 1 3
777 1 3
A320 2 2
A330 1 3
A350 1 2
Cost advantagesviii
MRO is highly competitive with shops competing globally on quality, speed and price. MTU has focused
on the motto “Repair beats Replacement” which is aligned with their customers’ focus to keep
maintenance costs down. MTU’s MRO IP revolves around advanced repair capability which helps keepcost down for Airlines. MTU serves as an independent performing MRO on non-MTU engines where it
does not have the conflict of interest that engine OEM providers have had whereby replacing instead of
repairing a part would provide high margin spare part revenues. MTU operates the service centers in
Germany, Poland, Canada, U.S. and China and own test benches for important maintenance programs.
Capital Allocation
Management has a clear priority list for capital allocation. MTU has focused on increasing market share
around its core competency as an aero engine subsystem supplier by acquiring program shares. ~55% FCF
is used for capital expenditure; ~15% FCF is used for M&A and ~30% is used for dividends.
Dividend policy and debt
Table 4 Capital Allocation
Capital expenditure M&A Dividends
% of Free cash flow 55% 15% 30%
The median of Net Debt-to-EBITDA ratio is 0.7x and MTU pays ~30% of adjusted net income as dividends
since 2006.
2.0 x 40%
1.5 x
35%
1.0 x
0.5 x 30%
0.0 x
2010
2006
2007
2008
2009
2011
2012
2013
2014
2015
2016
2017
2018
2019
25%
-0.5 x
-1.0 x 20%
2006
2007
2008
2009
2010
2011
2012
2013
2014
2015
2016
2017
2018
2019
Net Debt/EBITDA Median
Figure 13 Net Debt to EBITDA Figure 14 Dividend payout ratio
Acquisition
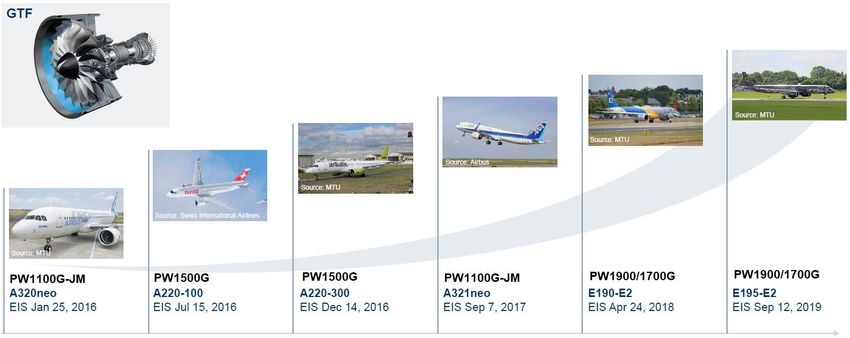
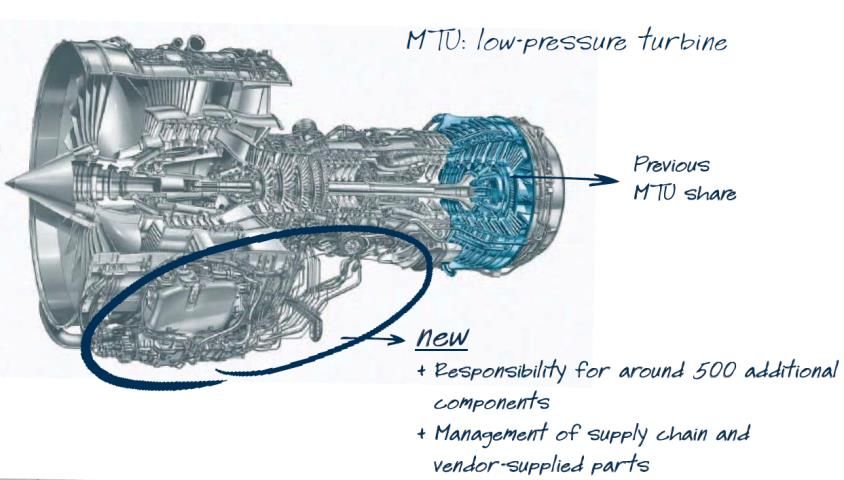
In 2012, Pratt & Whitney purchased the Rolls-Royce V2500 program share in the IAE collaboration and
MTU Aero Engines has increased its program share from 11% to 16% via a separate risk revenue sharing
agreement with Pratt & Whitney, which cost €541.1 million. The V2500 (for A320ceo family) is MTU’s
most important commercial engine program. By increasing its share in this program, MTU expects to
generate additional revenue worth three to four billion Euros over next 25 years. The company’s share in
the MRO business for this engine also increased. After applying the new RRSP, MTU takes theresponsibility for ~500 additional components and manages the supply chain, as well as the vendor-
supplied parts (Figure 15).
Figure 15 MTU increases its share in the IAE 2500 program
On December 19, 2008 MTU acquired a 6.65 % stake in the GEnx engine program for the Boeing 787 and
747-8 through a cooperation agreement between the General Electric Company and MTU Aero Engines
GmbH, Munich. The investment in this new engine program in 2008 is included in the capital expenditure
of the OEM business as an intangible asset valued at an amount of € 126.1 million.
Balanced portfolio
The balanced portfolio of MTU shown in the graph below is the key for maintaining a solid free cash flow
and value creation in the group while growing with new engines.
Figure 16 Cumulated cash flow of MTU's portfolio and products
Developing a new type of engine has a very long payback period. The company need to invest in research
and development at first five years. However, the new engine has to be sold with substantial discounts
which makes the profits close or even below to zero. Typically, after about 7-years of services the engine
undergoes its first overhaul and engine companies get cash and profits from MRO services. It usually takes
about 15 years for an engine company to achieve cash breakeven since starting R&D. And this is called
Time & Materials (T&M) based aftermarket model. However, about half of new deliveries are under Flight
Hour Agreements (FHA), where cash is received as the aircraft is flown i.e. immediately upon entry intoservice rather than after 5-7 years upon the first overhaul as under a Time & Materials model. The FHA
model help MTU achieve a more stable cash flow, but at the same time it also means that the company
must invest to lower maintenance cost to improve margins on fixed cost contracts.
In Figure 17, the capital expenditure on intangible assets in the OEM segment is related to the
capitalization of self-generated development work for MTU’s engine programs as well as acquisition cost
in 2012. The capital expenditure on PP&E in the OEM segment is related to building new facilities or
expanding the capacities. The capital expenditures under MRO is mostly related to expanding capacity.
800 300 10%
700 250 8%
600 200
6%
500 150
400 4%
100
300 50 2%
200 0 0%
2017
2008
2009
2010
2011
2012
2013
2014
2015
2016
2018
2019
100
0
2011 2012 2013 2014 2015 2016 2017 2018 2019
Investment in R&D (in €m, LHS)
OEM: intangible assets OEM: PP&E MRO As % of revenue (RHS)
Figure 17 Capex by segment, €m Figure 18 Investment in R&D
The long-term nature of the investment required in this industry is underscored by the company’s
experience with the A320neo. Originally planned for 2014, the first delivery of the A320neo with
PW1100G engine slipped to early 2016. Lufthansa took delivery of the first A320neo on January 20, 2016.
However, MTU started investing R&D heavily since 2011 and need to keep investing during the whole life
of the GTF engines.
Table 5 Capex program, 2011-2019
OEM: intangible assets OEM: PP&E MRO
PW1100G, GE38 helicopter
2011 New site in Portland
engine, GEnx
Stake in IAE, V2500, PP&E for blisk manufacturing facility
2012 Intangible assets and PP&E
PW1100G, GE38 in Munich
PW1133G-JM, PW1524G, Expansion of the Polish site and
2013
PW1700G, PW1900G, GE38 PP&E; construction of new logistics
2014 center in Munich
GTF9, GE38, GE9X, PW800 Expansion of the Polish site and
2015 New and replacement
PP&E
purchases of PP&E
Ramp-up to series production of the
2016 GTF, T408, GE9X, PW800
GTF programs
2017
Expansion of production capacity for Capacity-related new and
2018 GTF, GE9X, PW800
GTF programs replacement purchase
2019
9
GTF include PW1100, PW1500, PW1700 and PW1900 series engineLow-cost capacity
MTU invested in new capacity and development expenditure which consumed significant portions of
internally generated cashflows. Since 2000, MTU substantially increased its share of MRO business
performed low-cost countries – primarily Poland and China with the launches of new MRO shops in those
countries. MTU refers to these locations as “best cost”.
Figure 19 Expansion of MRO network
MTU is going to increase capacity at best cost locations, such as strengthen partnership with China
Southern, Lufthansa Technik (LHT) in Poland, Malaysia, etc. The company plan to increase the weight of
capacity at best-cost locations to 50% in 2029.
Figure 20 Increase capacity at best-cost locationsConclusion
MTU Aero Engines is the largest independent Tier-1 civil aero engine supplier and provider of aero engine
MRO services in the world. MTU possess all three characteristics we look for in a business at LRT – moat,
growth, and capital allocation skills. The moat is extremely wide – high capital investments with long cash
conversion cycle, sticky contracts, and certifications. Over the last two decades, the growth of air traffic
has doubled that of worldwide GDP…with plenty of runway still to go – the long-term growth of air traffic
cannot be ignored.
We believe that recent volatility provides an opportunity for long term investors as MTU’s price has
dropped significantly due to the COVID-19 pandemic. Investors are afraid that air traffic may be in for a
secular decline…when this is not the case. We believe the aero industry is still young and will continue to
outpace GDP.
LRT believes that MTU Aero Engines (MTX.DE) stock price is about to take off…
Valuation10
Price to Earnings Enterprise Value to Adj. EBITDA
17.4 x 10.4 x
30.0 x 14.0 x
25.0 x 12.0 x
10.0 x
20.0 x
8.0 x
15.0 x
16.9 x 6.0 x
10.0 x 4.0 x 6.4 x
5.0 x 2.0 x
0.0 x 0.0 x 2014
2019
2005
2006
2007
2008
2009
2010
2011
2012
2013
2015
2016
2017
2018
2005
2006
2007
2008
2009
2010
2011
2012
2013
2014
2015
2016
2017
2018
2019
EV/Adj.EBITDA
P/E Median P/E since 2005
Meidan EV/EBITDA since 2005
Figure 21 Historical P/E and median Figure 223 Historical EV/EBITDA and median
10
As 5/15/2020Appendix
Table 6 Engines and planes in major fleets
Manufacturer Plane Type Plane Name Built On Order Seats Engine Engine Manufacturer Engines
Boeing Narrow 737 Total 7376 4298
737 MAX 387 4246 138-230 LEAP-1B CFM (GE+Safran) 2
737 NG 6989 52 126-220 CFM56-7B CFM (GE+Safran) 2
Wide 747 Total 154 17
747-8 47 410 GEnx-2B GE 4
747-8F 107 17 GEnx-2B GE 4
Wide 767 Total 881 86
767-300F 225 51 CF6-80C2B7F GE 2
767-300ER 583 218-269
357 CF6 GE 2
195 JT9D Pratt & Whitney 2
31 RB211 Rolls-Royce 2
767-2C 73 35 PW4062 Pratt & Whitney 2
Wide 777 Total 1861 375
777-300ER 838 18 396 GE90-115BL GE 2
777-200ER 422 273
161 GE90 GE 2
93 PW4000 Pratt & Whitney 2
168 Trent 800 Rolls-Royce 2
777X 309 309 384-426 GE9X GE 2
777-200LR 61 1 317 GE90-115BL GE 2
777F 231 47
Wide 787 Total 1510 538
787-9 877 335 296
520 183 GEnx-1B GE 2
252 47 Trent 1000 Rolls-Royce 2
105 105 TBD 2
787-8 422 48 248
271 30 GEnx-1B GE 2Manufacturer Plane Type Plane Name Built On Order Seats Engine Engine Manufacturer Engines
140 7 Trent 1000 Rolls-Royce 2
11 11 TBD 2
787-10 211 155 336
148 109 GEnx-1B GE 2
59 42 Trent 1000 Rolls-Royce 2
4 4 TBD 2
Airbus Narrow A220-100 94 54 100-120 PW1500G Pratt & Whitney 2
Narrow A220-300 548 475 120-150 PW1500G Pratt & Whitney 2
Narrow A318 80 0 90-110
CFM56 CFM (GE+Safran) 2
PW6000 Pratt & Whitney 2
Narrow A319ceo 1486 7 110-140
IAE V2500A5 IEA (Pratt & Whitney + MTU 2
+ Japanese Aero Engines)
CFM56-5B CFM (GE+Safran) 2
Narrow A319neo 84 82 120-150
PW1100G-JM Pratt & Whitney 2
LEAP-1A CFM (GE+Safran) 2
Narrow A320ceo 4770 20 140-170
CFM56-5B CFM (GE+Safran) 2
IAE V2500 IEA (Pratt & Whitney + MTU 2
+ Japanese Aero Engines)
Narrow A320neo 3948 2987 150-180
PW1100G-JM Pratt & Whitney 2
LEAP-1A CFM (GE+Safran) 2
Narrow A321ceo 1791 34 170-210
IAE V2500 IEA (Pratt & Whitney + MTU 2
+ Japanese Aero Engines)
CFM56-5B CFM (GE+Safran) 2
Narrow A321neo 3413 3087 180-220
LEAP-1A CFM (GE+Safran) 2
PW1100G-JM Pratt & Whitney 2Manufacturer Plane Type Plane Name Built On Order Seats Engine Engine Manufacturer Engines
Wide A300 561 0 247
CF6-50/CF6-80 CFM (GE+Safran) 2
JT9D/PW4000 Pratt & Whitney 2
Wide A310 255 0 220-240
CF6-80 CFM (GE+Safran) 2
JT9D/PW4000 Pratt & Whitney 2
Wide A330-200 660 18 210-250
CF6-80E GE 2
PW4000 Pratt & Whitney 2
Trent 700 Rolls-Royce 2
Wide A330-200F 41 3
PW4000 Pratt & Whitney 2
Trent 700 Rolls-Royce 2
Wide A330-300 785 14 250-290
PW4000 Pratt & Whitney 2
CF6-80E GE 2
Trent 700 Rolls-Royce 2
Wide A330-800 14 14 220-260 Trent 7000 Rolls-Royce 2
Wide A330-900 319 273 260-300 Trent 7000 Rolls-Royce 2
Wide A340-200/300 246 0 210-290 CFM56-5C CFM (GE+Safran) 4
Wide A340-500/600 131 0 270-370 Trent 500 Rolls-Royce 4
Wide A350-900 760 439 300-350 Trent XWB Rolls-Royce 2
Wide A350-1000 170 129 350-410 Trent XWB-97 Rolls-Royce 2
Wide A380 251 9 400-550
GP7200 IEA (Pratt & Whitney + MTU 4
+ Japanese Aero Engines)
Trent 900 Rolls-Royce 4References
i
COVID-19 Puts Over Half of 2020 Passenger Revenues at Risk https://www.iata.org/en/pressroom/pr/2020-04-
14-01/
ii
ICAO, https://www.icao.int/about-icao/Pages/annual-reports.aspx
iii
Hauck & Aufhäuser Institutional Research
iv
MainFirst Research
v
ESN equine bank
vi
Turbofan Engine: How It Works by Bethany Whitfield
vii
Hauck & Aufhäuser Institutional Research
viii
Barclays Equity ResearchYou can also read