International Journal of Nanotechnology & Nanomedicine - Opast
←
→
Page content transcription
If your browser does not render page correctly, please read the page content below
ISSN: 2476- 2334

Research Article                         International Journal of Nanotechnology & Nanomedicine
Easy Synthesis Method of MoS2/TiO2 Nanostructure with Great Performance of
Catalytic Activity Under Visible Light
Sara Chahid*, Rodrigo Alcántara, and Desireé M de los Santos

                                                                            Corresponding author
                                                                            *

                                                                            Sara Chahid, Facultad de Ciencias, Universidad de Cádiz, Campus de Puerto
Facultad de Ciencias, Universidad de Cádiz, Campus de Puerto
                                                                            Real, 11510, Puerto Real, (Cádiz), Spain, E-mail: sara10chahid@email.com
Real, 11510, Puerto Real, (Cádiz), Spain
                                                                            Submitted: 04 Jan 2019; Accepted: 10 Jan 2019; Published: 23 Apr 2019

            Abstract
            In this study, TiO2 nanoparticles modified with MoS2 were synthesized using the low temperature hydrolysis method.
            Samples of pure TiO2 and samples of MoS2/TiO2 were prepared using different amounts of MoS2 (1.0% and 10.0% by
            weight). The samples were annealed at 500°C and 700°C and characterised by ICP-AES, XRD, Raman, FT-IR, TG,
            XPS and DR-UV-Vis spectroscopy. The results suggest that the MoS2 added during synthesis is a satisfactory source
            of Mo to produce doping of the TiO2 structure. In addition, the transformation of anatase phase to rutile is delayed
            when the concentration of Mo incorporated into the structure increases. Finally, the effectiveness of the synthesized
            MoS2/TiO2samplesused as photocatalyst for the photodegradation of methylene blue dye under visible light irradiation
            was investigated. TiO2 doped with MoS2 was shown to improve the degradation of methylene blue under visible light.
            There was found to be an optimal temperature and level of doping to achieve improved photocatalytic activity, in our
            case 10.0% MoS2/TiO2 at 700°C.

Keywords: Photoelectrochemisty, Photocatalyst, Structural                       of these properties on photocatalytic efficiency by means of the
Analysis, Spectroscopy                                                          photodegradation of methylene blue under visible light.

Introduction                                                                    Experimental
Photocatalysis has become established as a promising technology                 Chemicals
for water treatment and is widely applied for purifying polluted                All the reagents were from commercial sources and used without
water. In recent years, titanium dioxide (TiO2) has been considered             further purification. Titanium (IV) n-butoxide (TNB, 97%) was
an excellent photocatalyst due to its good long-term stability                  from Sigma-Aldrich; nitric acid (HNO3, 65%) was from Merck;
against photo and chemical corrosion, low cost and lack of toxicity             and MoS2 powder was from Sigma-Aldrich; and methylene blue
[1,2]. However, the band gap of TiO2 is in the UV range of the                  (MB, purity 82%) was supplied by Panreac.
electromagnetic spectrum, which is a limitation in photocatalytic
applications as it only uses a small fraction of solar radiation. Society       Synthesis
is demanding efficient methods for eliminating pollutants, one way              MoS2/TiO2 samples were synthesized using a low temperature
being to extend the photo-response range of TiO2 towards the visible            hydrolysis reaction by means of a procedure reported previously
region to improve its photocatalytic efficiency. Many strategies                by the authors [26]. (a) 100 mL of deionized H2O was cooled at
have been used to improve the photocatalytic properties of TiO2,                4°C in order to slow down the hydrolysis reaction, and in same time
including forming hetero-structures (FeO3-TiO2, SnO2-TiO2, etc.), or            to control the crystallinity of the samples. (b) During the cooling
doping with non-metals (N, F, etc.), or metals. The use of transition           process 4°C, a stoichiometric amount of MoS2 was added to obtain
metals such as Cu, Cr, Ni, V, Fe, for doping TiO2 has been widely               theoretical proportions of x%MoS2/TiO2 (x% = 1.0%, 10.0% of
researched [3-21]. Although less common, TiO2 doped with Mo has                 MoS2 added). (c) after that, 10 mL of n-butoxide source was slowly
been shown to have great potential as a photocatalyst [22-24]. In this          dripped into the mixture under magnetic stirring and the samples
study, TiO2 was synthesized using the low-temperature hydrolysis                allowed to react for 30 min. (d) then, 4 mL of HNO3 was added,
method with MoS2 as the source of Mo. An analysis was performed                 and the mixture was stirred for 2 h; (e) after this, a rotavapor was
of the influence of the percentage of doping and the annealing                  used to evaporated the surplus solvent under vacuum at 60°C, and
temperature on the structural, electronic and optical properties of             subsequently on a hotplate at 100°C until complete removal.
the nanoparticles synthesized. In addition, the appearance of the
Burstein-Moss effect in the highly doped samples, characterized by              Finally, as-prepared MoS2/TiO2 samples were annealed in air for 1
a shift towards the blue end of the absorption spectrum, was also               h at 500°C and 700°C.
analysed [25]. Finally, a study was carried out into the influence              Also, pure TiO2 was synthesized using the same procedure in order
Int J Nanotechnol Nanomed, 2019                               www.opastonline.com                                          Volume 4 | Issue 1 | 1 of 8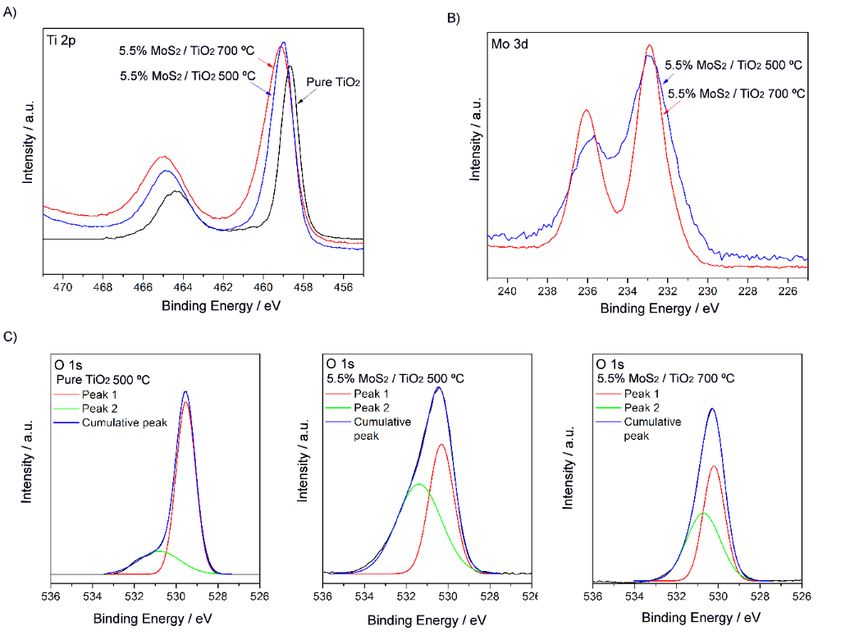
to compare the results obtained.                                             Table 1: Real weight percentage of Mo versus TiO2 determined
                                                                             by ICP-AES
Characterization                                                              Initial %MoS2      T / ºC      Mo (%w/w)       % Mo incorporated
To characterize the pure TiO2 and MoS2/TiO2 samples and to                         added                                         (%w/w)
understand how MoS2 affected their photocatalytic properties,
                                                                                                500 °C         ≤0.10*                   -
different instrumental techniques were used to determine the                       0.0%
proportion of MoS2 and its location in the structure, their crystalline                         700 °C         ≤0.10*                   -
phases and band gap energy.                                                                     500 °C      0.59 ± 0.02              59.0%
                                                                                   1.0 %
                                                                                                700 °C      0.64 ± 0.04              64.0%
The composition of the MoS2/TiO2 samples was studied by inductively
coupled plasma atomic emission spectroscopy (ICP-AES) using an                                  500 °C      4.45 ± 0.01              44.5%
                                                                                  10.0%
Iris Intrepid spectrometer, supplied by Thermo Elemental©. Also, the                            700 °C      5.50 ± 0.10              55.0%
identification of the crystalline phases and estimation of the crystallite   *Percentage lower than the detection limit of analytical method
size was performed by x-ray diffraction (XRD) using an instrument
supplied by Bruker©, model D8Advanced. The XRD spectra were                  XRD analysis
recorded with 2θ in the 20-70° range by step scanning, using steps
of 0.02º, a fixed counting time of 0.1 s/ step, 40 kV and 30 mA. The
characterization was completed using Raman spectroscopy. Raman
spectra were registered in a backscattering geometry using a Jobin
Yvon U1000 double monochromator equipped with a Hamamatsu
R-943 photomultiplier, using a DPSS 532 nm laser supplied by
CNI©, model MSL-III-532nm-50mW. Also, XPS experiments were
performed using monochromatized Al Kα radiation (1486.6 eV),
and a 20 eV pass energy to record the spectra. The binding energy
scale was referred to the C1s signal at 284.8 eV, and given with             Figure 1: XRD patterns of pure TiO2 annealed at (A) 500 °C and
an accuracy of 0.1 eV. The spectra were collected using a Kratos             (B) at 700°C
Axis UltraDLD spectrometer. Moreover, UV-Vis spectroscopy in
diffuse reflectance mode (DR-UV-Vis) was used to study the optical           It is well known that the crystallinity and crystalline phase of
properties of the samples and to determine the band gap energy. The          the titanium dioxide TiO2 semiconductor strongly based on the
equipment, assembled in our laboratory, was composed of a Xenon              annealing temperature [27]. This, could have a positive impact on
lamp, model ASB-XE-175, supplied by Spectral Products©, as the               photocatalytic activities. The XRD patterns of the TiO2 powders
illumination source; a USB2000+ spectrometer supplied by Ocean               annealed at different temperatures in air for 1 hour are displayed in
Optics©; and an integrating sphere from Spectra Tech©. Finally, the          Figure 1. As Figure 1 shown all obtained samples are crystalline.
photocatalytic activity of the MoS2/TiO2 samples synthesized was             Further, the XRD pattern of pure TiO2 calcined at 500°C exhibited
analysed. The evaluation of the photodegradation of methylene blue           the intense diffraction peak at 2θ = 25.5° which IS assigned to anatase
(MB) was performed using a halogen lamp as the visible irradiation           phase, also a few peaks related to rutile phase was detected, this
source. The initial concentration of the aqueous solution of MB              implied the coexistence of both anatase-rutile phases of TiO2 in the
(purity 82%, Panreac) was 4.10-5 M, and the amount of photocatalyst          sample annealed at 500°C [28,29]. However, this peak become more
was 0.3 gL-1. The reaction time was 6 hours, and the mixture                 and more weaker as the annealing temperature increased, as Figure
of the photocatalyst and MB solution was kept in darkness for 3              1B displayed. Further, a peak with high intensity was appeared at
hours before the VIS irradiation to reach the adsorption-desorption          2θ=27.3°, which correspond to rutile phase [30]. Additionally, the
equilibrium. The photodecomposition of MB was studied using                  characteristic diffraction peaks in this sample become more. This
the concept of Degradation = (A0-At)/A0, where A0 is the initial             found results indicating that the crystallinity level was improved.
absorbance at the start of the test and At is the absorbance at time t,
both measured at 663.97 nm. The absorbance was measured using
a spectrometer supplied by Ocean Optics©, model USB4000+, and
a UV-VIS-NIR light source supplied by Ocean Optics©, model
DH-2000-BAL [27].

Results and Discussion
ICP-AES
ICP-AES was used to determine the amount of Mo introduced
into the MoS2/TiO2 heterostructure synthesized. The theoretical
MoS2/ TiO2 weight proportions added were 1.0%, and 10.0%. The                Figure 2: XRD patterns of pure TiO2 and MoS2/ TiO2 as-prepared
percentages of Mo in the synthesized samples annealed at 500°C               samples annealed at (A) 500 °C and (B) at 700 °C.
and 700°C are shown in Table 1. ICP analysis indicated that 45-
64% of the Mo sources had been successfully introduced into the              The XRD study of the MoS2/TiO2 with different amount of MoS2
TiO2 structure. However, the percentage of Mo incorporated with              (0.0, 1.0, and 10.0%) after thermal treatment was performed, which
regard to that added was seen to decrease slightly as the percentage         confirmed the transformation of the synthetized samples from
of MoS2 added in the synthesis increased.                                    amorphous phase to a crystalline phase, as Figure 2 depicted. The
                                                                             XRD diffraction peaks of pure TiO2 calcined at 500°C contains a
Int J Nanotechnol Nanomed, 2019                                www.opastonline.com                                        Volume 4 | Issue 1 | 2 of 8
mixture of anatase and rutile phase as discussed above. However,             (t) was calculated from the full width at half-maximum (FWHM)
for MoS2/TiO2 samples, the diffraction peaks at 2θ= 25.4°, 27.2°,            according to the Scherrer equation: t=(0.9.λ)/β.cosθ, where λ is the
36.5°, 38.7°, 48.3°, 55.1°, 55.2°, 64.2°,and 67.3°,which consistent          wavelength of the X-Ray radiation (1.5406 Å) and β is the full width
with (101), (100), (101), (004), (200), (105), (211), (002)and (116)         at half-maximum height of the most intense peak of the sample[34].
planes respectively, those signals are good matching to the anatase          The relative contents of anatase (WA) and rutile (WR) phase given
phase and reference (File No. JCPDS: 21-1272) [31]. Moreover,                in mass fraction were estimated using the relative intensity of the
the widths of the main diffraction peak of anatase in MoS2/TiO2              rutile (110) peak using the following formula: WR=1/(1+1.81.IA/
become broadening, suggesting a clear decrease in particle size [32].        IR) and the relative contents of anatase were estimated as WA=100-
                                                                             WR; that is, only anatase and rutile phases were considered [34].
With the increase in temperature to 700°C, the peak assigned to rutile       IA and IR are the relative intensities of the (101) peak of anatase
phase detected in pure TiO2, was disappeared in MoS2/TiO2 samples,           and (110) peak of rutile, respectively. Furthermore, the volume of
and all the diffraction peaks belong to anatase phase still present,         the unit cell was calculated from the values of the lattice constant
which confirms that the MoS2 added stabilize the anatase phase of            a, b and c corresponding to the maximum intensity peak as V =
TiO2 even dough at high annealing temperatures. Interestingly, no            a2.c (a = b ≠ c, for anatase and rutile phases). The values of a and c
evidence of any additional peaks assigned to MoS2 phases such as,            were estimated from the two peaks in the patterns with the highest
MoO2, and TiS2, were detected to be present in the XRD patterns of           intensity using the typical equation for tetragonal systems: 1/d2=
the synthesized samples. That could be a good indication of effective        [(h2+k2)/ a2] + (l2/c2), where d is the interplanar distance from Bragg’s
dispersion of MoS2 due to their small crystallite particle size, finding     law, and h, k, l are the Miller indexes of the planes used [34,35].
results confirmed the structure of unique crystal phase of MoS2/TiO2         The values obtained for these properties are shown in Table 2. The
was successfully synthetized [33]. Further, the intrinsic structure of       incorporation of MoS2 delayed the anatase-to-rutile transformation,
TiO2 was kept after annealing process.                                       anatase being the predominant phase in the samples annealed at
                                                                             500°C and 700°C, while rutile was the predominant phase only
Further, from the XRD patterns, a semi-quantitative assessment was           in the pure TiO2 annealed at 700°C. Also, according to the semi-
performed of several crystalline properties, such as the percentage          quantitative estimation of the amount of anatase and rutile phase,
of anatase (WA) and rutile (WR) phases, the average crystallite              the percentage of rutile phase decreased when the amount of Mo
size (t) and the unit cell volume (V). The average crystallite size          increased.
Table 2: Semi-quantitative values of anatase and rutile mass fraction, average crystallite size, unit cell volume obtained from
XRD patterns of the samples synthesized
      T / °C           MoS2 / %            WA / %            WR / %              t / nm            a, b / Å            c/Å               V / Å3
                          0.0               62.39              37.61             10.91              3.81               8.90             129.32
     500 °C               1.0              100.00              0.00               7.53              3.79               9.51             136.26
                          10.0             100.00              0.00               3.50              3.78               9.13             130.54
                          0.0               19.21              80.79             27.00              4.59               2.77              58.38
     700 °C               1.0               55.90              44.10             21.04              3.78               9.60             137.20
                          10.0              76.90              23.10             16.69              3.76               9.14             129.40

Table 2 shows the values of the average crystallite size (t) as a function   may diffuse towards the surface of the crystal producing a structural
of the annealing temperature; the higher the annealing temperature,          reorganisation in which the Mo is distributed near to the surface, the
the higher t, because of particle fusion of the nanocrystals. On the         interior being left with a lower Mo content [42]. Consequently, it
other hand, the evolution of t in relation to the percentage of MoS2         has less tension, which would explain the greater crystalline quality
added showed that t decreased as the percentage of MoS2 increased.           observed in the 10% MoS2/TiO2 samples.
The introduction of Mo into the structure can create structural
distortions that break the crystal continuity, thereby obtaining smaller     SEM analysis
average crystallite sizes, as reported for other dopants, such as Al,        Figure 3 presented SEM image of the synthetized MoS2/TiO2
Cu or Tm. Thus, doping with Mo inhibits crystal growth and delays            nanoparticles. Homogenous clusters with pores were formed in
the transformation of anatase to rutile [11, 36-39].                         the MoS2/TiO2 nanoparticles as SEM image displayed. The particle
                                                                             size of the MoS2/TiO2 porous structure is in nano-metric scale.
Moreover, the peaks can be seen to shift and widen (Figure 1).
As the ionic radius of Mo ions (0.62 Å) is very similar to that of
Ti ions (0.68 Å), the Mo ions could substitute Ti ions in the TiO2
lattice and the distortions observed may be a result of this [40,41].
However, in the 10.0% MoS2/TiO2 samples the loss of crystallinity
was not as significant. Analysing the cell parameters of pure TiO2
and MoS2/TiO2 shown in Table 2, it is possible to see that parameters
a and c change slightly and the volume of the MoS2/TiO2 cells
decreases as the percentage of MoS2 increases, the cell volume of
the 10.0% MoS2/TiO2 sample becoming similar to that of the pure
TiO2. This suggests that as the level of doping increases, the Mo            Figure 3: SEM image of the synthetized MoS2/TiO2 nanoparticles

Int J Nanotechnol Nanomed, 2019                                www.opastonline.com                                        Volume 4 | Issue 1 | 3 of 8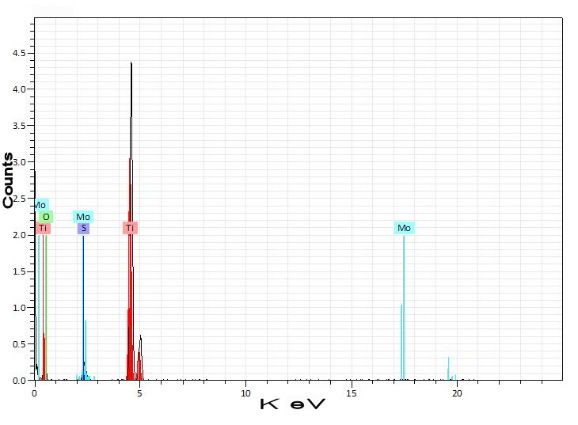
The chemical composition of the synthetized samples was study           Figure 6A and B presented the UV-Vis spectra in (DRS) for the
using EDS analysis, the obtained EDS spectra is presented in Figure     pure TiO2 and MoS2/TiO2 with different amount MoS2 concentration
4. As can be seen Figure 4, the MoS2/TiO2 nanoparticles mainly          (1.0%, and 10.0%) annealed at 500°C and at 700 °C, respectively.
contained Mo, Ti, S, and O.                                             Figure 6 A and B presented the Tauc plot using Kubelka-Munk
                                                                        equation of different samples depicting Kubelka-Munk plots, where
                                                                        Figure 6C and D displayed the corresponding ([F(R).hv]1/2) against
                                                                        energy plot for the estimation of indirect band gap of the synthesized
                                                                        samples annealed at 500°C and at 700°C [50-52].

                                                                        The effective indirect band gap of the synthesized samples was
                                                                        obtained by the extrapolation of the linear portion at [F(R).hv]1/2 =
                                                                        0 [53,54]. The pure TiO2 nanoparticles show a large fundamental
                                                                        absorption edge at around 775 nm which attributed to intrinsic
                                                                        indirect band gap of the TiO2 [55]. The MoS2/TiO2 samples exhibited
                                                                        a broad blue shift absorption edge compared with pure TiO2. The
                                                                        incorporation of MoS2 onto TiO2 crystal lattice, lead to a significant
                                                                        increase of the visible light absorption due to the MoS2 quantum
Figure 4: EDS analysis of the synthetized MoS2/TiO2 nanoparticles       confinement effect. With narrow band gap energy (1.23 eV), MoS2
                                                                        material consider as an excellent candidate for the solar light-driven
Raman analysis                                                          applications [56]. Again, the bulk MoS2 had a small band gap 1.23
Figure 5 displayed the Raman spectra of the pure TiO2 and MoS2/         eV, corresponding to the absorption edge at long wavelength (λ =
TiO2 synthesized samples annealed at 500°C (Figure 5A) and at           1040 nm) [57].
700°C (Figure 5B). TiO2 is a semiconductor material type-n, which
is full of vacancy defects [43]. Raman spectra of the synthesized       However, the MoS2 in nano-scale, i. e., nanoparticles ranging from
samples displayed anatase and rutile phases of TiO2. Specifically,      8 nm to 10 nm, showed the adsorption in visible sunlight zone with
anatase shows six Raman active modes: Eg (1), Eg (2), B1g (1),          wavelength approximately around 700 nm, while when the particle
A1g+B1g (2), and Eg (3) at 144 cm-1, 197 cm-1, 399 cm-1, 519 cm-1,      size decrease further, the absorption wavelength observed at 470
and at 639 cm-1 [44].                                                   nm [58]. The particle size of the obtained MoS2/TiO2 nanoparticles
                                                                        under this study, varying from 27 nm to 3.5 nm. As a results, the
However, rutile phase presented four active Raman modes: B1g,           absorption edge of the synthesized samples has been extended to
Eg, A1g, and B2g at 143 cm-1, 477 cm-1, 612 cm-1 , 826 cm-1 [45].       visible region of the sunlight spectrum [59]. It was reported in
Finding results indicate that Mo ions were well dispersed into TiO2     literature that the strong quantum confinement effect observed in
lattice structure. Further, broadening and blueshift were observed      MoS2 nanoparticles was responsible of the wide blue shifts observed
in the main anatase peak Eg (1) in samples.                             in those samples [60-63]. Interestedly, also the quantum confinement
                                                                        effect is responsible for the shift observed in the redox potential
In addition, at 700°C plus the shift observed in Eg (1), peaks at 510   and of the.
cm-1 and 630 cm-1 seem to displaced towards higher band, also this
effect indeed increased with introduced Mo amount concentration         Table 3: Band gap energy values for the pure TiO2 and MoS2/
augmented. Thus, confirm the successful substitution of Ti by Mo        TiO2 samples synthesized
ions, which generates the tensions and distortions in the crystalline           T / °C             Initial % MoS2              Eg / eV
structure.                                                                                              added
                                                                                 500                                            2.93
As a consequence, decrease in particle size and shift in the Raman                                       0.0
bands [26,46-49]. The Raman spectra results are in good accordance               700                                            2.98
with the XRD analysis discussed above.                                           500                                            2.72
                                                                                                         1.0
                                                                                 700                                            2.75
                                                                                 500                                            2.50
                                                                                                        10.0
                                                                                 700                                            2.73

                                                                        Table 3 shows the calculated band gap values of the pure TiO2 and
                                                                        MoS2/TiO2 nanoparticles calcined at various temperatures (500°C
                                                                        and 700°C). The effective intrinsic band gap of TiO2 was found
                                                                        decreased after the incorporation of MoS2, that might be beneficial
Figure 5: Raman spectra of the synthesized samples annealed at:         to reach a high performance of the visible light photodegradation of
(A) 500°C, (B) 700°C.                                                   organic dye methylene blue. Due to the combination between TiO2
                                                                        and MoS2 nanoparticles structures, the strong band bending at the
UV-Vis spectroscopy analysis                                            interface improved and become more efficient entre TiO2 and MoS2
To investigate the optical response of the pure TiO2 and MoS2/TiO2      porous nanoparticles. So, the obtained MoS2/TiO2 nanostructures
synthesized samples, the diffuse reflectance spectra (DRS) of the       would be highly sensitive to the visible sunlight irradiation with
nanoparticles powder were recorded.                                     the expectation of the enhancement of the visible light driven

Int J Nanotechnol Nanomed, 2019                            www.opastonline.com                                      Volume 4 | Issue 1 | 4 of 8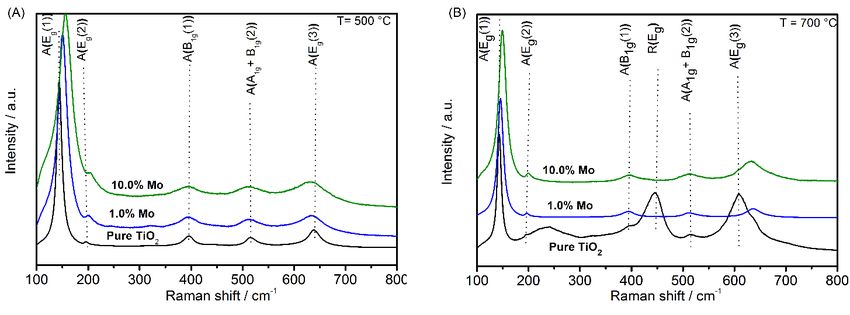
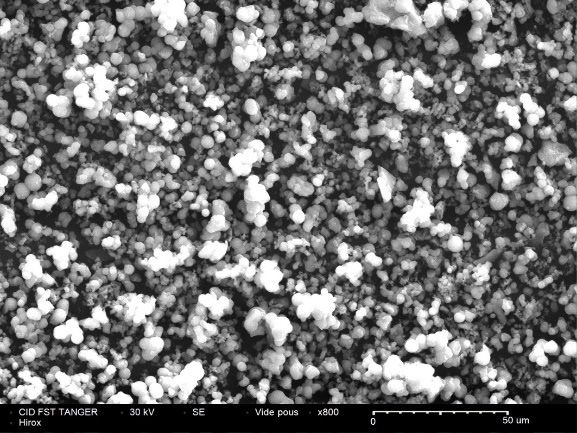
photodegradation of methylene blue.                                      The XPS spectra of O 1s for pure TiO2 and 5.5% MoS2/TiO2 annealed
                                                                         at 500°C and 700°C (Figure 7(c)) show a signal composed of a
                                                                         main peak and another less intense contribution at a higher binding
                                                                         energy. For pure TiO2, the O 1s signal can be decomposed into two
                                                                         peaks; the main peak located at a binding energy about 529.5 eV
                                                                         is assigned to O2− in TiO2 lattice, and the small left shoulder peak
                                                                         at about 530.8 eV to adsorbed species, such as hydroxyl groups,
                                                                         or water [71].

                                                                         Further, for the 5.5% MoS2/TiO2 samples, a wider, asymmetric
                                                                         peak shifted towards a higher binding energy is observed. The
                                                                         peak located at a binding energy of 530.3-530.4 eV is assigned to
                                                                         O2– in the lattice linked to Mo (OMo−O) [72,73]. Furthermore, an
                                                                         increase is observed in the signal of the peak assigned to adsorbed
                                                                         species, suggesting that the doping produced charge deficiency in
                                                                         the structure. Since a titanium atom needs two oxygen atoms, and
                                                                         a molybdenum atom needs three oxygen atoms, the structure is
                                                                         oxygen deficient.

Figure 6: Absorption edge of the pure TiO2 and MoS2/TiO2                 This can be compensated for by oxygen atoms absorbed onto
synthesized samples annealed at: (A) 500°C, (B) 700°C. The               the surface of the doped sample[41], atoms that are beneficial to
corresponding Tauc plot of the synthesized samples annealed at           photocatalytic activity [74].
(C) 500°C and (D) 700°C, considering the intrinsic band gap of
TiO2 as reference.

XPS analysis
The XPS spectra of pure TiO2 and 5.5% MoS2/TiO2 were recorded.
Figure 7a shows the Ti 2p peaks. Pure TiO2 shows two peaks located
at binding energies (BE) of 458.7 eV and 464.4 eV corresponding
to Ti 2p3/2 and Ti 2p1/2 states of stoichiometric TiO2, respectively,
which is consistent with the values of Ti4 + in TiO2 lattice reported
in the literature.

The typical value reported for Ti(IV) is 458.66 eV, while for Ti(III),
Ti(II) and Ti(0) they are 457.13 eV, 455.34 and 453.86 eV [64]. In
turn, the distance between the BE of Ti 2p3/2 and Ti 2p1/2 was around
5.71 eV, which is consistent with previous results for Ti(IV) [65].

For the 5.5% MoS2/TiO2 samples annealed at 500 °C and 700 °C,
the binding energies of Ti 2p3/2 and Ti 2p1/2 were 459.18-459.93 eV      Figure 7: XPS spectra for samples synthesized of Ti 2p (a), Mo3d
and 464.93 eV, respectively, which are consistent with the presence      (b) and O 1s (c)
of Ti4+ in the TiO2.
                                                                         The photocatalytic activity mechanism of MoS 2/TiO 2
The shift of the peaks towards a higher binding energy observed in       nanoparticles
the 5.5% MoS2/TiO2 samples with regard to pure TiO2 may be caused        The photocatalytic efficiency of the MoS2/TiO2 samples annealed at
by Mo, which may be an indication that Mo did indeed substitute          500°C and 700°C were studied by means of the photodegradation
Ti atoms in TiO2 lattice [41,66].                                        of methylene blue under visible light.

Mo 3d3/2 and 3d5/2 peaks of the 5.5% MoS2/TiO2 sample annealed           A blank experiment without a catalyst was performed and no
at 500°C and 700°C are shown in Figure 7(b). The Mo 3d signal            significant degradation of the MB was found.
shows the presence of a doublet peak structure at 235.67-236.05
eV and 232.92-232.93eV for the samples annealed at 500°C and             In addition, to determine the time taken to reach the adsorption-
700°C, characteristic of Mo6 + ions [67,68].                             desorption equilibrium a preliminary test was performed involving
                                                                         keeping the mixture of the photocatalyst and MB solution in the
The separation between the two peaks is around 2.8-3.1 eV, in            dark for 8 hours. The samples reached the adsorption-desorption
agreement with the values reported in the literature [41,69]. The        equilibrium in 3 hours.
typical value for Mo 3d5/2 reported for Mo(VI) is 232.5 eV, while for
Mo(IV) and Mo(V) they are 229.7 eV and 231.4 eV.47 No Mo4+ or            Therefore, to analyse the photodegradation of the MB, the samples
Mo5+ peaks were observed, indicating that the main oxidation state       were kept in the dark for 3 hours and after this time the irradiation
of Mo in the samples was +6 [70].                                        with visible light began. The irradiation time was 6 hours and the
                                                                         test lasted 9 hours in total.

Int J Nanotechnol Nanomed, 2019                             www.opastonline.com                                     Volume 4 | Issue 1 | 5 of 8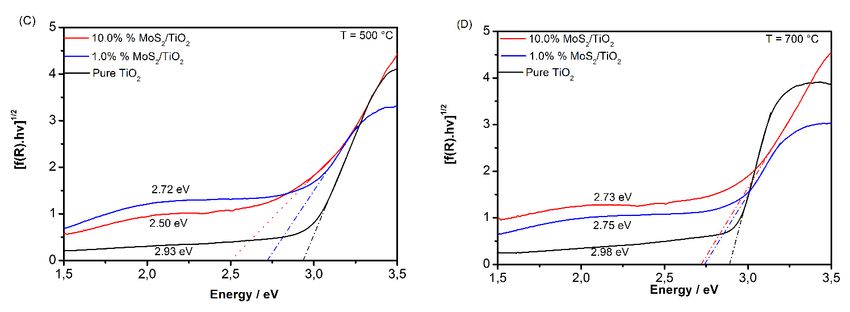
For comparison purposes, the measurements of the photodegradation          Additionally, although the predominant phase was anatase, in the
of the methylene blue were performed using the pure, synthesized           samples annealed at 700°C there was also a certain amount of rutile
TiO2 photocatalyst and commercial TiO2 (Degussa P25) under the             phase (Table 2). The heterojunction in the phases in the doped samples
same conditions.                                                           contributed to the charge separation, reducing the recombination
                                                                           of electron-hole pairs and thus improving photocatalytic activity
The results of total degradation after 6 hours of visible light            [76-79].
irradiation are shown in Table 4.
                                                                           In turn, particle size is known to be an important parameter influencing
Table 4: Percentage of photodegradation of methylene blue                  photocatalytic efficiency. The electron-hole recombination rate may
using the photocatalysts studied under visible light after 6 hours         depend on the particle size. Table 2 shows that the particle size (t)
of irradiation                                                             decreased as the percentage of Mo increased. It is well known that
 Photocatalyst      Un-annealed        T = 500 °C        T = 700 °C        in the nanometer-size range, the physical and chemical properties of
                                                                           semiconductors are modified (compared with bulk). Small variations
    P25 TiO2           40.1%                -                 -
                                                                           in particle diameters lead to great modifications in the surface/bulk
    Pure TiO2             -              34.6%             24.2%           ratio, thus influencing the recombination rates of volume and surface
   1.0%MoS2/                                                               electrons and holes [80]. A smaller particle size also produces a
                          -              64.7%             73.0%           greater specific surface. After doping, the Mo6+ ions replace Ti4+
      TiO2
  10.0%MoS2/                                                               ions in the TiO2 lattice, creating an oxygen deficiency that may be
                          -              85.1%             87.4%           compensated by oxygen atoms absorbed onto the surface of the
      TiO2
                                                                           doped sample [41]. In addition, the Mo6+ ions can act as electron traps
Figure 8 shows the evolution with the irradiation time of the              to promote charge separation, thus reducing the recombination rate
percentage of degradation of the MB photocatalyst for the samples          of the photogenerated carriers [69]. These photogenerated electrons
under study.                                                               trapped by Mo6+ may be transfered to the oxygen molecules adsorbed
                                                                           onto the surface, which would get the necessary electrons to form
A degradation of up to 40.1% can be observed for the P25 sample,           H2O2, HO2-and O2- species that also enhance photocatalytic activity
somewhat higher than for the pure TiO2 samples synthesized and             [41,81]. However, among the photocatalysts annealed at a 700°C,
annealed at 500ºC and 700ºC. In turn, the percentage degradation of        the photocatalytic activity of 1.0% MoS2/TiO2 (85%) was slightly
MB increased when using the samples that incorporate Mo (see Table         lower than the 10.0% MoS2/TiO2 sample (87%) [82].
4). For the samples annealed at 500ºC, a percentage degradation of
approximately up to 85% is observed for the sample incorporating           Further, the kinetic reaction of the synthesized samples was
10.0% of MoS2.                                                             investigated, and the photodegration of methylene blue followed
                                                                           first-order kinetics, the Kapp which is the apparent kinetic reaction
However, the photocatalytic activity of the samples annealed at            rate constant was obtained by the use of the formula (1):
700°C is greater than that of the samples annealed at 500°C, except
for the pure TiO2 samples. In this case the difference can be attributed      ln C0 / Ct = Kapp t,                           (1)
to the greater presence of rutile phase, which is less active.
                                                                           where C0 and Ct are the concentration of methylene blue at time =
                                                                           0 and at t.
                                                                           Table 5 displayed the obtained values of Kapp of each catalyst used for
                                                                           methylene blue degradation measurements. When the experimental
                                                                           data fitted with formula 1, the apparent constant reaction rate (Kapp)
                                                                           for the methylene blue degradation were calculated to be 0.0004,
                                                                           0.0453, 0.1139, 0.1577, and 4.7853h-1 for methylene blue in absence
                                                                           of catalyst, pure TiO2, P25, 1.0% MoS2/ TiO2, and 10.0% MoS2/
                                                                           TiO2, respectively.

Figure 8: Visible spectra of synthesized samples (A), and (B)              Additionally, the photocatalytic performance of MoS2/TiO2
photodegradation of methylene blue under visible light irradiation         nanoparticles for methylene blue degradation under sun light
using the synthesized samples as photocatalyst                             irradiation was 5 times faster than that of pure TiO2.

The results from DRX and Raman spectroscopy show that the                  Table 5: The obtained apparent constant reaction rate constant
samples annealed at 700°C had greater crystallinity than those             Kapp values
                                                                                                                     Kapp (h )
                                                                                                                            -1
annealed at 500°C. Good crystallinity is very important in                  Catalysts
photocatalytic activity because it results in better movement of the        Without catalyst                                 0.0004
charge carriers [75]. Further, the recombination between TiO2 with
MoS2 was favorable thermodynamically, and due to the presence               Pure TiO2                                        0.0453
of Mo ions, successful separation of photoexcited electron-hole             P25                                              0.1139
pairs prolonged the lifetime of photoexcited pairs. Thus effectively        1.0%MoS2/ TiO2                                   0.1577
suppressed the recombination of electron-hole pairs, resulting an
                                                                            10.0%MoS2/ TiO2                                  4.7853
enhance the photocatalytic activity of TiO2.

Int J Nanotechnol Nanomed, 2019                               www.opastonline.com                                       Volume 4 | Issue 1 | 6 of 8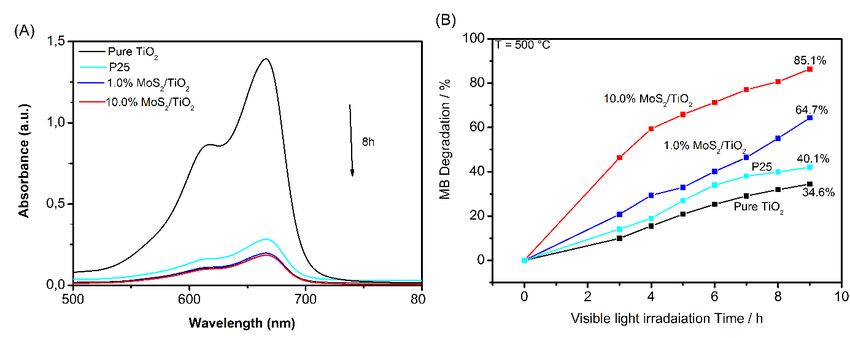
Therefore, the result observed for the synthetized sample suggests   5.    Guo Q, Zhang ZH, Ma XP, Jing K, Shen ML, et al. (2017)
that the MoS2/TiO2 nanoparticles samples can be an excellent               Separation and Purification Technology 175: 305-313.
candidate as photocatalyst for the degradation of MB under visible   6.    Ryu SW, Kim E J, Ko SK, Hahn SH (2004) Mater Lett 58:
light irradiation when it compared with pure TiO2, as Figure 9             582-587.
displayed. According to reports, the photocatalytic mechanism        7.    Shakir S, Khan Z S, Ali A, Akbar N, Musthaq W (2015) J Alloy
within MoS2/TiO2 nanoparticles could be explained by following             Compd 652: 331-340.
reasoning; under visible light irradiation, the electron could be    8.    Zhou W, WL, Wang J, Qu Y, Yang Y, et al. (2014) J Am Chem
transited from the conduction band (CB) of MoS2 nanoparticles              Soc 136: 9280-9283.
to CB of TiO2 [59,61,83]. In aqueous solution, the photoexcited      9.    Krishnakumar V, Boobas S, Jayaprakash J, Rajaboopathi M,
electron will scavenged by the oxygen coming from the water,               Han B, et al. (2016) Journal of Materials Science-Materials in
which lead to generation of hydroxyl radicals and decontaminate            Electronics 27: 7438-7447.
the organic pollutants [83]. Due to presence of the elements N and   10.   Zhou L, Wei LG, Yang YL, Xia X, Wang P, et al. (2016) Chem
S in the methylene blue (C16H18CIN3S) colorant, so the complete            Phys 475: 1-8.
degradation of this colorant can be expressed as follows:            11.   Navas J, Sanchez-Coronilla A, Aguilar T, De los Santos DM,
                                                                           Hernandez NC (2014) Nanoscale 6: 12740-12757.
                                                                     12.   Nishiyama N, Kozasa K, Yamazaki S (2016) Appl Catal a-Gen
                                                                           527: 109-115.
                                                                     13.   Wojtaszek K, Tyrala K, Czapla-Masztafiak J, Sa J, Szlachetko
                                                                           J (2016) Chem Phys Lett 664: 73-76.
                                                                     14.   Zhu JL, Xia XF, Zhu SS, Liu X, Li HX (2016) Chem J Chinese
                                                                           U 37: 1833-1839.
                                                                     15.   Fu YH, Sun L, Yang H, Xu L, Zhang FM, et al. (2016) Appl
                                                                           Catal B-Environ 187: 212-217.
                                                                     16.   Haider AJ, Najim AA, Muhi MAH (2016) Optics
                                                                           Communications 370: 263-266.
                                                                     17.   Singla P, Pandey OP, Singh K (2016) International Journal of
                                                                           Environmental Science and Technology 13: 849-856.
                                                                     18.   Zhang DR, Jin XZ, Li JH (2016) Mater Chem Phys 176: 68-74.
                                                                     19.   Beauger C, Testut L, Berthon-Fabry S, Georgi F, Guetaz L
                                                                           (2016) Microporous and Mesoporous Materials 232: 109-118.
Figure 9: The schematic representation of the charge transfer        20.   Birben NC, Uyguner-Demirel CS, Sen Kavurmaci S, Gurkan
mechanism in MoS2/TiO2 samples with improved photocatalytic                YY, Turkten N, et al. (2017) Catal Today 281: 78-84.
activity compared with pure TiO2 nanoparticles.                      21.   Wang QY, Jin RC, Zhang M, Gao SM (2017) J Alloy Compd
                                                                           690: 139-144.
Conclusions                                                          22.   Di Paola A, Garcia-Lopez E, Marci G, Marti C, Palmisano L,
In summary, the synthesized MoS2/TiO2 nanoparticles with improved          et al. (2004) Appl Catal B-Environ 48: 223-233.
visible sun light driven photocatalytic activity were successfully   23.   Devi LG, BNM (2008) Characterization of Mo doped TiO2 and
obtained by the use of low temperature hydrolysis and their                its enhanced photo catalytic activity under visible light Catal
photocatalytic activity for the degradation of methylene blue were         Lett 125: 320-330.
reported. Uniform morphology and decrease in particle size were      24.   Li CX, Zhang D, Jiang ZH, Yao ZP, Jia FZ (2011) New J Chem
obtained in synthesized MoS2/TiO2 nanoparticles samples. The               35: 423-429.
highest photocatalytic activity was showed by the sample with        25.   Munir S, Shah SM, Hussain H, Ali khan R (2016) Materials
10.0% MoS2/TiO2 nanoparticle annealed at 700°C, since it has               & Design 92: 64-72.
the appropriate amount of MoS2 concentration for suppressing         26.   Alcántara R, Navas J, Fernández-Lorenzo C, Martín J, Guillén
recombination of the photogenerated electron-hole and prolonged            E, et al. (2011) Phys Status Solidi C Curr Top Solid State Phys
the electron life-time. Indeed, the 10.0% MoS2/TiO2 nanoparticles          8: 1970-1973.
show highest value of the apparent photocatalytic reaction rate      27.   Cheng L, Kang Y, Tong F (2012) Effect of preparation conditions
constant about 4.85 times highest than that of pure TiO2 sample.           on characteristics of hollow TiO2 fibers fabricated by chemical
Thus, founding results indicated that this work study could be             deposition and template method Appl Surf Sci 263: 223-229.
extended to improve the performance and quality for solar light-     28.   Wan Q, Duan L, He K, Li J (2011) Removal of gaseous
driven applications.                                                       elemental mercury over a CeO2– WO3/TiO2 nanocomposite in
                                                                           simulated coal-fired flue gas, Chemical Engineering Journal
References                                                                 170: 512-517.
1.   Lee AC, Lin RH, Yang CY, Lin MH, Wang WY (2008) Mater           29.   Wu Z, Tang N, Xiao L, Liu Y, Wang H (2010) MnOx/TiO2
     Chem Phys 109: 275-280.                                               composite nanoxides synthesized by deposition–precipitation
2.   Weng ZY, Guo H, Liu XM, Wu SL, Yeung KWK, et al. (2013)               method as a superior catalyst for NO oxidation, Journal of
     Rsc Adv 3: 24758-24775.                                               Colloid and Interface Science 352: 143-148.
3.   Ghorai T K, Chakraborty M, Pramanik P (2011) J Alloy Compd      30.   Shi J, Chen S, Wang S, Ye Z, Wu P,et al. (2010) Favorable
     509: 8158-8164.                                                       recycling photocatalyst TiO2/ CFA: effects of calcination
4.   Cao H, Huang S L, Yu Y L, Yan Y B, Lv YK (2017) J Colloid             temperature on the structural property and photocatalytic
     Interf Sci 486: 176-183.                                              activity, Journal of Molecular Catalysis A: Chemical 330: 41-48.
Int J Nanotechnol Nanomed, 2019                         www.opastonline.com                                      Volume 4 | Issue 1 | 7 of 8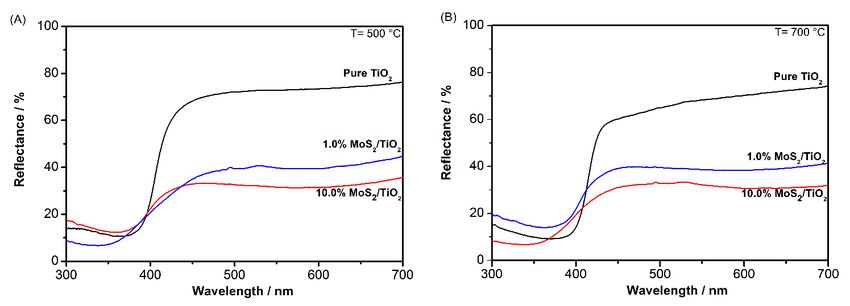
31. Liu H, Dong XN, Liu TT, Su X, Zhu ZF (2014) Mater Lett                 55. Zaki MI, Mekhemer GAH, Fouad NE, Jagadale TC, Ogale SB
    115: 219-221.                                                              (2010) Mater Res Bull 45: 1470-1475.
32. Zainal ND, Nur H, Lee SL (2015) Synthesis and characterization         56. Ho W, Yu JC, Lin J, Yu J, Li P (2004) Preparation and
    of nitrogen-doped titania nanomaterials of homogeneous                     photocatalytic behavior of MoS2 and WS2 nanocluster
    particle size 11: 13-15.                                                   sensitized TiO2, Langmuir 20: 5865-5869.
33. Rezaei E, Soltan J (2012) Low temperature oxidation of toluene         57. Kam KK, Parkinson BA (1982) J Phys Chem 86: 463-467.
    by ozone over MnOx/γ- alumina and MnOx/MCM-41 catalysts,               58. Thurston TR, Wilcoxon JP (1999) J Phys Chem B 103: 11.
    Chemical Engineering Journal 198-199: 482-490.                         59. Pourabbas B, Jamshidi B (2008) Chem Eng J 138: 55-62.
34. Landmann M, Rauls E, Schmidt WG (2012) J Phys-Condens                  60. Wilcoxon JP, Newcomer PP, Samara GA (1997) J Appl Phys
    Mat 24.                                                                    81: 7934-7944.
35. Maurya A, Chauhan P, Mishra SK, Srivastava RK (2011) J                 61. Wilcoxon JP (2000) J Phys Chem B 104: 7334-7343.
    Alloy Compd 509: 8433-8440.                                            62. Huang JM, Laitinen RA, Kelley DF (2000) Phys Rev B 62:
36. de los Santos DM, Navas J, Sánchez-Coronilla A, Alcántara R,               10995.
    Fernández-Lorenzo C.                                                   63. Thurston TR, Wilcoxon JP (1999) J Phys Chem B 103:11-17.
37. de los Santos DM, Navas J, Sánchez-Coronilla A, Alcántara              64. Biesinger MC, LWML, Gerson AR, Smart RSC (2010) Appl
    R, Fernández-Lorenzo C (2015) Mater Res Bull 70: 704-711.                  Surf Sci 257: 887-898.
38. Xu L, Garrett MP, Hu B (2012) J Phys Chem C 116: 13020-                65. Savio AKPD, Fletcher J, Hernandez FCR (2013) Ceram Int:39:
    13025.                                                                     2753-2765.
39. Aguilar T, Navas J, Alcantara R, Fernandez-Lorenzo C, Gallardo         66. Huang JG, XTG, Wang B, Li LY, Zhao MX et al. (2015) Journal
    JJ, et al. (2013) Chem Phys Lett 571: 49-53.                               of Spectroscopy 1-8.
40. PD by Robert C Weast, Handbook of Chemistry & Physics 59th             67. Zhu SS, YMD, Xia XF, Liu X, Li HX (2016) Rsc Adv 6: 23809-
    Edition 1978-1979, CRC Press Inc 1979.                                     23815.
41. Wang S, LNB, Sun HM, Jiang Q, Lian JS (2013) Powder                    68. Nguyen NH, Wu HY, Bai HL (2015) Chem Eng J 269: 60-66.
    Technol 244: 9-15.                                                     69. Khan H, Berk D (2014) Journal of Photochemistry and
42. Richardson PL, Perdigoto MLN, Wang W, Lopes RJG (2013)                     Photobiology A: Chemistry 294: 96-109.
    Appl Catal B-Environ 132: 408-415.                                     70. Erdogan N, Park J, Ozturk A (2016) Ceram Int 42: 16766-16774.
43. Paul KK, Ghosh R, Giri PK (2016) Mechanism of strong                   71. Kang M, Lee MH (2005) Appl Catal A Gen 284: 215-222.
    visible light photocatalysis by Ag2O-nanoparticle-decorated            72. Li N, Li Y, Zhou Y, Li W, Ji S, et al (2017) Sol Energ Mat Sol
    monoclinic TiO2 (B) porous nanorods, Nanotechnology 27:                    C 160: 116-125.
    315703.                                                                73. Lu M, Shao C, Wang K, Lu N, Zhang X, et al (2014) ACS
44. Patel SKS, Gajbhiye NS, Date SK (2011) J Alloy Compd 509:                  Applied Materials and Interfaces 6: 9004-9012.
    S427-S430.                                                             74. Huang JG, Guo XT, Wang B, Li LY, Zhao MX, et al. (2015)
45. Mathews NR, Morales ER, Cortes-Jacome MA, Antonio JAT                      Journal of Spectroscopy 1-8.
    (2009) Sol Energy 83: 1499-1508.                                       75. De los Santos DM, Navas J, Aguilar T, Sanchez-Coronilla A,
46. Zaki MI, AK, Muftah AI, Jagadale TC, Ikram M, Ogale SB                     Fernandez-Lorenzo C,et al. (2015) Beilstein J Nanotechnology
    (2013) Appl Catal a-Gen 452: 214-221.                                      6: 605-616.
47. Kang MS (2005) Mater Lett 59: 3122-3127.                               76. Huang LH, Chan QZ, Zhang B, Wu XJ, Gao P, et al. (2011)
48. Zhan CC, Chen F, Yang JT, Dai DX, Cao XH (2014) J Hazard                   Chinese J Catal 32: 1822-1830.
    Mater 267: 88-97.                                                      77. Chimupala Y, Junploy P, Hardcastle T, Westwood A, Scott A,
49. de los Santos DM, Aguilar T, Sanchez-Coronilla A, Navas J,                 et al. (2016) Journal of Materials Chemistry A 4: 5685-5699.
    Hernandez NC, et al. (2014) Chemphyschem 15: 2267-2280.                78. Scanlon DO, Dunnill CW, Buckeridge J, Shevlin SA, Logsdail
50. Diamandescu L, Vasiliu F, Tarabasanu-Mihaila D, Feder M,                   AJ, et al. (2013) Nature Materials 12: 798-801.
    Vlaicu AM, et al. (2008) Mater Chem Phys 112: 146-153.                 79. Ohtani B, Prieto-Mahaney OO, Li D, Abe R (2010) J Photoch
51. Murphy AB (2007) Sol Energ Mater Sol Cells 91: 1326-1337.                  Photobio A 216: 179-182.
52. Serpone N, Lawless D, Khairutdinov R (1995) Size effects               80. Zhou M, JYaBC (2006) J Hazard Mater 137: 1838-1847.
    on the photophysical properties of colloidal anatase TiO2              81. Simonsen ME, Li ZS, Sogaard EG (2009) Appl Surf Sci 255:
    particles e size quantization or direct transitions in this indirect       8054-8062.
    semiconductor J Phys Chem-Us 99: 16646e-16654.                         82. Luo S-Y, Yan B-X, Shen J (2012) Thin Solid Films 522: 361-
53. Sasca V, Popa A (2013) J Appl Phys 114.                                    365.
54. Serpone N, Lawless D, Khairutdinov R (1995) J Phys Chem                83. Ho WK, Yu JC, Lin J, Yu JG, Li PS (2004) : Langmuir 20: 5865.
    99: 16646-16654.

                                                                            Copyright: ©2019 Sara Chahid, et al. This is an open-access article
                                                                            distributed under the terms of the Creative Commons Attribution License,
                                                                            which permits unrestricted use, distribution, and reproduction in any
                                                                            medium, provided the original author and source are credited.

Int J Nanotechnol Nanomed, 2019                               www.opastonline.com                                        Volume 4 | Issue 1 | 8 of 8
You can also read