The Use of the Spectrometric Technique FTIR-ATR to Examine the Polymers Surface
←
→
Page content transcription
If your browser does not render page correctly, please read the page content below
Chapter 3

The Use of the Spectrometric Technique
FTIR-ATR to Examine the Polymers Surface

Wieslawa Urbaniak-Domagala

Additional information is available at the end of the chapter

http://dx.doi.org/10.5772/48143

1. Introduction
The development of material engineering is accompanied by a growing demand for routine,
nondestructive techniques for material and product testing. These techniques are to be used
for the assessment of chemical and physical structure of new materials as well as for a
systematic control of their manufacturing processes. Nowadays nanotechnologies fulfill a
particular role in creating new materials of nanometric dimensions. The products of
nanotechnology are made in various forms, mostly such as coatings and fibers. Coatings are
of great practical importance while deposited on conventional substrates, such as metals,
ceramics and polymers to impart new functions, e.g. anticorrosive, reflexive, sensory
properties, etc., to them. Coatings are mostly made of polymers and hence their functional
properties and durability mainly depend on polymer chemical and supermolecular
structure. The current control tests of the chemical properties and supermolecular
characteristic of materials are carried out with the use of IR absorption spectroscopy.
Currently, these are dedicated to test the surface of materials. This paper concerns the
spectroscopic technique FTIR used to test the surface of polymeric materials and coatings
formed on polymeric substrates. The general characteristics, advantages and drawbacks of
this technique in testing polymer surfaces have been presented.

2. Technique of infrared absorption spectroscopy
Material testing by the technique of IR spectroscopy consists in making a spectrum of
radiation energy absorbed by material molecules and interpreting the spectrum obtained. IR
radiation within the wavelength range from 2.5 mm to 15 mm (the wave number from 4000
cm-1 to 666 cm-1) is selectively absorbed by material molecules and converted into their
oscillatory energy. The oscillations of molecules are of various characters, connected with
their chemical structure, and depend on the type of bonds (frequency increases with

                           © 2012 Urbaniak-Domagala, licensee InTech. This is an open access chapter distributed under the terms of
                           the Creative Commons Attribution License (http://creativecommons.org/licenses/by/3.0), which permits
                           unrestricted use, distribution, and reproduction in any medium, provided the original work is properly cited.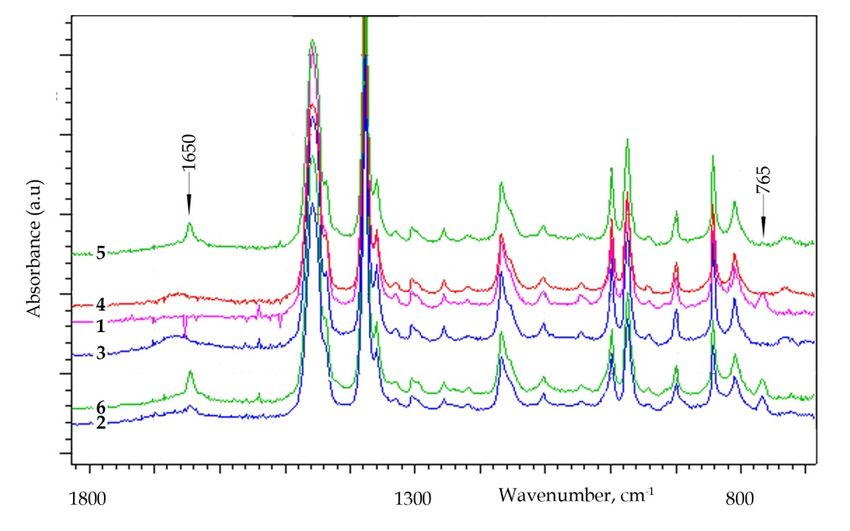
86 Advanced Aspects of Spectroscopy
increasing bond energy), relative atomic weights (frequency decreases with increasing
atomic weight), spatial position of atoms in a molecule, intra- and intermolecular interaction
forces. During absorption, various vibration modes are generated that can be ranged with
respect to energy in the following order: stretching vibration > bending vibration >
oscillatory/torsional vibration. Vibration modes are active in IR only when the frequency of
radiation coincides with the own frequency of molecule oscillation (resonance) and the
dipole moments of molecules change in the same direction as the electric vector of IR
radiation wave.
In the absorption spectroscopy techniques, IR radiation, after passing the material, where
molecules selectively absorb radiation quanta, the absorption spectrum is recorded in the
form of changes in the IR spectra radiation intensity as a function of radiation energy. The
intensity of a beam after passing through sample (I), transmittance (T) or absorbance (A) is
assumed as a measure of absorption. If the intensity of the primary incident beam on a
sample is equal to I0, the relation between intensity, transmittance and absorbance is as
follows: T = I/I0 , A = log (I0/I) = -log T. Energy is expressed in eV, but mostly practical
parameters such as IR radiation wavelength (, nm), wave number (=1/ , cm-1) and
radiation frequency (, Hz) are used to express energy.
Originally, tests and recording the IR radiation absorption spectra of samples were
performed by means of two-beam diffraction spectrometers. Modern technical solutions of
IR spectrometers consist in replacing the reticular monochromators with interferometers,
which considerably increases the sensitivity of spectrometers (a high value of the signal to
noise ratio is obtained), making it possible to shorten the spectrum recording and to obtain
its good definition. Moreover, there occur the transformation and ordering of the
interferogram obtained to the frequency domain by the use of Fourier Transform (FTIR).
The high resolving power of spectrometer makes it possible to record complicated spectra of
materials, spectra mixing, the distinction of band derived from crystalline and non-
crystalline areas and performing static and dynamic tests.
The IR spectrometry technique can be used in two variants: transmission and reflection. The
transmission version is used to test the effects of IR radiation absorption in the volume of
sample. It is possible to test samples in any form: solid, liquid and gaseous with the use of
an appropriate procedure. Gases and liquids are placed in special cuvettes with windows,
made of transparent materials for IR radiation (e.g. ionic crystals: KBr, NaCl). The spectra of
solids can be measured using previously prepared specimens on quartz plates, in a
suspension in liquid paraffin or in the form of tablets made of KBr. If the object tested is
sufficiently thin and transparent, its spectra are measured directly on a sample. The
transmission technique cannot be used for materials that strongly absorb IR radiation and to
test local areas of sample such as surface. In the sixties of the last century, the reflection
variant was developed, so-called Attenuated Total Reflection (ATR), which makes it
possible to test specific version of samples. The ATR-IR uses the phenomenon of a complete
reflection during the transition of IR radiation from an optically denser medium (prism) to
thinner medium (sample). A sample is placed on the IR-transparent prism surface with a
refractive index being always higher than that of the sample (Figure 1). The radiation beam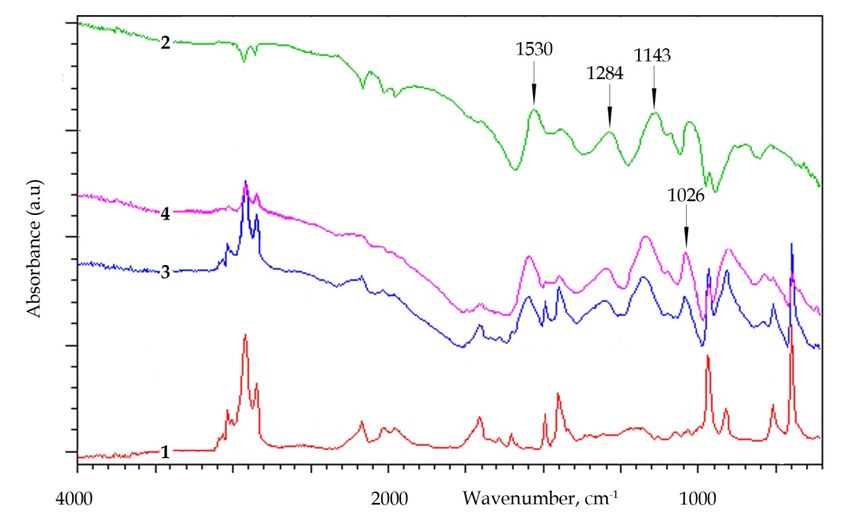
The Use of the Spectrometric Technique FTIR-ATR to Examine the Polymers Surface 87
is directed by one of the prism wall to the prism-sample interface at angle higher than the
limiting. Under these conditions, a complete reflection occurs at the internal prism side and
the beam reflected comes out through the second prism wall, where the beam intensity and
absorption spectrum are recorded.
Figure 1. The schematic representation of infrared beam reflected on the crystal - sample interface in
FTIR-ATR spectrometer. (on the base http://www.sprpages.nl/SprTheory/SprTheory.htm)
During the total internal reflection in the optically thinner medium (sample) is formed an
electromagnetic wave, so-called evanescent wave that fulfills the condition of the continuity
of electromagnetic field vectors at the interface of media with various wave refractive
indices, n1 and n2 (Fornel, 2000). The IR evanescent wave has two wave vector components:
parallel component to the interface of the contact between materials, under influence of
which the wave propagates along surface resulting in the formation of so-called Goos-
Hänchen’s displacement (Goos&Hänchen, 1947), and perpendicular component, under the
influence of which the wave propagates in the optically thinner medium in the direction
perpendicular to the surface and exponentially disappears. The evanescent wave
penetration depth, „dp”, in sample depends on the IR radiation wavelength (), incident
angle, (), prism refractive index, (n1), and sample refractive index in relation to the prism
(n2,1) and is expressed by the following equation (Dechant, 1972):
/n1
dp (1)
2 (sin 2 n21
2 )
Along the path of IR evanescent wave the sample selectively absorbs energy to decrease the
intensity of radiation. The weakened wave returns to the prism and then to an IR detector.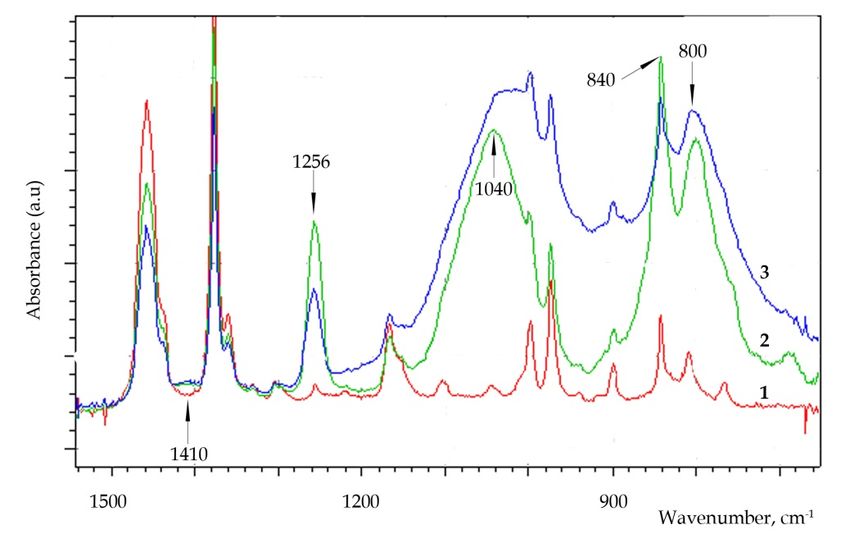
88 Advanced Aspects of Spectroscopy
There the system generates an FTIR-ATR absorption spectrum characteristic of the given
sample. The FTIR-ATR absorption spectrum slightly differs from that obtained by the
transmission method. The differences concern the intensity and frequency of absorption
peaks characteristic of chemical groups in view of the phenomenon of reflection, e.g. Goos-
Hänchen’s displacement. Thus it is necessary to take corrective action that can be realized
automatically. The penetration depth of IR beam can be controlled within some range by
selecting an appropriate prism (selection of the refractive index) and the incident angle of
beam. The commonly used prisms are made of diamond, germanium, silicon and ZnSe,
whose refractive indices are equal to 2.4, 4.0, 3.4 and 2.4, respectively, and the beam
penetration depths: 2.03 m, 0.67 m, 0.84 m and 2.03 m, respectively, at = 1000 cm–1
(Material Thermo Scientific Smart ITR). During testing sub-micrometric coating, the beam
penetrates a higher depth than the coating depth and also passes to the substrate, on which
the coating is deposited. The absorption spectrum then constitutes a superposition of the
spectrum of coating material and substrate. In such cases, qualitative analysis is carried out,
which takes into account the absorption spectrum of substrate.
The basic requirement for ATR technique is to place a sample in direct contact with the
prism as only such conditions allow the IR evanescent wave to penetrate the sample surface
layer. Moreover, there should be a considerable difference between the refractive indices of
prism and sample to get the phenomenon of internal reflection occurred.
The drawback of ATR technique is a relatively low sensitivity and susceptibility to the effect
of environmental conditions, which makes it necessary to calibrate the IR spectrum. Modern
spectrometers have an option of automatic computer-aided spectrum correction. ATR
technique has numerous advantages. FTIR-ATR shows the features of a routine method for
testing the chemical and physical surface structure of materials such as polymers, films and
membranes provided that these well adhere to the crystal. Tests with a modern
instrumentation are characterized by a high reproducibility (better than 0.1%) (Urbanczyk,
1988). FTIR-ATR makes it possible to record spectra within a wider frequency range of IR
radiation than transmission spectroscopy owing to the lack of limitations caused by the
absorption of cuvette windows. An important advantage of this technique is the possibility
of recording spectra in situ and in vivo, e.g. in testing biological objects and using it as a
diagnostic tool in medicine.
In this work, the FTIR-ATR technique was used to analyze the surfaces of modified
polymers and to test the polymeric layers deposited on substrates.
3. Examples of testing polymers by FTIR-ATR
Tests were carried out by means of a single-beam FTIR-Nicolet 6700 spectrometer from
Thermo Scientific, equipped with a diamond crystal (refractive index n = 2.4). IR spectra
were recorded as changes in absorption as a function of wave number ranging from 600 cm-1
to 4000 cm-1. A DTGS KBR detector was used. The following measurement technical
conditions were used: measurement recording accuracy - 4 cm-1, mirror travel rate - 0.31 cm-
1/s, aperture - 50, minimal scans number – 32.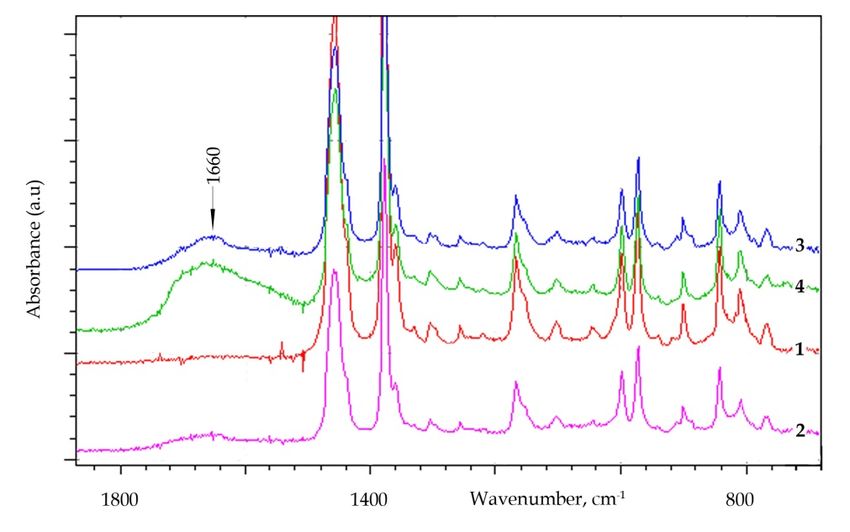
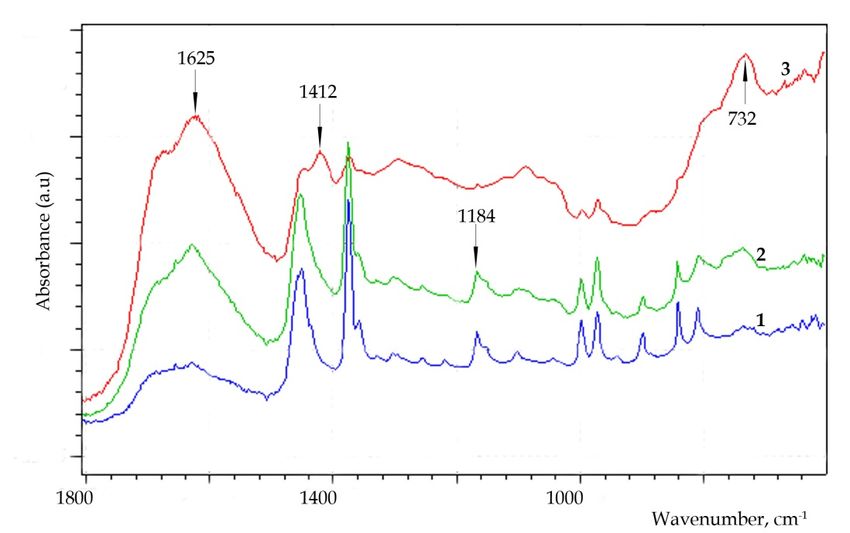
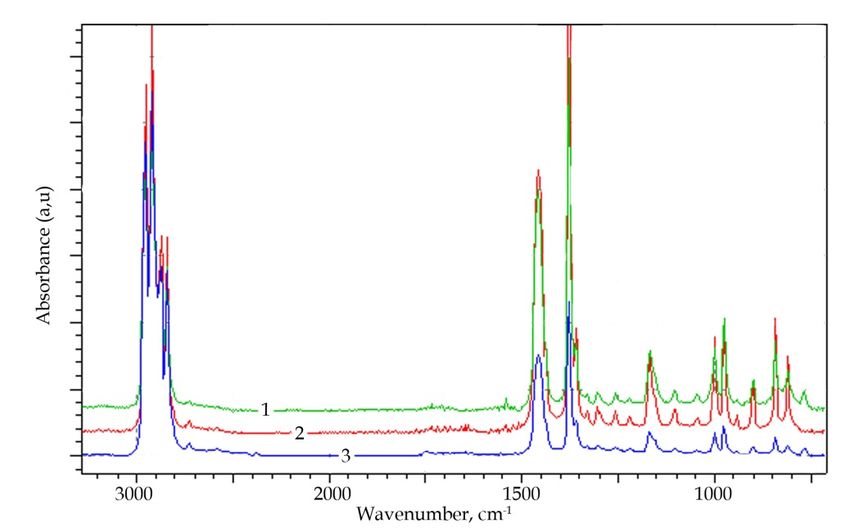
The Use of the Spectrometric Technique FTIR-ATR to Examine the Polymers Surface 89

3.1. Assessment of the modification effects on the surface of polypropylene (PP)
films and nonwovens
Polypropylene products are commonly used in commodity production due to their special
chemical properties (resistance to organic and inorganic solvent, hydrophobic properties) and
physical characteristics (lightness, mechanical strength, electro- and thermal insulating
capabilities). In the methods of making products such as composites with the use of PP films or
fibers as reinforcing components, a serious drawback of these materials is their low free surface
energy, which results in weak molecular interactions between the composite components. The
free energy of PP material surface can be increased by creating new functional chemical groups
in the material surface layer. This task has been fulfilled by exploring different approaches such
as chemical, electrochemical, physical and plasma methods . The effectiveness of the methods
used was assessed by means of the FTIR-ATR technique.
The moleculare structure of polypropylene is the same in the use of films and nonwovens
products:

In one unit of PP molecule chain are tree atoms of carbon, in the form of different groups: -
CH2- ; >CH- ; and –CH3. Each of them is correlated in IR spectra with the suitable absorption
peak by definite wavenumber values (Figure 2). The proper characteristic, concerning this
correlation is presented in Table 1.

Figure 2. FTIR-ATR spectra of commercial PP films : non-oriented, non-crystalline PP Cast (Sample 1);
bidirectionally oriented, crystalline PP AG (Sample 2) and PP nonwoven (Sample 3).
90 Advanced Aspects of Spectroscopy
IR spectra of PP for film and nonwoven can differ between themselves only in defiles (the
differences in shape and intensity of peaks), because in ATR technique, the contact of the
samples with measure crystal, can be different for different structure of samples (film –
continuous structure, nonwoven – porous structure). The explanation of this problems
shown as an example at Figure 3.
Wave number, cm-1 Absorbing group and type of vibration
2916 a (CH2)
2959 a (CH3)
2881 s (CH3)
2841 s (CH2)
1460 a (CH3)
1376 s (CH3)
1357, w (CH2- CH)
1328 w (CH2 - CH)
1302, 1224, 941 Carbon lattice pulsation
1170, 1153 w (CH3), (CH2), (CH)
975, 899, r (CH3), r (CH2), r (CH)
841, 810 r (CH2), r (CH), r (CH3)
765 w (CH2)
*) s - stretching vibration symmetrical and a -asymmetrical, s - deformation vibration symmetrical and a –
asymmetrical, w - wagging vibration, r – rocking vibration
Table 1. IR absorption bands of Polypropylene (Urbanczyk, 1988; Rau, 1963)
Sample A Sample B
Figure 3. SEM images of type surface structure : PP nonwoven fabrics (Sample A), PP Cast film
(Sample B)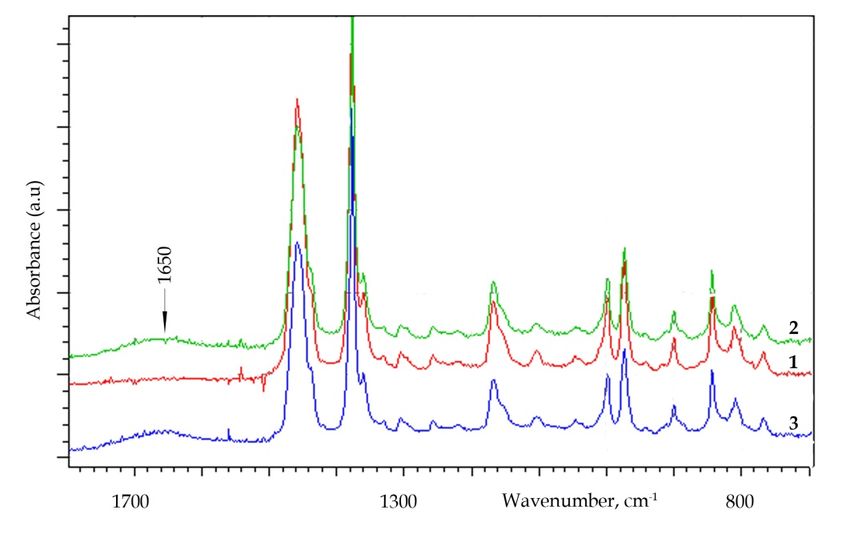
The Use of the Spectrometric Technique FTIR-ATR to Examine the Polymers Surface 91

3.1.1. Effects of PP film modification
Commercial PP, non-oriented, non-crystalline (PP Cast) and bidirectionally oriented,
crystalline (PP-AG) films were modified in media of strong oxidants, such as: 3M nitric acid,
30% hydrogen peroxide, and a saturated solution of potassium dichromate in 70% sulfuric
acid (K2Cr2O7+H2SO4). The electrochemical oxidation was carried out with the use of anolyte
(AgNO3 solution in nitric acid) and catholyte (nitric acid solution). The physical
modification of PP was performed by means of a Xenotest apparatus, irradiating PP film
with UV radiation according to EN ISO 105-B02:2006 (Urbaniak-Domagala, 2011). Plasma
modification processes were carried out with the use of RF glow discharge of special gases
under decreased pressure (Urbaniak-Domagala, 2011). Figures 4, 5 show the FTIR-ATR
spectrograms of the PP film surfaces after oxidation compared with unmodified PP films. In
the FTIR-ATR spectrograms of the PP film surface layer, one can observe absorption bands
that are consistent with those of isotactic PP obtained by the authors mentioned in Table 1.

Figure 4. FTIR-ATR spectra of commercial PP films before and after oxidation. 1- PP Cast untreated, 2 -
PP AG untreated. Samples 3÷7 PP Cast modified: by using electrochemical method, current intensity:
100 mA/cm2, 30 min. (Sample 3), UV treatment (Xenotest) 170h (Sample 4), K2Cr2O7+H2SO4 solution at
70oC, 3 min. (Sample 5), 3M nitric acid at 20oC, 24 h (Sample 6), 30% hydrogen peroxide at 20oC, 1 h
(Sample 7).

Moreover, the spectrograms of PP surface layer oxidized by chemical methods show a new
absorption band within the wave number range of (1730 – 1680) cm-1 that corresponds to a
carbonyl group formed in a oxidizing medium as a results of the nucleophilic substitution of
PP, mainly at the tertiary carbon atom: - CH2 – C < R H – CH 2 – (the substitution
susceptibility of the tertiary, secondary and primary carbon is 7000: 1100: 1, respectively)
(Wiberg & Eisenthal, 1964). The absorption maximum of carbonyl group is slightly shifted
depending on the type of oxidizing medium.
92 Advanced Aspects of Spectroscopy

    Figure 5. FTIR-ATR spectra of PP Cast films before and after plasma oxidation. Sample 1 - PP
    untreated, Sample 2. PP treated Ar plasma p=0.05Tr, power 300W, t=10 min., Sample 3 - PP treated
    Acetic Acid Vapour plasma: p=0.05Tr 300W, t=10 min., Sample4 - PP treated Water Vapour plasma:
    p=0.05Tr; 300W, 10min, Sample 5 - PP treated Air plasma: p=0.05Tr; 300W. t= 5min., Sample 6 - PP
    treated Air plasma: p=0.05Tr; 300W, t= 10min.

    The absorption band of carbonyl group in the PP spectrum is broad, which can indicate the
    presence of carbonyl group in various products of oxidation, such as aldehydes and ketones
    (Carlsson & Wiles, 1969): 1700 cm-1absorption (>C = CH-CO-OH), 1710 cm-1absorption (-CO-
    OH), 1715 cm-1absorption (>C = O), 1718 cm-1 absorption (-CCH3 –CH2 –CO- CH2- CH3),
    1726 cm-1absorption (-CCH3 –CH2 –CO- CH3).

    The spectrogram of oriented and crystalline PP AG shows no absorption band of carbonyl
    group despite the fact that the determination of the contact angle of PP surface wetted with
    polar liquids indicated an increase in free energy (Urbaniak-Domagala, 2011). One may
    assume that the active center concentration is too low for the FTIR-ATR method. The
    spectrogram of PP oxidized by chemical methods also indicates changes in two bands at 940
    cm-1 and 765 cm-1 (Figure 4).

    The first one indicates the skeleton vibration of mer links with a relative phase shift of 2/3,
    being mainly characteristic of the crystalline phase (Rau, 1963). In the case of PP AG film,
    this band is intensive, while in PP Cast, it decreases and after oxidation is absent, which can
    indicate that the PP surface layer becomes amorphous due to the oxidation process. The
    absorption band at 765cm-1 is characteristic of non-crystalline PP, caused by the deformation
    vibration of methylene group (–CH2 –) (Kazicina.&Kupletska, 1976). This band is absent in
    the spectrogram of PP after oxidation, which can be due to the decrease in the number of
    methylene groups caused by the degradation of the polymer in its surface layer. This band is
    also absent in crystalline PP due to spherical limitations caused by a long-range order.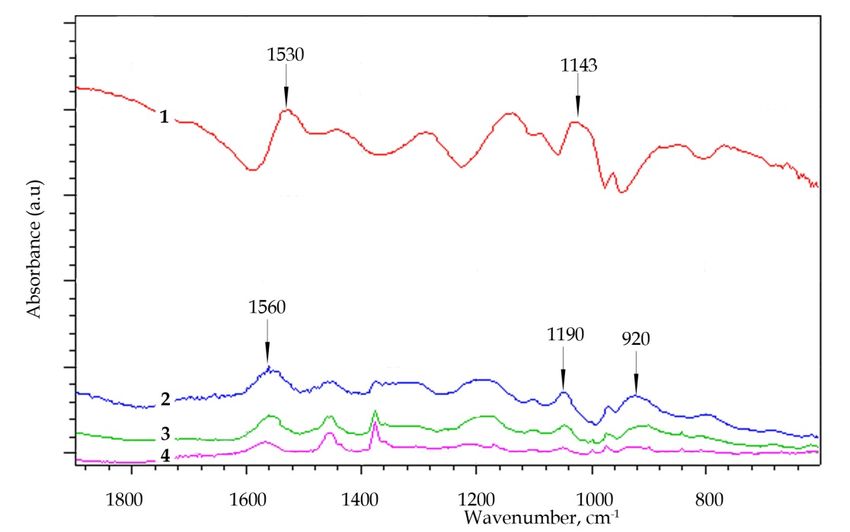
The Use of the Spectrometric Technique FTIR-ATR to Examine the Polymers Surface 93

FTIR-ATR absorption spectra (Figure 5) present the chemical effects of plasma on PP film.
The gases used in this process included: argon and air and vapors of acetic acid and water
under optimal conditions of plasma treatment (time and power applied to the system).
The spectra of the plasma-treated PP film show a new absorption band within the range of
wave numbers of (1640 ÷ 1660) cm-1 , which can indicate the formation of carbonyl group,
>C=O, (valence vibration) as well as –C=C- groups (valence vibration) (Kazicina&Kupletska,
1976). The prolongation of plasma treatment and increase in power leads to the increase in
the IR radiation intensity of the band of new functional groups. The position of IR
absorption maximum slightly shifts depending on the plasma composition. These new
active centers can be regarded as a result of PP surface oxidation with plasma particles. In
the case of Ar plasma, the effect of surface functionalization can result from the so-called
post-treatment process (Guruvenket et al, 2004). The results obtained indicate a particular
activity of air plasma as oxidizing medium for polypropylene.

3.1.2. Effects of PP nonwovens modification
FTIR-ATR was also used to assess the effects of plasma-treated PP nonwovens. PP melt-
blown nonwovens (surface weight: 80 g/m2, average thickness: 1.5mm) made of PP fibers
with an average thickness of 2.12 μm were modified by means of synthetic air plasma to
form chemically active centers on the PP fiber surface.

Figure 6. ATR IR spectra of PP nonwoves untreated (Sample 1) and air plasma treated, pressure 0.1Tr :
Sample 2 - power 50W, time 5min. Sample 3- power 100W, time 5min., Sample 4 - power 100W, time
10min

The FTIR-ATR spectrogram of the air plasma-treated PP nonwoven shows two broad bands
at 1660 cm-1 and 3320 cm-1 that indicate the formation of carbonyl group >C=O and hydroxyl
94 Advanced Aspects of Spectroscopy

    group – OH (Kazicina.&Kupletska, 1976). One may assume that the air plasma oxidizes the
    fiber surface with the aid of reactive oxygen, peroxide and nitrogen groups that together
    with electrons react with the PP fiber surface causing not only the etching of surface layer
    but also its functionalization.

    3.2. Polymeric coatings deposited on PP nonwovens
    Nonwovens constitute a specific substrate for depositing thin polymeric layers. The
    nonwoven surface is developed to an extent dependent on the diameter of elementary
    fibers, density of their distribution and the formation technique used. The melt-blown PP
    nonwovens (see section 3.1.2.) were coated with thin layers of plasma polymers in a
    methane plasma and in hexamethyldisiloxane (HMDSO: O-(Si-(CH3)2) vapors [Urbaniak-
    Domagala et al, 2010). As a result of this process, the nonwoven surface was covered with a
    plasma polymer layer with a thickness of about 100 nm. SEM photographs (Figure 7)
    indicate that the coating obtained shows a character of a continuous film fitted to the
    uneven nonwoven surface covering only the elementary fibers in the near-surface
    nonwoven layer.

                       Sample A                                         Sample B
    Figure 7. SEM images of PP fibers at nonwoven fabrics, treated methane plasma (Sample A), treated
    HMDSO plasma ( Sample B). Plasma process time 10 min., pressure 0.05Tr, power 100W.

    The FTIR-ATR spectrogram of the methane plasma-modified nonwoven surface (Figure 8)
    indicates that the layer chemical structure has a character of a hydrocarbon polymer as the
    PP substrate. The broad band with a maximal absorption at 1650 cm-1 can be assumed as a
    post-treatment effect (Guruvenket et al, 2004).

    The IR-ATR spectrogram of the HMDSO plasma-modified nonwoven indicates that the
    layer deposited has a chemical structure of a SiOC:H polymer (Creatore et al., 2002) and
    contains intensive absorption bands at 800 cm-1, 841 cm-1, 1040 cm-1and 1256cm-1 (Table 2)
    being characteristic of chemical groups containing silicon (Borvon et al., 2002).
The Use of the Spectrometric Technique FTIR-ATR to Examine the Polymers Surface 95 Figure 8. FTIR-ATR spectra of PP nonwoves. Sample 1- untreated, Sample 2 - methane plasma treated: power 25W, pressure 0.05Tr, Sample 3 - methane plasma treated: power 100W, pressure 0.05Tr. Figure 9. FTIR-ATR spectra of PP nonwoves. Sample 1 - untreated, Sample 2 - HMDSO plasma treated: power 25W, pressure 0.1Tr, Sample 3 - HMDSO plasma treated: power 100W, pressure 0.1Tr.
96 Advanced Aspects of Spectroscopy
The assessment of the surface of samples was carried out in the diamond-sample system, in
which the IR radiation beam penetrates the layer 2 μm in depth within the spectrum range
discussed. The penetration depth of the IR radiation beam considerably exceeds the
thickness of the p-HMDSO layer (~ 0.1 m), hence characteristic bands of PP substrate also
occur in the absorption spectrum.
Wave number, cm-1 Absorbing group and type of vibration
1410 s (CH3), a in Si(CH3)x
1256 CHx, (CH3)in Si(CH3)x
1040 a (Si-O-Si)
840 Si(CH3)x , r (CH3)in Si(CH3)3
800 (Si-O-Si), r (CH3)in Si(CH3)2
*) s - stretching vibration symmetrical and a -asymmetrical, - deformation vibration, r – rocking vibration
Table 2. IR absorption bands of p-HMDSO plasma layers (Aumaille et al., 2002; Agres et al., 1996)
3.3. Testing polymeric coatings containing polypyrroles
Polypyrrole is a polymer widely used in commodity production owing to its high thermal
stability, resistance to atmospheric conditions and biocompatibility. Its important
advantages include electric properties. Using appropriate synthesis conditions, one can
obtain electro-conductive, semi-conductive or electro-insulating polypyrroles. In view of
processing difficulties, polypyrroles are produced directly on material surfaces in the form
of coatings by “in situ” chemical, electrochemical or plasma methods. Moreover,
polypyrroles are used to make composites as reinforcing and functional materials. In this
work, the FTIR-ATR technique was used to monitor the results of polypyrrole synthesis by
chemical and plasma methods and the preparation of pyrrole - containing composites.
3.3.1. Formation of latex-pyrrole composites
Polypyrrole (PPy) was used to make an electro-conductive composite as a backing of textile
floor coverings (TFC). The TFC piles are fixed in a standard procedure with the use of
dressing containing a synthetic rubber and vinyl-acrylic thickeners. The standard latex
coating shows electro-insulating properties and impedes the leakage of static charges
generated on the TFC pile during exploitation. A functional dressing was prepared to
facilitate the leakage of static charges from TFC. PPy microspheres in the form of an aqueous
dispersion, prepared by polymerization in an aqueous solution of ferric chloride, were
added to an aqueous dispersion of butadiene-styrene-carboxyl copolymer (LBSK 4148)
(Urbaniak-Domagala, 2005).
The dispersion components were intermixed by means of an ultrasonic stirrer and the resultant
dressing was applied on the bottom of a raw TFC followed by the cross-linking process. The
volume resistance tests of the latex-PPy coat confirmed its antistatic properties already with a
3% (by wt.) content of PPy in relation to the dry copolymer mass in the dressing.The Use of the Spectrometric Technique FTIR-ATR to Examine the Polymers Surface 97 Figure 10. FTIR-ATR spectra pure latex LBSK 4148 (Sample 1), chemically synthesized polypyrrole (Sample 2), latex/PPy composite containing 2 wt% PPy (Sample 3), 3 wt% PPy (Sample 4) The percolation of the coating electric conduction has a continuous character and the percolation threshold is relatively low. The coating formation on the TFC bottom was controlled by means of FTIR-ATR spectrometry Changes in the IR radiation absorbance of the coatings were observed within the range from 600 cm-1 to 1700 cm-1. Figure 10 shows the absorption spectra of pure LBSK 4148 latex (Sample 1), pure PPy (Sample 2) and two samples of LBSK-PPy composite containing 2% by wt. of PPy and 3% by wt. of PPy, respectively. The locations of absorption bands of LBSK, PPy and LBSK-PPy composite containing 3% by wt. of PPy are listed in Table 3. The spectrum of LBSK indicates the presence of three types of butadiene isomeric units (1,4- cis, 1,4-trans and 1,2-vinyl), styrene PS and carboxyl (Molenda et al.,1998; Munteanu & Vasile, 2005) have carried out fundamental research of FT-IR spectra of butadiene-styrene copolymers with various structural arrangements (block and linear copolymers, block copolymers of the star type and statistic copolymers). The type of spectrum found for LBSK 4148 latex indicates the architecture of statistic copolymer. The spectrogram of the microspheres of chemically synthesized PPy (powder) indicates PPy rings in the polymer structure and groups connected with the ring being consistent with the results of authors (Eisazadeh, 2007; Cruz 1999; Ji-Ye Jin et al.,1991).
98 Advanced Aspects of Spectroscopy
Chemically synthesized polypyrrole LBSK
LBSK 4148
(PPy) 4148/PPy
, , Absorbing group and type of
Absorbing group and type of vibration , cm-1
cm-1 cm-1 vibration
- 659 (C-N) out of plane ring 659
699, (CH) out of plane in the aromatic ring,
- 699, 758
758 PS units
(C-H) out of plane pyrrole
- 770 ring, (NH2), 790
(C-N-C), (C-N-C)
(CH) out of plane near the double bond
911 - 911
of the vinyl-PB units
(CH) out of plane near the double bond
966 - 966
in trans-PB units
(N-H), (C-H),
- 1026 pyrrole rings pulsation 1040
(C-N) secondary amines
- 1143 (C-H) 1170
(C-N) secondary amines,
- 1284 1300
(C-N) in pyrrole ring
1451 (CH) in cis-PB, trans-PB, vinyl-PB units - 1451
1492 (C=C) in aromatic ring PS units - -
(C=C) in pyrrole ring
- 1530 (C=N) in pyrrole ring , pyrrole 1548
ring pulsation
1600 (C=C) in aromatic ring PS units - -
(C=C) PS units
1638 - -
(C=C) in vinyl-PB
1700 (C=O) - 1700
Table 3. The FTIR absorption bands for latex LBSK 4148, chemically synthesized polypyrrole and LBSK
4148/PPy composite containing 3 wag.% PPy (Kazicina.&Kupletska, 1976, Molenda et al.,1998;
Munteanu & Vasile, 2005; Bieliński et al., 2009; Eisazadeh, 2007; Cruz 1999; Ji-Ye Jin et al.,1991)
The spectrograms of LBSK-PPy composite samples indicate the superposition of
characteristic bands of the composite components: PPy and latex. As the PPy content in
the composite increases, one can observe an increase in the intensity of characteristic
peaks of PPy, but the quantitative analysis of the composite is difficult to perform due
to great differences in the absorbance of the composite components (latex is white, PPy
is black). The band maxima shown by the PPy powder are delocalized in the spectrum
of latex-PPy composite. The band indicating the pyrrole ring vibration at 1530cm-1 is
shifted towards a higher frequency to 1548 cm-1. The bands of groups linked up to the
pyrrole ring are also shifted: for CH deformation vibration (out of plane quinol PPy)
from 1026 cm-1 to 1040 cm-1, for C-N deformation vibration from 1143 cm-1 to 1170 cm-1,
and for the valence vibration of CN in pyrrole ring from 1284 cm-1 to 1300 cm-1. The
shifts of bands can be due to the scattering of IR radiation in the structure of PPy
powder, but they can also indicate the occurrence of PPy - latex intermolecularThe Use of the Spectrometric Technique FTIR-ATR to Examine the Polymers Surface 99 interactions, with which the oscillatory excitation of chemical groups in PPy requires a higher energy. 3.3.2. Synthesis of polypyrroles Below are presented examples of using the FTIR-ATR technique to assess the progress in the synthesis of PPy. The polymerization of pyrrole was carried out by chemical and plasma methods. Thin layers of PPy were formed on the surface of a PP film by the in situ technique. 3.3.2.1. Chemical polymerization method Polymer layers were formed by the polymerization of pyrrole according to the redox mechanism. Two media of pyrrole oxidation were used: an aqueous solution of ferric chloride and aqueous solution of ammonium sulfate with p-toluenesulfonic acid as dopant. Based on the FTIR-ATR spectrum of the polymer, its synthesis progress and chemical structure were characterized. Figure 11 shows examples of the spectra of PPy synthesized in both media for 2h and 5 h. Figure 11. FTIR-ATR spectra chemically synthesized polypyrrole. Sample 1 - PPy powder (molar ratio of FeCl3:Py=2,3:1) - polymerization time 5h; PPy layers on the polypropylene foil: Sample 2 – molar ratio of FeCl3:Py=2,3:1, polymerization time 5h, Sample 3 – molar ratio of FeCl3:Py=2,3:1, polymerization time 2h; Sample 4 – molar ratio of (NH4)2S2O8: CH3C6H4SO3H: Py=0,2:0,25:1, polymerization time 2h.
100 Advanced Aspects of Spectroscopy
The spectra of PPy are recorded on the PP substrate. Owing to the low thickness of layers
(0.1 - 1m), the spectrum additionally contains bands derived from the substrate. For
comparison, the spectral characteristics of PPy synthesized in the form of powder were also
presented. The absorption spectra of all the polymer samples within the wave number range
of 600 cm-1 – 1800 cm-1 confirm the presence of pyrrole group (Table 3). The intensity of
absorption bands increases with increasing polymerization time, which is due to the
increased layer thickness. In the process of chemical synthesis, the aromatic character of
pyrrole ring is maintained, which results in the formation of conjugated double bonds in the
linear macromolecule chain. In the presence of admixtures intercalated to the system, the
polymer is electro-conductive (incorporated dopants: Cl- and CH3C6H4SO3-). The oxidized
form of conductive PPy obtained shows a considerable absorption of IR radiation (black
color of the polymer). The spectrogram of PPy synthesized with the use of two different
oxidants shows no differences between the polymer chemical structures. Differences
concern the progress rate of the synthesis: the higher intensity of pyrrole group bands in the
polymer synthesized in the aqueous solution of ferric chloride indicates a higher
polymerization rate, which is confirmed by the higher rate of layer building up.
3.3.2.2. Plasma polymerization method
Polymer synthesis performed in glow discharge of monomer vapors is a dry, ecological,
energy- and material-saving process. The polymerization process is initiated by means of
electrons and radicals formed in the gas discharge. The polymerization of pyrrole was
carried out in a flow reactor, in glow discharge of the induction type by means of RF field
13.56 MHz (Urbaniak-Domagala, 2008). PP film substrate was centrally and axially placed
on a glass carrier in the reactor. The film surface was preliminary purified by means of
argon plasma followed by the deposition of the plasma polymer. The FTIR-ATR technique
was used to examine the effect of process parameters, such as deposition time, pressure in
the reactor and power input to the reactor, on the chemical structure of plasma polymer. In
order to impart semi-conductive properties, the plasma PPy was doped after the deposition
process by two methods: in situ in the reactor in glow discharge of the vapors of organic
iodine compounds, and ex situ after removal from the reactor in crystalline iodine vapors.
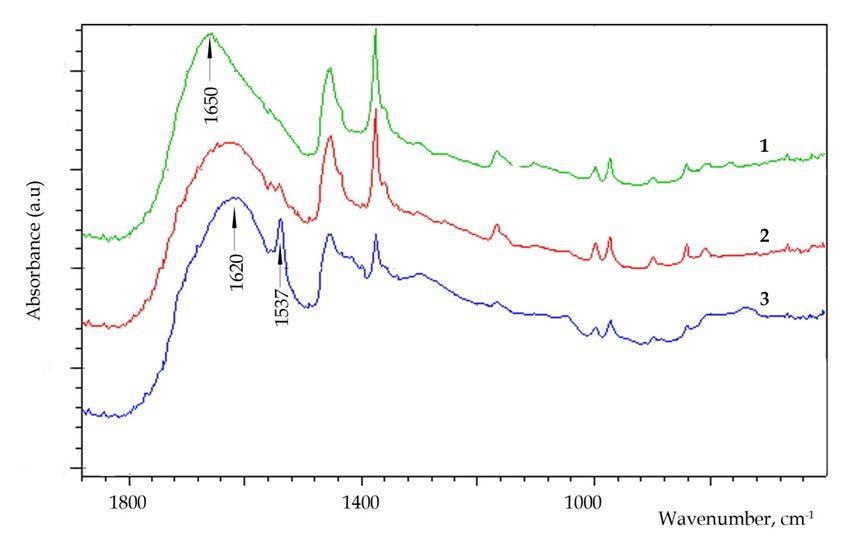
Figure 12 shows the FTIR spectra of the plasma polymer within the range of (600-1850) cm-1.
The spectrogram shows the superposition of the absorption bands of plasma polymer
(thickness 0.3 m) and PP substrate. The broad band at (1500 – 1800) cm-1 indicates different
structure of plasma PPy compared to that of PPy synthesized by the chemical method. This
band points to a possible occurrence of primary and secondary amines , secondary amides
(Kazicina.&Kupletska, 1976), and carbonyl groups (Ji-Ye Jin et al.,1991) in the polymer. The
broad absorption band of the polymer indicates a complex absorption caused by the
products of broken pyrrole rings that initiate the branching and cross-linking of the polymer
followed by various substitutions. Thus the plasma spectrograms can show secondary and
tertiary amines that complicate the absorption in this range. Moreover, one cannot exclude
the occurrence of the band at 1710cm-1 that, according to authors (Ji-Ye Jin et al.,1991)
indicates the presence of carbonyl groups. This band is often observed in neutral or weakly
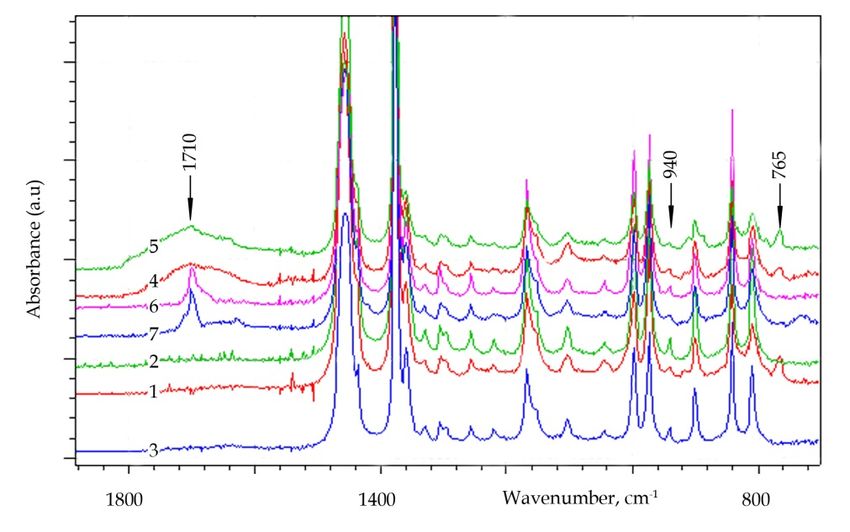
doped forms of PPy, mainly due to their susceptibility to oxidation in air. The spectrum ofThe Use of the Spectrometric Technique FTIR-ATR to Examine the Polymers Surface 101 Figure 12. FTIR-ATR spectra plasma synthesized polypyrrole, pyrrole plasma: 50W, 10min, p=0,05Tr. Sample 1-polymer without dopand, Sample 2 - polymer dopanded at plasma CH2J2 : 25W, 30min., p= 0,05Tr, Sample 3- polymer dopanded at J2 vapours, 30min the polymer doped with iodine vapors contains an additional band at 1537cm-1, induced by the vibration of pyrrole ring, especially intensive in the polymer doped with crystalline iodine vapors. (Groenewoud et al. 2002) observed an increase in the intensity of peak 1520 cm-1 under the influence of iodine vapors, which is connected with the formation of a new CH2=J group in the reaction of iodine with radicals present in the surface layer of the plasma polymer. The spectrum of the plasma polymer synthesized in the presence of nitrogen as a carrier of pyrrole proves how significant is the influence exerted by the process gas on the chemical polymer structure. This is particularly evident in the polymer synthesized for a longer time (the spectrum of polymer after a 1 h process – Figure 13). The FTIR-ATR spectrum of the plasma PPy at (500-1000) cm-1 contains numerous bands with a high absorption intensity that indicate the presence of primary amines (Kazicina.&Kupletska, 1976), and products of substituting chemical groups that were additionally formed in the polymer under the influence of the nitrogen plasma. The absorption spectra obtained by the FTIR-ATR technique identify the chemical structure of PPy coatings and the structural changes that appear during changing the process parameters, such as pressure, power, type of doping agents, method of incorporating doping agents and the presence of process gas.
102 Advanced Aspects of Spectroscopy

     Figure 13. FTIR-ATR spectra plasma synthesized polypyrrole without dopands. Sample 1- plasma
     pyrrole 0,1Tr 10W, 15min, without processing gas, Sample 2- processing gas N2 and pyrrole p= 0,15Tr.
     10W, 15min. Sample 3 - processing gas N2 and pyrrole p=0,15Tr 10W, 60min

     4. Conclusions
     The FTIR-ATR technique makes it possible to examine polymers in a simple, fast procedure
     avoiding sample destruction. It creates many opportunities for application to the chemical
     identification of the surface layer of polymers and thin polymeric layers. The analyses of test
     results of thin layers deposited on polymeric substrates can have rather qualitative character
     due to the penetration reach of the IR radiation beam being greater than the layer thickness.
     The examples of PP modification processes and deposition of coatings on polymeric
     substrates presented confirm that the FTIR-ATR method can be helpful in the examinations
     of the following:

     -    the chemical structure of the polymer surface layer and changes in the layer structure
          caused by the effects of chemical agents and electrochemical factors, UV radiation and
          low temperature plasma on polymers;
     -    the chemical structure of polymeric coatings deposited on substrates by chemical and
          plasma methods;
     -    the dependence of the chemical structure of polymeric coatings on the parameters of
          technological process.
The Use of the Spectrometric Technique FTIR-ATR to Examine the Polymers Surface 103
Author details
Wieslawa Urbaniak-Domagala
Technical University of Lodz, Department of Material
and Commodity Sciences and Textile Metrology, Poland
Acknowledgement
The author would like to thank Professor Barbara Lipp-Symonowicz for good advices and
for helpful discussions.
5. References
F. de Fornel, (2000). Evanescent waves—From Newtonian optics to atomic optics. Berlin:
Springer- Verlag, ISBN: 9783540658450
Goos F.; Hänchen H. (1947). Ein Neuer und fundamentaler Versuch zur Totalreflexion, Ann.
Phys. (436) 7-8, 333-346
Dechant J. (1972) Ultrarotspektroskopische Untersuchungen an Polymeren, Berlin
Available from [http://www.sprpages.nl/SprTheory/SprTheory.htm]
Urbańczyk G.W. (1988) Mikrostruktura Włókna - Badanie Struktury Krystalicznej i Budowy
Morfologicznej, WNT, ISBN 83-204-1014-2, Warszawa
Urbaniak-Domagala W. (2011) Pretreatment of polypropylene films for the creation of thin
polymer layers, part 1: The use of chemical, electrochemical, and UV methods” Journal
of Applied Polymer Science Vol. 122, No. 3, 2071–2080, 5 November 2011
Urbaniak-Domagala W. (2011) Pretreatment of polypropylene films for following
technological processes, part 2: The use of low temperature plasma method. Journal of
Applied Polymer Science, Vol.122, No. 4, 2529–2541, 15 November 2011
Urbaniak-Domagala W., Wrzosek H., Szymanowski H.,Majchrzycka K., Brochocka A.,
(2010) Plasma Modification of Filter Nonwovens Used for the Protection of Respiratory
Tracts, FIBRES & TEXTILES in Eastern Europe , Vol. 18, No. 6 (83) pp. 94-99
Rau J.H. (1963). Melliand Textilberichte, 44, pp.1102, 1197, p. 1320
Wiberg K.B.; Eisenthal R. (1964) On the mechanism of the oxidation of hydrocarbons with
chromic acid and chronyl chloride. Tetrahedron 20, 1151-1161
Carlsson D.J.; Wiles, D.M. (1969) The Photodegradation of Polypropylene Films. II.
Photolysis of Ketonic Oxidation Products Macromolecules 2, 587.
Kazicina L., Kupletska N.:(1976) Metody spektroskopowe wyznaczania struktury związków
organicznych 2nd edition; PWN: Warsaw
Guruvenket S.; Rao G.M.; Komath M.; Raichur A.M. (2004) Plasma surface modification of
Polystyrene and Polyethylene. Appl. Surf. Sc., 236, 278-284
Creatore M., Palumbo F., d`Agostino R., (2002) Deposition of SiOx Films from
Hexamethyldisiloxane/Oxygen Radiofrequency Glow Discharges: Process Optimization
by Plasma Diagnostics Plasmas and Polymers, Vol.7, No. 3, 291-310104 Advanced Aspects of Spectroscopy
Borvon G., Goullet A., Granier, A., Turban, G., (2002) Analysis of Low-k Organosilicon and
Low-Density Silica Films Deposited in HMDSO Plasmas Plasmas and Polymers, Vol.7,
No. 4, 341-352
Aumaille K., Vallee C., Granier, A., Goullet, A., Gaboriau, F., Turban, G., Turban (2000) A
comparative study of oxygen/organosilicon plasmas and thin SiOxCyHz films
deposited in a helicon reactor. Thin Solid Films Vol. 359,188-196
Agres L., Segui Y., Delsol R., Raynaud, P. (1996) Oxygen Barrier Efficiency of
Hexamethyldisiloxane/Oxygen Plasma-Deposited Coating Journal of Applied .Polymer
Science. Vol. 61, 2015-2022
Urbaniak-Domagala W. (2005) Modyfikacja właściwości elektrycznych klejonki lateksowej
stosowanej do włókienniczych pokryć podłogowych” Konference ENP`2005,
Elektrotechnologie w nowoczesnym przemyśle, Bialystok 2005
Molenda J.,Grądkowski M., Makowska M., Kajdas C. (1998) Tribochemical characteristic of
some vinyl-type compounds in aspect of antiwear interactions. Tribologia, No. 3, 318-
329
Munteanu S.B., Vasile C. (2005). Spectral and thermal characterization of styrene-butadiene
copolymers with different architectures. Journal of Optoelectronics and Advanced materials,
Vol.7, No.6, 3135-3148
Bieliński D., Głąb P., Ślusarski L. (2009) FT-IR internal reflection study of migration and
surface segregation of carboxylic acid in butadiene-styrene rubber. Polimery, 2009, Vol.
54, No. 11-12, 706-711
Eisazadeh H. (2007). Studying the Characteristics of Polypyrrole and its Composites. World
Journal of Chemistry 2 (2): 67-74
Cruz G.J., Morales J.,Olayo R. (1999) Films obtained by plasma polymerization of pyrrole.
Thin Solid Films, 342, 119-126
Ji-Ye Jin, Kumi.T., Ando, Teramae N., Haraguchi H. (1991) FT-IR Spectroscopy of
Electrochemically Synthesized Polypyrrole. Analytical Sciences Vol. 7, 1593-1594
Urbaniak-Domagala W. (2007) Morphology of polypyrrole films formed in low-temperature
plasma. Proceedings Conference IMTEX 2007, October 8-9, Lodz, 96-99, ISBN 978-83-
911012-6-1
Groenewoud L.M.N.,Engbers G.H.M., White R., Feijen J., (2002) On the iodine process of
plasma polymerized thiophene layers” Synth. Met. Vol. 125 , 429-440You can also read