Temperature dependence for high electrical performance of Mn doped high surface area activated carbon (HSAC) as additives for hybrid capacitor
←
→
Page content transcription
If your browser does not render page correctly, please read the page content below
www.nature.com/scientificreports
OPEN Temperature dependence for high
electrical performance of Mn‑doped
high surface area activated carbon
(HSAC) as additives for hybrid
capacitor
Zambaga Otgonbayar1, Kamrun Nahar Fatema1, Sunhye Yang3,4, Ick‑Jun Kim3, Minchul Kim3,
Sang Eun Shim4* & Won‑Chun Oh1,2*
Herein, we manufactured the positive and negative electrodes for the hybrid capacitor. The Mn-doped
High surface area of Activated carbon composite used for the positive electrode and as-prepared
composite was calcined at 600 °C and 800 °C. The morphological structures and pore-size distributions
of MnYP-600HTT and MnYP-800HTT were characterized by means of XRD, SEM, EDAX, TEM, and BET.
According to the BET specific surface-area evaluation, MnYP-600HTT and MnYP-800HTT were 1272.6
and 1388.1 m2/g, respectively. Total pore volumes were 0.627 and 0.687 cm3/g, which is beneficial
for forming ion-transport channels in electrochemical reactions. The MnYP-600HTT electrode had a
high specific capacity of 177.2 mAh/g at 20C, and the capacity retention was 64.8%. During the entire
cycling, MnYP-600HTT had excellent cyclic stability in 500 cycles along with high efficiency. The robust
design of the MnYP-600HTT and MnYP-800HTT cathode materials introduced in this work pave the
way for designing next-generation supercapacitors operating at ultra-high C rates. The Mn-doped
high surface of activated carbon had stable energy density and superior cycling stability that were
demonstrated in supercapacitor systems.
The development of new technologies for the storage and production of electricity is a green way to prevent
/ reduce the environmental pollution. One of most suitable mechanism is supercapacitor, and it has the rapid
charging/discharging, stable recycling performance with high rate-capability and low cost with environment
friendliness1–5.
One way to change the performance of the electrodes in a capacitor is to develop a nano-sized active material
with a high surface area with particular capacitance. Carbon-based materials have been used as high-capacity
electrode materials for decades6,7. Some researchers synthesize carbon-based electrodes with some transition
metals because of their high storage capability and unique r eversibility8–10, but these kinds of materials still have
some defects such as high price, inefficient electro-chemical stability and the block of the pores of carbon mate-
rial that act as ion-transfer11. Surface activation is the most widely used method of improving the properties of
activated carbon. In addition, the creation of artificial layer on the active-material exterior to prevent any side
reaction mechanism between the electrode and electrolyte, if this attempt is successful the result is good long-
term cycling performance.
Potassium permanganate is one of the nominated reagent for the surface activation reaction12. The role of
KMnO4 is as a surface modifier and intermediate bridge or activator for ion transfer and it is oxidizing agent that
enhances the exterior functional-groups of the active m aterial13. RuO214, NiO15, Co3O416,17, MnO218, NiCo2O419,
CoNiO220, and Fe–V–O21 are used as cathode materials. The working potential of th cathode material is above
0 V vs. SCE and the anode material is below 0 V vs. SCE.
1
Department of Advanced Materials Science and Engineering, Hanseo University, Seosan‑si, Chungnam 356‑706,
Republic of Korea. 2College of Materials Science and Engineering, Anhui University of Science and Technology,
Huainan 232001, People’s Republic of China. 3Korea Electrotechnology Research Institute, 12, Boolmosan‑ro,
10beon‑gil, Seongsan‑gu, Changwon‑si, Gyeongsangnam‑do 51543, Republic of Korea. 4Department of Chemical
Engineering, Inha University, 100 Inha‑ro, Michuhol‑gu, Incheon 22212, Republic of Korea. *email: seshim@
inha.ac.kr; wc_oh@hanseo.ac.kr
Scientific Reports | (2021) 11:534 | https://doi.org/10.1038/s41598-020-79469-7 1
Vol.:(0123456789)
www.nature.com/scientificreports/
Figure 1. (a) Schematic illustration of the model of the Ni-hybrid capacitor, (b) detailed structure of the
positive electrode, (c) detailed structure of the negative electrode.
Mn-treated activated carbon and graphene were studied for the anode material in capacitor. Such as,
Mn3O4/3D-graphene as positive electrode22, Mn-doped Fe2O3@rGO NPs as anode23, LiMn2O4@CNTs@gra-
phene composite for cathode for aqueous hybrid capacitors 24 and Mn-doped ZnS nanosheets (ZnS:Mn NS) as
the positive25. Mn-treated active material had high specific capacitance and excellent cycling profile.
In this regard, Mn-doped HSAC composites were used for the positive electrode and L aNi5 was used for
the negative electrode. Mn-doped HSAC composites were calcined at 600 °C and 800 °C. As-prepared MnYP-
600HTT and MnYP-800HTT cathode electrodes proved to have an exceptional electrochemical performance,
with a specific surface area of 1272.6 and 1388.1 m2/g, a specific capacity of 294.7 mAh g−1 of the charging state,
and 258.4 and 246.1 mAh g −1 of the discharging state in the Charge/Discharge profile after 10 cycles. A Mn-doped
HSAC two-cathode electrode had good stability under a 500-cycle test. Those results are higher than those of
pure pristine, which confirms that MnYP-600HTT and MnYP-800HTT electrodes are stable under long-time
cycles. By comparing these three cycling performance curves, it can be seen that there is a process of activating
capacity that happens during the initial cycles. This approach presented herein offers a promising route for the
rational design of a new class of supercapacitors.
Experiment part
Preparation of Mn‑doped high surface area Activated carbon (HSAC). 1 g of pure pristine dif-
fused into as-prepared 1.5 M of HCl, HNO3 and H2SO4 acidic-solvent. The solution was mixed for 6 h and this
was followed by a vaporization process. The mixture transferred into oven and dried at 110 °C for 8 h until it
turns into a powder. Then acid-treated powder dispersed into 0.5 M concentrated sub-active reagent solution
and stirred for 2 h at 80 °C to create a chemical bond between the sub-active material and activated carbon.
Finally, the composite dried at 100 °C to obtain a powder and then calcined at 600 °C for 2 h for purification and
to improve their surface properties.
Anode manufacturing method. A positive electrode was prepared using β-Ni(OH)2, a conductive mate-
rial CoO (Alfa Aeasar), a binder CMC (Carboxymethyl cellulose), and PTFE (Polyetrafluouroethylene), and the
electrode composition was 95:1:2:2 wt%. In the electrode manufacturing process, binders CMC (Carboxymethyl
cellulose) and PTFE (Polyetrafluouroethylene) were dispersed in DI-water, and then β-Ni(OH)2 and CoO were
added to prepare a slurry electrode using a mixer (Thinky mixer). The electrode slurry to which the activated
carbon additive was applied was added in 10 wt% of the active material to prepare a slurry electrode. The slurry
electrode thus prepared was coated on a Ni-foam type current collector by applying a dip coating process, dried
in a 100 °C oven, and pressed to a thickness of 300 μm using a roll press equipment. The schematic illustration
of the anode was displayed in Fig. 1.
Cathode manufacturing method. A negative electrode was manufactured using LaNi5, a conductive
material KB (Ketjen Black), a binder CMC (Carboxymethyl cellulose), and PTFE (Polyetrafluouroethylene), and
the electrode composition was 93:4:2:1 wt%. In the electrode manufacturing process, binders CMC (Carboxym-
ethyl cellulose) and PTFE (Polyetrafluouroethylene) were dispersed in DI-water, and LaNi5 and KB were added
Scientific Reports | (2021) 11:534 | https://doi.org/10.1038/s41598-020-79469-7 2
Vol:.(1234567890)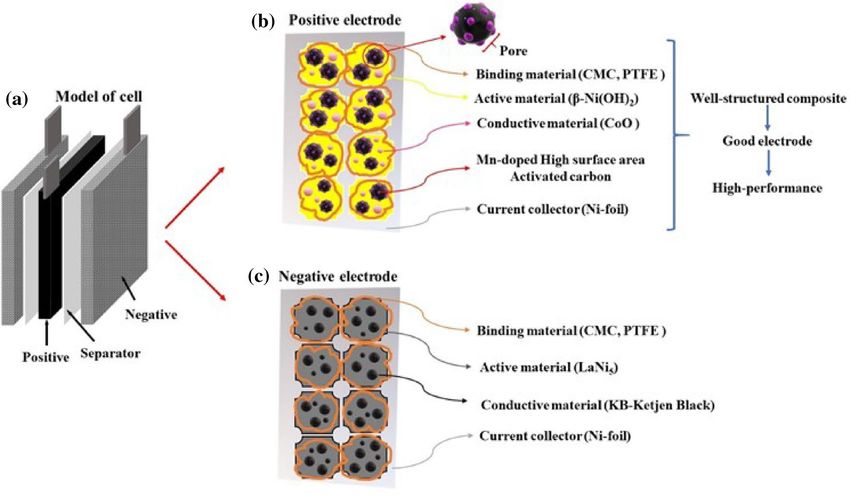
www.nature.com/scientificreports/
Figure 2. XRD pattern of Mn-doped MnYP-600HTT and MnYP-800HTT.
to prepare a slurry electrode using a mixer (Thinky mixer). The slurry electrode thus prepared was coated on a
Ni-foam type current collector by applying a dip coating process, dried in a 100 °C oven, and pressed to a thick-
ness of 250 μm using a roll press equipment. The schematic illustration of the cathode was displayed in Fig. 1.
Cell manufacturing process. We prepared an electrode with a capacity ratio of 1:2.5 of the positive elec-
trode and the negative electrode. A separator was placed between the two negative electrodes, and the positive
electrode was placed in the middle to prepare a cell. We impregnated it with 10 g of 6 M KOH and 0.3 M LiOH
in distilled deionized (DDI) water and kept it under vacuum for 12 h, followed by a cell test.
Characterization. The crystalline structure was examined by X-ray diffraction instrument (SHIMADZU
XRD-6000) with 1°/min scan rate. The morphology of the KMnO4-HSACs were analysed using SEM/TEM and
HRTEM (JSM-5600 JEOL, Japan) (TEM, Hitachi HT7700, operated at 100 kV). The presence of the elements
was analysed via EDX analysis conducted into SEM. The surface chemical state of material was analysed via
X-ray photoelectron spectra (KRATOS AXIS SUPRA).
Electrochemical test. To form a nickel hybrid capacitor cell with electrolyte aging completed, it was
charged with a constant current of 0.1C and discharged to 1.0 V at a constant current of 0.1C, which was done
for 10 cycles. After cell formation was complete, we measured a Nyquist plot at a frequency range of 1–1 MHz
and an amplitude of 10 mV for EIS (Electrochemical Impedance Spectroscopy) analysis. To evaluate the output
characteristics according to the current of the cell, we did a rate capability test in the current range of 0.2–30 C,
with the cell being charged and discharged up to 500 cycles at a constant current of 1C.
Result and discussion
X‑ray diffraction studies and morphological characterization. The XRD pattern of Mn-doped acti-
vated carbon after heat treatment at 600 and 800 °C is shown in Fig. 2. We ascribed the peaks to the presence
of MnO in Mn-YP800HTT. Diffraction peaks at 2θ of 34.9, 40.6, 58.8, 70.3, and 73.8 were ascribed to the crys-
talline planes (111), (200), (220), (311), and (222), respectively, of MnO (JCPDS No. 89-4835) to confirm the
presence of Mn on the activated carbon surface. For Mn-YP600HTT, all peaks showed the presence of Mn3O4.
The diffraction peaks were ascribed to the crystalline planes (112), (103), (211), (004), (220), and (224) of Mn3O4
(JCPDS Card No.00-001-1127). According to the XRD result, the temperature difference can affect the crystal
structure of Mn.
The quantitative as well as qualitative number of the main elements in the catalyst were detected via EDX
analysis, which also revealed each element’s characteristic peak (sharp K α and Kβ). Figure 3 displays the micro-
analysis results of all as-synthesized samples; it shows the presence of the main elements. K, Mn, and O come
from the doping reagent, whereas C comes from the activated carbon. According to the EDAX analysis, a small
amount of Al and Cl were detected. In addition, the amount of Mn was not the same, because of temperature
dependency.
Scientific Reports | (2021) 11:534 | https://doi.org/10.1038/s41598-020-79469-7 3
Vol.:(0123456789)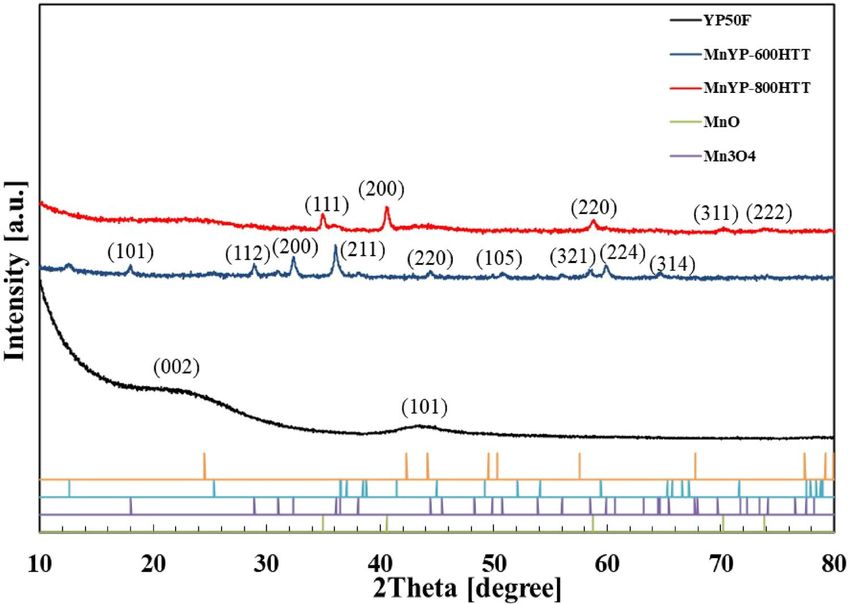
www.nature.com/scientificreports/
Quantitaive analysis
Total
Mn
K
Element
Al MnYP-800HTT
MnYP-600HTT
O
C
0 20 40 60 80 100
Amount (%)
Figure 3. The quantitative analysis results.
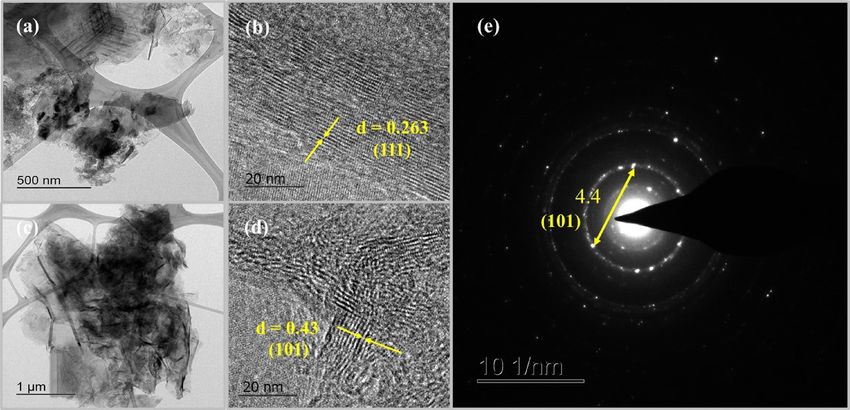
Figure 4. SEM images of Pristine, Mn-doped MnYP-600HTT and MnYP-800HTT.
Scientific Reports | (2021) 11:534 | https://doi.org/10.1038/s41598-020-79469-7 4
Vol:.(1234567890)
www.nature.com/scientificreports/
Figure 5. (a–d) TEM and HRTEM images of Pristine, Mn-doped MnYP-600HTT and MnYP-800HTT, (e)
SAED pattern of Mn-doped HSAC.
We investigated the surface morphology with SEM. Figure 4 shows the SEM analysis results of the Mn-doped
high surface area of activated carbon after 600 °C and 800 °C calcination. The pure pristine had several structures
of particles, as shown in Fig. 4a–d. From the image, it can be seen that the Mn particles fully covered the surface of
activated carbon in MnYP-600HTT. The morphology of MnYP-600HTT was web-shaped, as shown in Fig. 4e–h.
For MnYP-800HTT, the surface of each particle was smooth and covered by Mn. All particles are gathered in
Fig. 4i–l. The amount of Mn was not the same in each prepared sample, which can affect the surface and property
of a composite material. The main role of the large surface area of the pristine is to provide a sufficient area of the
nanocomposite that can be grown on the surface during synthesis. In addition, the graphene made a chemical
bond with precursor reagents by means of oxygen-containing functional groups. Furthermore, the results of
SEM showed the distinction between the Mn-doped HSAC composite under the 600 °C and that under 800 °C.
The atomic structure and information of crystallographic structure of nanocomposite was analyzed via
HRTEM. Figure 5a,c shows the TEM images of Mn-doped HSAC which exhibited that Mn-particles had irregu-
lar shape and all materials is enveloped in high surface area of activated carbon, resulting in a good composite.
Figure 5b,d indicated the lattice fringes of Mn-doped HSAC composite under the 600 °C and that under 800 °C.
The lattice fringes with d-spacing of Mn-doped HSAC was 0.263 and 0.43 nm and these are corresponding to the
(111) and (101) crystal planes of MnO and Mn3O4, respectively. The selected area electron diffraction (SAED)
was used to fully reconstruct the reciprocal space. Figure 5e shows the (101) zone axis and width was 4.4 nm
which can be indexed on the basis of a Mn3O4.
The specific surface area, pore diameter, and pore volume affect the electrochemical properties. Figure 6
shows the N 2-adsorption-desoprtion isotherm of MnYP-600HTT and MnYP-800HTT composites. BET and
BJH method used for the analysis of specific surface area and pore-size distribution. The calculation results
were summarized in Table 1. The relative pressure is (0.5–1.0) P/P0, as shown in Fig. 6. According from Fig. 6,
relation between pore-distribution and isotherm belonged to the H1, this result can confirm the all composites
has slender pore-size. The isotherm type IV is characteristic of mesoporous/micropores adsorbents. The specific
surface area of pure pristine was 1676.1 m 2g-1, and the average pore diameter was 1.85 nm. After the synthesis,
the specific surface area and mean pore diameter were increased in MnYP-800HTT. According to the calculated
T-plot, the total surface area was high in pristine. After Mn-dope and calcination, the surface area decreased,
but MnYP-800HTT still had a larger surface area than did MnYP-600HTT. The total specific surface area of
MnYP-600HTT was 1412.6 m 2/g, whereas MnYP-800HTT had 1578.6 m 2/g. Micropore volume was decreased
from 0.693 to 0.567 cm /g, and mesopore volume increased from 0.084 to 0.120 cm3/g in the MnYP-800HTT
3
sample, which is beneficial for forming ion-transport channels in electrochemical reactions.
To explore the detailed surface chemical state of the elements and interactions between Mn and HSAC, we
did an XPS analysis of Mn-doped HSAC. The binding energies depend on the chemical structure and elemental
formation of the sample. Figure 7a presents the XPS survey spectrum, which shows the existence of C1s, O1s,
Mn, and K, thus confirming the successful formation of Mn-doped activated carbon. Figure 7b shows the C1s
XPS spectrum, which consists of some characteristic peaks, such as carbonyl carbon (C=O, 288.4–288.6 eV),
aliphatic (C–C, 284.4–285.9 eV) and carboxylate carbon (O–C=O, 289.3 eV)26. These peaks corresponded to the
state of carbon with carbon bonded by a single bond (C–C) and the state of carbon linked by a single bond to an
oxygen-containing group (C–O(O)). The C1s XPS shows five notable peaks corresponding to non-oxygenated
carbon (285.24 eV) and carboxylate group (291.22 eV)27. Figure 7c shows the O1s spectra on graphene and Mn.
The peak location relates to the functional group, such as, the O1s peak located at over 531 eV region express the
metal-oxide group, if it is below 531 eV can express the carbonyl or hydroxide group28. In the XPS spectrum of
O1s, the broad peak was located at 531.16 eV, which indicated the carbonyl group. In addition, The second-peak
which located at 553.86 eV expresses the chemical interaction between metal (X) and oxygen. The electronic
Scientific Reports | (2021) 11:534 | https://doi.org/10.1038/s41598-020-79469-7 5
Vol.:(0123456789)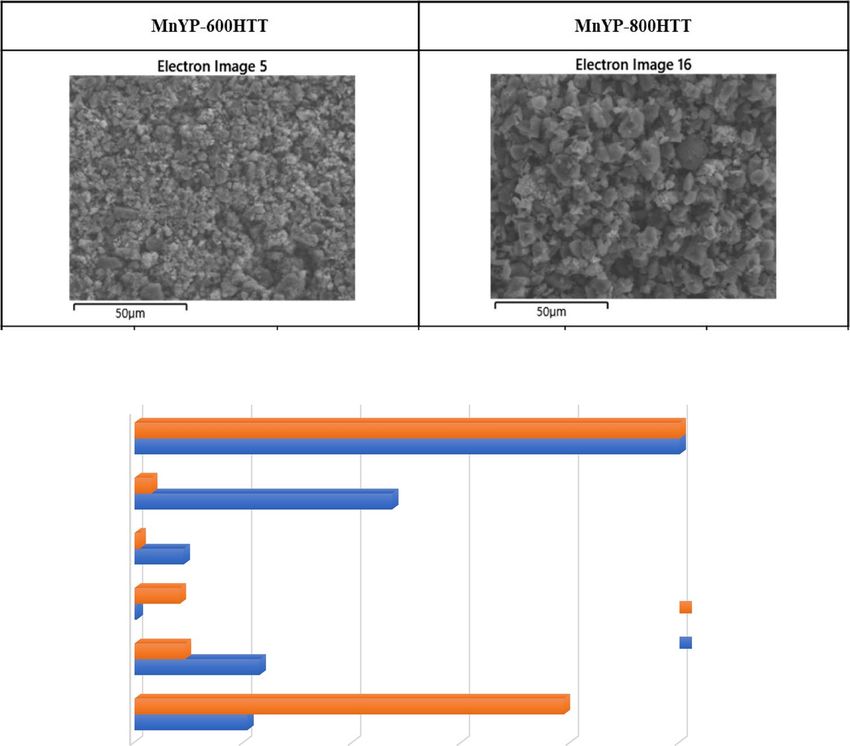
www.nature.com/scientificreports/
Figure 6. Nitrogen adsorption–desorption isotherms of Pristine, Mn-doped MnYP-600HTT and MnYP-
800HTT.
Pore structure parameter
BET T-plot
Micropore
Mn-doped A.C. Surface area Total pore Mean pore Total surface surface area External Micropore Mesopore Micropore vol.
additives (m2/g) volume (cm3/g) diameter (nm) area (m2/g) (m2/g) surface (m2/g) volume (cm3/g) volume (cm3/g) percent (%)
Pristine 1676.1 0.776 1.85 1898.4 1639.4 36.7 0.693 0.084 89
MnYP-600HTT 1272.6 0.627 1.97 1412.6 1236.6 36.0 0.534 0.093 85
MnYP-800HTT 1388.1 0.687 1.98 1578.6 1344.4 43.7 0.567 0.120 83
Table 1. Nitrogen adsorption–desorption isotherms of Pristine, Mn-doped MnYP-600HTT and MnYP-
800HTT.
configuration of Mn2p is shown in two peaks, which correspond to the mixed valence state, as shown in Fig. 7d.
Mn 2p1/2 is located at the 666.23 eV binding energy region, and the Mn 2 p3/2 peak can be deconvoluted into
two peaks of 30.34% Mn3+ (643.32 eV), and 29.54% Mn4+ (647.28 eV), corresponding to the spin–orbit peaks of
Mn with mixed valence states of + 3 and + 4, respectively29. The binding energy shifts indicate the strong bond-
interaction and charge transfer between the Mn and HSAC.
Electrochemical evaluation. Figure 8 presents the charge–discharge profiles of pure pristine and MnYP-
800HTT. The negative electrode was L aNi5 and the as-prepared samples were the positive electrode under the
applied current. The charge–discharge profiles experiment was Super charging at 0.01C, 0.02C, 0.05C × 5 h
(Cut-off time); Super discharge at 0.05C to 1.0 V (Cut-off voltage); Charging at 0.1C × 12 h (120% charging);
and discharging at 0.1C MnYP-600HTT, 1.0 V (Cut-off voltage). During a ten-cycling test, all samples had high
capacity, and MnYP-800HTT showed quite a different charge–discharge profile because of the amount of Mn
and specific surface area. According to the EDAX analysis, the amount of Mn in MnYP-800HTT was 2.98% and
specific surface area and total surface area were higher than in MnYP-600HTT, which was close to pure pristine.
Moreover, the MnYP-600HTT electrode has an obvious charging platform, and the charging characteristics of
the MnYP-600HTT and MnYP-800HTT electrodes are more consistent with similar capacitance characteristics.
Scientific Reports | (2021) 11:534 | https://doi.org/10.1038/s41598-020-79469-7 6
Vol:.(1234567890)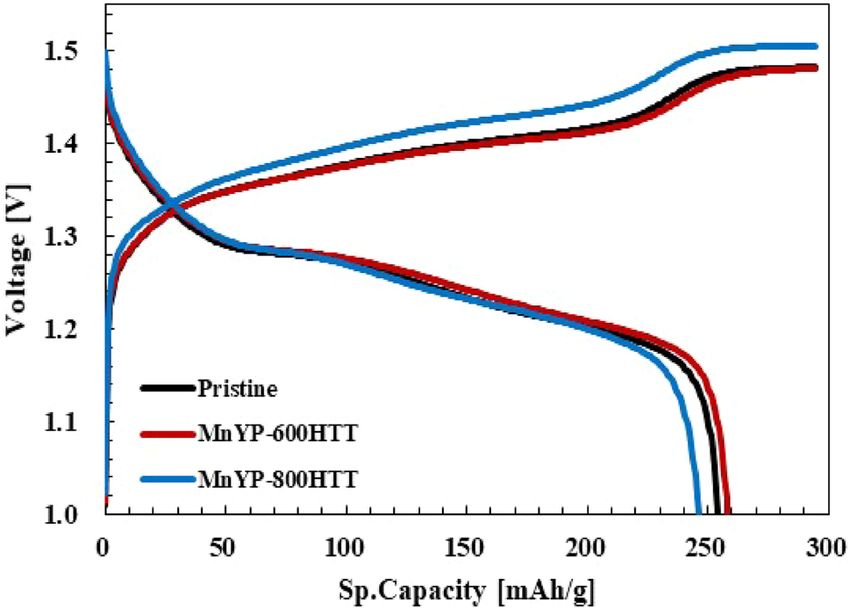
www.nature.com/scientificreports/

                                       (a)                    8x10⁵
                                                                                                                   Full XPS survey
                                                              7x10⁵

                                                              6x10⁵                            O

                                        Intensity (a.u.)
                                                              5x10⁵

                                                              4x10⁵
                                                                                                        Mn
                                                              3x10⁵

                                                              2x10⁵            C

                                                                     5
                                                              1x10

                                                                  0
                                                                         200         400              600            800           1000
                                                                                           Raman shift (cm-1)

                                       (b)                                                                                       C1s
                                                           1.2x10⁵                          C-C
                                                                                   285.24 eV
                                                           1.0x10⁵
                                 Intensity (a.u.)

                                                           8.0x10⁴

                                                           6.0x10⁴
                                                                                                      O-C=O
                                                           4.0x10⁴                                            291.22 eV

                                                           2.0x10⁴

                                                                0.0
                                                                   270               280              290           300            310
                                                                                          Binding energy (eV)
                                        (c)                   5x10⁵
                                                                                   -C=O                                         O1s
                                                                                          531.16 eV
                                                              4x10⁵
                                           Intensity (a.u.)

                                                              3x10⁵

                                                              2x10⁵

                                                              1x10⁵                                          C-O-X
                                                                                                    553.86 eV

                                                                 0
                                                                  520              530        540           550       560          570
                                                                                           Binding energy (eV)

                                       (d)
                                                    1.50x10⁵
                                                                                                                               Mn2p
                                                                                     Mn3+
                                                                                         642.49 eV
                                                    1.25x10⁵
                                 Intensity (a.u.)

                                                                                              Mn2p3/2
                                                    1.00x10⁵                                    643.32 eV

                                                    7.50x10⁴

                                                    5.00x10⁴

                                                                                                                  Mn2p1/2
                                                    2.50x10⁴                                                               666.23 eV

                                                               0.00
                                                                   630             640        650           660       670          680
                                                                                          Binding energy (eV)

                                   Figure 7.  Survey XPS spectrum (a) and high-resolution XPS spectra of (b) C1s, (c) O1s, (d) Mn2p.

Scientific Reports |   (2021) 11:534 |                                                    https://doi.org/10.1038/s41598-020-79469-7           7

                                                                                                                                          Vol.:(0123456789)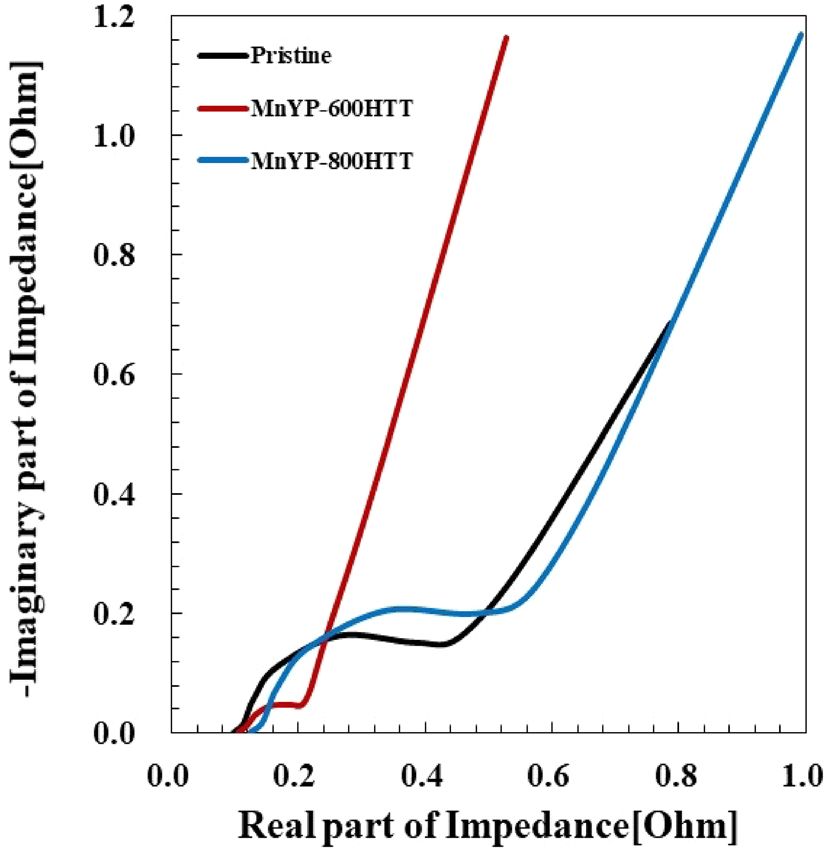
www.nature.com/scientificreports/
(a) 1.5 Pristine
1st
1.4 2nd
3rd
4th
Voltage (V)
1.3 5th
6th
7th
8th
1.2
9th
10th
1.1
1.0
0 50 100 150 200 250 300
Sp.capacity (mAh/g)
(b) 1.5
MnYP-600HTT
1st
1.4 2nd
3rd
Voltage (V)
4th
1.3 5th
6th
7th
1.2 8th
9th
10th
1.1
1.0
0 50 100 150 200 250 300
Sp.capacity (mAh/g)
(c) 1.6
MnYP-800HTT
1.5
1st
1.4 2nd
Voltage (V)
3rd
4th
1.3 5th
6th
7th
1.2 8th
9th
10th
1.1
1.0
0 50 100 150 200 250 300
Sp.capacity (mAh/g)
Figure 8. The charge–discharge profiles of Pristine, Mn-doped MnYP-600HTT, MnYP-800HTT.
Figure 9 shows the charge–discharge profiles of the hybrid device composed with L aNi5 as the negative elec-
trode and the pristine, MnYP-600HTT, and MnYP-800HTT as the positive electrode under an applied current of
state. The experiment was a charge/discharge test (10 cycles): Charging 0.2C × 6 h (cut-off time, 120% charging);
Discharge 0.2C, 1.0 V (Cut-off voltage). The specific capacity of the positive electrode is calculated in Fig. 9. In
the charge state, the amounts of capacity [mAh] of each positive electrode were 94.9 mAh in Pristine, 93.4 mAh
in MnYP-600HTT, and 80.0 mAh in MnYP-800HTT. In the charged state, the capacities of Pristine, MnYP-
600HTT, and MnYP-800HTT were 94.9, 93.4, and 80.8 mAh. The capacities were 81.9, 81.9, and 66.8 mAh in
the discharged state. The specific capacities of Pristine, MnYP-600HTT, and MnYP-800HTT were equal to each
other, at around 294.7 mAh/g. Specific capacities were 254.5, 258.4, and 246.1 mAh/g in the discharged state. The
ultra-specific capacity was successfully demonstrated in MnYP-600HTT. The charging and discharging capacity
Scientific Reports | (2021) 11:534 | https://doi.org/10.1038/s41598-020-79469-7 8
Vol:.(1234567890)www.nature.com/scientificreports/
Figure 9. The charge–discharge profiles of Pristine, Mn-doped MnYP-600HTT and MnYP-800HTT after 10
cycles.
Charge Discharge
Positive Negative Capacity (mAh) Sp. capacity (mAh/g) Capacity (mAh) Sp. capacity (mAh/g)
Pristine LaNi5 94.9 294.7 81.9 254.5
MnYP-600HTT LaNi5 93.4 294.7 81.9 258.4
MnYP-800HTT LaNi5 80.0 294.7 66.8 246.1
Table 2. A table for comparison between Mn-doped carbon materials for supercapacitor.
Figure 10. Nyquist plot of Pristine, Mn-doped MnYP-600HTT and MnYP-800HTT.
and specific capacity of MnYP-800HTT were less than those of the other two samples. A table for comparison
between the Mn-doped carbon materials for supercapacitors is given in Table 2.
Figure 10 shows the Nyquist plots of the electrodes, displaying two depressed semicircles within the fre-
quency range of 1–1 MHz and 10 mv of amplitude. Theoretically, the first semicircle (under high frequency)
may be related to the Mn + displacement passing through the electrode and the next semicircle related to the
charge transfer between electrode/electrolyte. Lastly the Mn ions may diffuse on the electrodes under the low
frequency condition. The real axis state and semicircle profile can relate to the resistivity of the electrolyte, inter-
action between active material and current-collector, charge transfer property. The deviation of the pristine and
MnYP-800HTT was around 40%MnYP-600HTT was 20% in the 0.1–1.0 Ω impedance range. As can be shown
in Fig. 10, we measured Rs of 0.70, 1.16, and 1.17 Ω for pure pristine, Mn-doped MnYP-600HTT, and Mn-doped
Scientific Reports | (2021) 11:534 | https://doi.org/10.1038/s41598-020-79469-7 9
Vol.:(0123456789)www.nature.com/scientificreports/
100
Capacity retention (%)
80
60
Pristine
MnYP-600HTT
40 MnYP-800HTT
20
0 100 200 300 400 500
Cycle index (No.)
Figure 11. Cycling test of Pristine, Mn-doped MnYP-600HTT and MnYP-800HTT under 500 cycles.
Cycle index (no.)
Mn-doped A.C. additives 1st 100th 200th 300th 400th 500th
Pristine
Capacity (mAh) 82.1 80.6 74.7 64.1 42.4 17.3
Sp.Capacity (mAh/g) 261.1 256.4 237.5 204.0 134.9 54.9
Capacity retention (%) 100.0 98.2 91.0 78.1 51.7 21.0
MnYP-600HTT
Capacity (mAh) 83.2 84.0 81.3 76.2 67.4 52.3
Sp.Capacity (mAh/g) 262.8 265.2 256.7 240.5 212.8 165.0
Capacity retention (%) 100.0 100.9 97.7 91.5 81.0 62.8
MnYP-800HTT
Capacity (mAh) 62.7 64.9 64.0 60.9 54.4 43.9
Sp.Capacity (mAh/g) 231.1 239.4 235.8 224.5 200.7 161.6
Capacity retention (%) 100.0 103.6 102.0 97.1 86.8 69.9
Table 3. Cycling test result of Pristine, Mn-doped MnYP-600HTT and MnYP-800HTT under 500 cycles.
MnYP-800HTT electrodes, respectively. The Mn-doped MnYP-600HTT nanocomposite shows lower Rs than
does the Mn-doped MnYP-800HTT nanocomposite, attributed to the doping effect by Mn in the MnYP-600HTT
and MnYP-800HTT nanocomposite. Lower resistance confirmed that the sample has a high conductive prop-
erty. Comparing the EIS of the three cases, MnYP-600HTT and MnYP-800HTT had a significant slope on the
Y axis in the low-frequency region due to the easy absorption/reception of electrode ions. Furthermore, in the
low-frequency region, the EIS of Mn-doped MnYP-600HTT is even more inclined to the imaginary axis than is
the Mn-doped MnYP-800HTT, indicating that Mn doping in the electrodes promotes the formation of a more
effective channel, which is more conducive for the ion diffusion.
We tested the cycling stability of pure pristine, Mn-doped MnYP-600HTT, and Mn-doped MnYP-800HTT
electrodes by using GCD measurements at 1 V for 500 cycles, as shown in Fig. 11. The values of capacitance
retention for pure pristine, Mn-doped MnYP-600HTT, and Mn-doped MnYP-800HTT electrodes were 100%
of the maximum capacitance at the first cycle. After the 500th cycling test, the Mn-doped MnYP-600HTT and
Mn-doped MnYP-800HTT electrodes were at 62.8 and 69.9% of the 52.3 and 43.9 mAh capacity. Those results
are higher than for pure pristine, which confirms that Mn-doped MnYP-600HTT and MnYP-800HTT electrodes
are stable under long-time cycles.
The activation process happens in the initial recycling step and the activation time depend on the active
material. Mn-doped electrode required a long activation time due to recrystallization. Above mentioned fac-
tor affects the decay-time of MnYP-600HTT and MnYP-800HTT in the charge/discharge cycles. Clearly, Mn-
doped MnYP-600HTT and MnYP-800HTT can achieve both relatively high specific capacity and good cycling
behavior, simultaneously. The specific capacity of Mn-doped MnYP-600HTT was 262.8 mAh/g, and Mn-doped
Scientific Reports | (2021) 11:534 | https://doi.org/10.1038/s41598-020-79469-7 10
Vol:.(1234567890)www.nature.com/scientificreports/
(a) 1.6
0.2C
Pristine 0.5C
1C
1.4 2C
3C
Voltage (V)
5C
1.2 7C
10C
15C
1.0 20C
0.8
0.6
0 40 80 120 160 200 240 280 320
Sp.capacity (mAh/g)
(b)
1.6
MnYP-600HTT
1.4
Voltage (V)
1.2
0.2C
0.5C
1.0 1C
2C
3C
5C
0.8
7C
10C
15C
0.6 20C
0 40 80 120 160 200 240 280 320
Sp.capacity (mAh/g)
(c) 1.6
MnYP-800HTT
1.4
Voltage (V)
1.2
0.2C
0.5C
1.0 1C
2C
3C
5C
0.8
7C
10C
15C
0.6 20C
0 40 80 120 160 200 240 280 320
Sp.capacity (mAh/g)
(d)
100
90
Capacity retention (%)
80
70
60
Pristine
50
MnYP-600HTT
MnYP-800HTT
40
30
0.5C 2C 5C 10C 20C
C-rate (C)
Figure 12. Rate capability test of Pristine, Mn-doped MnYP-600HTT and MnYP-800HTT under different C.
Scientific Reports | (2021) 11:534 | https://doi.org/10.1038/s41598-020-79469-7 11
Vol.:(0123456789)www.nature.com/scientificreports/
C-rate (C)
Mn-doped A.C. additives 0.2C 0.5C 1C 2C 3C 5C 7C 10C 15C 20C
Pristine
Sp. capacity (mAh/g) 265.0 255.6 246.2 234.1 224.2 208.7 194.0 173.2 168.6 152.9
Capacity retention (%) 100.0 96.5 92.9 88.4 84.6 78.8 73.2 65.4 63.6 57.7
MnYP-600HTT
Sp. capacity (mAh/g) 273.6 265.2 257.9 247.0 238.7 225.9 215.4 200.3 194.5 177.2
Capacity retention (%) 100.0 96.9 94.3 90.3 87.3 82.6 78.7 73.2 71.1 64.8
MnYP-800HTT
Sp. capacity (mAh/g) 244.7 229.1 214.3 196.7 185.1 167.4 154.8 139.5 134.8 121.3
Capacity retention (%) 100.0 93.6 87.6 80.4 75.6 68.4 63.3 57.0 55.1 49.6
Table 4. Rate capability property of Pristine, Mn-doped MnYP-600HTT and MnYP-800HTT under different
C.
MnYP-800HTT had 231.1 mAh/g at the 1st cycle. After the 500th cycle, the specific capacities were decreased to
165.0 and 161.6 mAh/g, respectively. The capacity, specific capacitance, and capacity retention (%) of all samples
are summarized in Table 3. More specifically, Mn-doped HSAC materials exhibited a high specific capacitance,
and the loss of specific capacities was around 37.21% and 30.07% in each Mn-doped sample. In addition to such
a high mass loading, high specific capacity and good cycle performance were also achieved, indicating that our
method is feasible for practical application of the positive electrode materials in a supercapacitor.
The rate capability performance was conducted for the Mn-doped HSAC cathode electrode. As shown in
Fig. 12, the Mn-doped MnYP-600HTT cathode electrodes outperformed the pure Pristine electrode at various
cycling conditions. The peaks were obtained in the 0.6–1.5 voltage region. The specific capacity of the Mn-doped
HSAC cathode electrode is calculated in Fig. 12. The specific capacity of the pure Pristine was 265.0 mAh/g at
0.2C and decreased to 152.9 mAh/g at 20C. For the MnYP-600HTT, MnYP-800HTT had 273.7 mAh/g and 244.7
mAh/g. This result decreased to 177.2 mAh/g and 121.3 mAh/g at 20C. According to the above result, the Mn-
doped MnYP-600HTT cathode had high capacity because of the amount of Mn-doping. The capacity retention
of MnYP-600HTT decreased from 100 to 64.8%. The retention of MnYP-800HTT decreased from 100 to 49.6%.
All results are summarized in Table 4.
All the above results confirmed that Mn-doped MnYP-600HTT electrode had a high rate capability and
electrochemical property. The prominent rate capability of the Mn-doped MnYP-600HTT and MnYP-00HTT
electrode can be ascribed to the unique structure, in which HSAC formed connections with Mn. The structure
of the active material can upgrade the contact area between electrolyte and electrode surface, redox reaction
rate. As a result, the ion-transfer performance of active-material increase in the electrochemical analysis. The
total electrochemical results confirmed that a certain amount of Mn-doping under a correct calcination process
can enhance the electrochemical property of HSAC materials. Furthermore, our mentioned method and results
confirmed that Mn with an ultra-high surface area of activated carbon exhibited a good electrochemical prop-
erty and upgraded the class of supercapacitors. Recently, some research papers reported Mn-doped graphene
oxide and activated carbon for the supercapacitor, such as Mn-doped F e2O3@rGO hollow core–shell spheres,
MnO nanoparticles with fluorine-doped carbon30, V2O5/polyindole (V2O5/PIn) decorated onto the activated
carbon31. Other supercapacitor materials have been studied in the field of energy storage devices, such as 3D
Na2Ti3O7 nanosheet arrays/carbon textiles anodes joined sodium‐Ion pseudocapacitors32 NiS2 nanosheets on
porous carbon microtubes33. The Mn-doped Fe2O3@rGO hollow core–shell spheres increased the active regions
of redox reactions, where remarkable electrochemical properties with a specific capacity of 285 mAh g−1 after
the 1000th cycling test. The MnO nanoparticles with fluorine-doped carbon had 40 mAh g−1 after 200 cycles.
Above noted all capacitor material showed good conductivity, high energy and high safety. According to the
above-mentioned articles, the specific capacitance of each sample was less than that of our prepared Mn-doped
high surface area of activated carbon. Furthermore, the charge-transfer properties of the above samples had
much less than the Mn-doped HSAC because of the big semicircle in the Nyquist plot. The Mn-doped high
surface of activated carbon had stable energy density and superior cycling stability that were demonstrated in
our supercapacitor system.
Conclusion
In summary, the positive electrode was prepared by means of the Mn-doped high surface area of activated
carbon (HSAC), and LaNi5 was used for the negative electrode. The prominent rate capability of the Mn-doped
MnYP-600HTT and MnYP-00HTT electrode can be ascribed to the unique structure, in which HSAC formed
connections with Mn. The special-structured active material increased the redox-reaction rate, contact area
between electrolyte and electrode, it can improve the electrochemical performance of the material. Clearly,
Mn-doped MnYP-600HTT and MnYP-800HTT can achieve both relatively high specific capacity and good
cycling behavior, simultaneously. The specific capacity of Mn-doped MnYP-600HTT was 262.8 mAh/g, and
Mn-doped MnYP-800HTT had 231.1 mAh/g at the 1st cycle. After the 500th cycle, the specific capacities were
decreased to 165.0 and 161.6 mAh/g, respectively. The specific surface area of MnYP-800HTT was higher than
that of MnYP-600HTT, and the Mn amount in MnYP-600HTT was 47.22%, and in MnYP-800HTT was 2.98%.
The Mn-amount can affect the surface of HSAC and change the electrochemical property. The Mn-doped high
Scientific Reports | (2021) 11:534 | https://doi.org/10.1038/s41598-020-79469-7 12
Vol:.(1234567890)www.nature.com/scientificreports/
surface of activated carbon had stable energy density and superior cycling stability as were demonstrated in our
supercapacitor system.
Received: 7 September 2020; Accepted: 26 October 2020
References
1. Kang, K. & Ceder, G. Battery materials for ultrafast charging and discharging. Nature 458, 190–193 (2009).
2. Yang, C. C., Sun, W. C., Kumar, A., Pattanayak, B. & Tseng, T. Y. Templating synthesis of nickel cobaltite nanoflakes and their
nanocomposites for making high-performance symmetric supercapacitors. Mater. Today Energy 14, 100356 (2019).
3. Simon, P., Gogotsi, Y. Materials for electrochemical capacitors, nanoscience and technology: A collection of reviews from nature
journals. World Sci. 320–329 (2010).
4. Jiang, W. et al. Ternary hybrids of amorphous nickel hydroxide–carbon nanotube-conducting polymer for supercapacitors with
high energy density, excellent rate capability, and long cycle life. Adv. Funct. Mater. 25, 1063–1073 (2015).
5. He, G. et al. Self-standing electrodes with core-shell structures for high-performance supercapacitors. Energy Stor. Mater. 9, 119–125
(2017).
6. Zhou, S. Z., Zhou, G. Y., Jiang, S. H., Fan, P. C. & Hou, H. Q. Flexible and refractory tantalum carbide-carbon electro spun nanofib-
ers with high modulus and electric conductivity. Mater. Lett. 200, 97–100 (2017).
7. Chen, D., Hu, X., Huang, Y., Qian, Y. & Li, D. Facile fabrication of nanoporous BCN with excellent charge/discharge cycle stability
for high-performance supercapacitors. Mater. Lett. 246, 28–31 (2019).
8. Wang, Y. C. et al. Reduced mesoporous Co3O4 nanowires as efficient water oxidation electrocatalysts and supercapacitor electrodes.
Adv. Energy. Mater. 4, 1400696 (2014).
9. Yu, M. H. et al. Valence-optimized vanadium oxide supercapacitor electrodes exhibit ultrahigh capacitance and super-long cyclic
durability of 100,000 cycles. Adv. Funct. Mater. 25, 3534–3540 (2015).
10. Ji, H. M. et al. In situ preparation of sandwich MoO3/C hybrid nanostructures for high-rate and ultralonglife supercapacitors. Adv.
Funct. Mater. 25, 1886–1894 (2015).
11. Ko, W. Y., Liu, Y. C., Lai, J. Y., Chuang, C. C. & Lin, K. J. The effect of EV aggregators with time-varying delays on the stability of
a load frequency control system. ACS Sustain. Chem. Eng. 7, 669–678 (2018).
12. Cho, Y., Oh, P. & Cho, J. A new type of protective surface layer for high-capacity Ni-based cathode materials: nano scaled surface
pillaring layer. Nano Lett. 13, 1145 (2013).
13. Sun, Y. K., Lee, D. J., Lee, Y. J., Chen, Z. & Myung, S. T. Cobalt-free nickel rich layered oxide cathodes for lithium-ion batteries.
ACS Appl. Mater. Interfaces 5, 11434 (2013).
14. Warren, R., Sammoura, F., Tounsi, F., Sanghadasa, M. & Lin, L. Highly active ruthenium oxide coating via ALD and electrochemical
activation in supercapacitor applications. J. Mater. Chem. A 3, 15568–15575 (2015).
15. Kim, S. I., Lee, J. S., Ahn, H. J., Song, H. K. & Jang, J. H. Facile route to an efficient NiO supercapacitor with a three-dimensional
nanonetwork morphology. ACS Appl. Mater. Interfaces 5, 1596–1603 (2013).
16. Lai, C., Sun, Y. & Lin, B. Synthesis of sandwich-like porous nanostructure of supercapacitors. Mater. Today Energy 13, 342–352
(2019).
17. Gopi, C. V. M. et al. One-pot synthesis of copper oxide–cobalt oxide core–shell nano cactus-like heterostructures as binder-free
electrode materials for high-rate hybrid supercapacitors. Mater. Today Energy 14, 100358 (2019).
18. Yu, G. et al. Enhancing the supercapacitor performance of graphene/MnO2 nanostructured electrodes by conductive wrapping.
Nano Lett. 11, 4438–4442 (2011).
19. Yuan, C. et al. Ultrathin mesoporous NiCo2O4 nanosheets supported on Ni foam as advanced electrodes for supercapacitors. Adv.
Funct. Mater. 22, 4592–4597 (2012).
20. Zhang, J., Chen, Z., Wang, Y. & Li, H. Morphology-controllable synthesis of 3D CoNiO2 nano-networks as a high-performance
positive electrode material for supercapacitors. Energy 113, 943–948 (2016).
21. Wei, Q. et al. Sodium ion capacitor using pseudocapacitive layered ferric vanadate nanosheets cathode. iScience 6, 212–221 (2018).
22. Liu, C. et al. High energy and power lithium-ion capacitors based on Mn3O4/3D-graphene as anode and activated polyaniline-
derived carbon nanorods as cathode. Chem. Eng. J. 370, 1485–1492 (2019).
23. Zhang, J. et al. Hierarchical Mn-doped Fe2O3@rGO hollow core-shell spheres for high-performance hybrid capacitor. Mater. Today
Energy 17, 100388 (2020).
24. Chen, L. et al. Integrated nanocomposite of LiMn2O4/graphene/carbon nanotubes with pseudocapacitive properties as superior
cathode for aqueous hybrid capacitors. J. Electroanal. Chem. 842, 74–81 (2019).
25. Iftikhar, H., Debananda, M, Ganesh, D., Charmaine, L., Saad, G.M., Mostafa, S.S., Jae, J.S. Different controlled nanostructures of
Mn-doped ZnS for high-performance supercapacitor applications. J. Energy Storage, 32, 101767 (2020).
26. Teeparthi, S. R., Awin, E. W. & Kumar, R. Dominating role of crystal structure over defect chemistry in black and white zirconia
on visible light photocatalytic activity. Sci. Rep 8, 5541 (2018).
27. Hui, L., Shuang, L., Zhiling, Z., Xiaonan, Ali, A., Nguyen, D. C. T., Cho, K. Y., Oh, W. C. A simple ultrasonic-synthetic route of
Cu2Se-graphene-TiO2 ternary composites for carbon dioxide conversion processes, Fullerenes Nanotubes Carbon Nanostruct.
26(12), 827–836 (2018).
28. Navı´o, J.A., Hidalgo, M.C., Colo´n, G., Botta, S.G., Litter, M.I. Preparation and physicochemical properties of Z rO2 and Fe/ZrO2
prepared by a sol-gel technique, Langmuir 17, 202–210 (2001).
29. Wang, Y. et al. A reduced graphene oxide/mixed-valence manganese oxide composite electrode for tailorable and surface mount-
able supercapacitors with high capacitance and super-long life. Energy Environ. Sci. 10, 941–949 (2017).
30. Qu, D. et al. Synthesis of MnO nano-particle@Flourine doped carbon and its application in hybrid supercapacitor. Appl. Surf. Sci.
413, 344–350 (2017).
31. Xi, Z. et al. Bamboo-like composites of V 2O5/polyindole and activated carbon cloth as electrodes for all-solid-state flexible asym-
metric supercapacitors. ACS Appl. Mater. Interfaces 8, 3776–3783 (2016).
32. Shengyang, D. et al. Flexible sodium-ion pseudocapacitors based on 3D N a2Ti3O7 nanosheet arrays/carbon textiles anodes. Adv.
Funct. Mater. 26, 3703–3710 (2016).
33. Jing, Z. et al. Growing NiS2 nanosheets on porous carbon microtubes for hybrid sodium-ion capacitors. J. Power Sources 451,
227737 (2020).
Acknowledgements
This research was supported by the Korean Electrotechnology Research Institute (KERI) primary research pro-
gram through the National Research Council of Science and Technology (NST) funded by the Ministry of Sci-
ence, ICT (MSIT) (No. 20A01029).
Scientific Reports | (2021) 11:534 | https://doi.org/10.1038/s41598-020-79469-7 13
Vol.:(0123456789)www.nature.com/scientificreports/
Author contributions
W.C.O. planned the research, and S.Y., I.J.K., M.C. Kim and S.E.S. analyzed samples in South Korea. O.Z. and
K.N.F. wrote the manuscript.
Competing interests
The authors declare no competing interests.
Additional information
Correspondence and requests for materials should be addressed to S.E.S. or W.-C.O.
Reprints and permissions information is available at www.nature.com/reprints.
Publisher’s note Springer Nature remains neutral with regard to jurisdictional claims in published maps and
institutional affiliations.
Open Access This article is licensed under a Creative Commons Attribution 4.0 International
License, which permits use, sharing, adaptation, distribution and reproduction in any medium or
format, as long as you give appropriate credit to the original author(s) and the source, provide a link to the
Creative Commons licence, and indicate if changes were made. The images or other third party material in this
article are included in the article’s Creative Commons licence, unless indicated otherwise in a credit line to the
material. If material is not included in the article’s Creative Commons licence and your intended use is not
permitted by statutory regulation or exceeds the permitted use, you will need to obtain permission directly from
the copyright holder. To view a copy of this licence, visit http://creativecommons.org/licenses/by/4.0/.
© The Author(s) 2021
Scientific Reports | (2021) 11:534 | https://doi.org/10.1038/s41598-020-79469-7 14
Vol:.(1234567890)You can also read