Housing affordability and availability - Canterbury Wellbeing Index - Community & Public Health
←
→
Page content transcription
If your browser does not render page correctly, please read the page content below
Canterbury Wellbeing Index

Housing affordability and
availability
    2016

The Canterbury Wellbeing Index tracks the progress of social recovery
in greater Christchurch following the earthquakes using indicators to
identify emerging social trends and issues.

Why are housing affordability and availability important?
Access to housing is a basic human need. There is also growing recognition that good-quality,
affordable housing is essential for strong communities.
Affordable housing is usually defined as housing (rented or owned) that costs no more than
30 per cent of a household’s gross income.1
Affordability and availability are closely linked. Where housing supply is low and demand for houses
is high, the market prices increase. People with limited income may find it more difficult to obtain
affordable housing.
Changes in relative levels of affordability also affect the demand for different types of housing. For
example, if home ownership becomes less affordable, more households will rent.
Poor-quality or overcrowded housing can affect people’s mental and physical health.2 In particular,
housing that is cold, damp, and mouldy significantly worsens the health of older people, young
children, and people who already have health problems.3 Adequate housing is particularly important
for children, as poor-quality accommodation can limit their educational attainment.4

How were housing affordability and availability impacted by
the earthquakes?
As a result of the 2010 and 2011 earthquakes, there were an estimated 167,740 properties in greater
Christchurch with a dwelling damage claim.5 Of these properties, 26,147 were seriously damaged
(over the $100,000 EQC cap) and 8,061 were classified as being within the residential red zone. Over
half the respondents (51 per cent) in the 2012 CERA Wellbeing Survey reported having to ‘live day to
day in a damaged home’ and 22 per cent said this had a negative impact on their everyday life.
Housing New Zealand Corporation (HNZC) and Christchurch City Council (CCC) provide social
housing to people with a serious housing need.
Prior to the earthquakes, HNZC had 6,127 housing units in greater Christchurch, which housed
approximately 18,000 people. Ninety-five per cent of HNZC’s housing units were damaged in the
earthquakes with 550 deemed uninhabitable, including 215 in the residential red zone (188 in
Christchurch and 27 in Kaiapoi).6
Prior to the earthquakes, CCC had 2,649 housing units in Christchurch. Ninety-seven per cent of
CCC’s housing units were damaged in the earthquakes with 366 deemed uninhabitable, including
113 in the residential red zone.a
Detailed engineering evaluations have been completed on all housing units to determine whether
they were structurally able to withstand any earthquakes in the future. Unoccupied units have been
prioritised for evaluation and repair/rebuild as a way of increasing the supply of units available for
rent.
After each of the major earthquakes, the immediate response of both organisations was to establish
the wellbeing of tenants and ensure properties had access to essential services. Urgent repairs were
made and, where necessary, tenants were re-housed.
International evidence indicates that the quantity of low-cost, private rental accommodation reduces
after a disaster.7,8,9,10,11 This is partly due to the loss of properties that are not rebuilt and higher rents
charged for houses that have been repaired to a higher standard.
a
 In addition to HNZC and CCC, it is estimated that there are an additional 704 beds provided by non-governmental organisations in
Christchurch. Ministry of Business, Innovation and Employment. (2013). Housing pressures in Christchurch: a summary of the evidence.
Ministry of Business, Innovation and Employment.

                     Canterbury Wellbeing Index 2016 | Housing affordability and availability | 1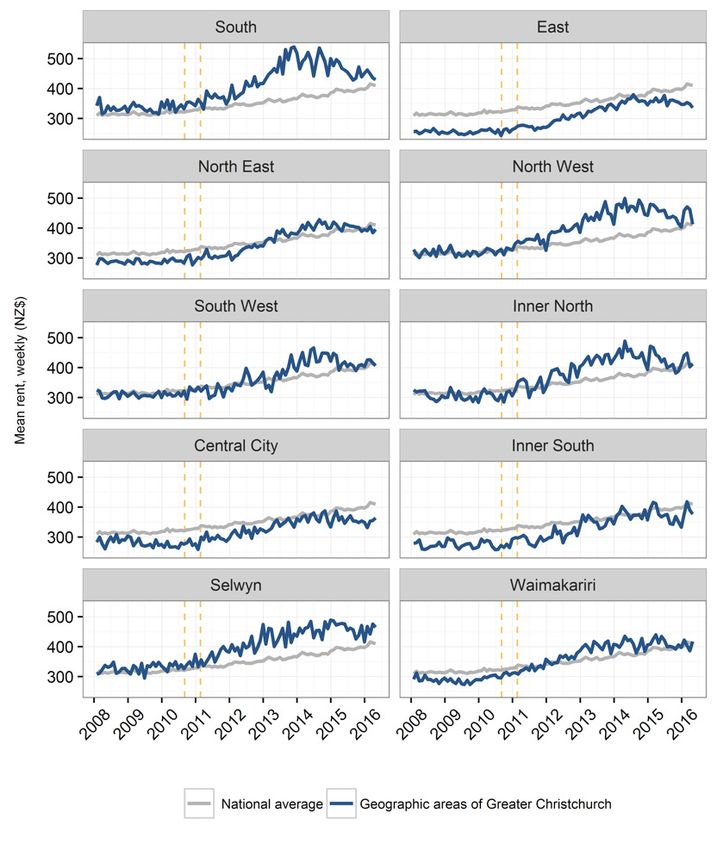
According to tenancy bonds data, in the year to January 2011 there were 9,954 bonds lodged with
weekly rents below $300 in greater Christchurch, but in the year to January 2016 this number stood
at 3,456, up slightly from 3,378 in the year to January 2015.12 This suggests there has been a
65 per cent reduction in the supply of low-cost private rental stock between 2011 and 2016.
In addition to private rental housing, some niche forms of housing were particularly affected by the
earthquakes. For example, at least 250 beds in boarding houses, bedsits, and low-cost, one-bedroom
units in the east of the inner city were lost.13

What is happening now?

Housing and wellbeing
There is evidence that earthquake-related housing and insurance issues can act as ‘secondary
stressors’ that have a direct impact on individual and community resilience. Secondary stressors
are circumstances, events, or policies that are indirectly related to the primary stressor (the
earthquakes).14 Secondary stressors typically persist longer and can delay people’s recovery.
International experience shows that delays in insurance and housing recovery are secondary
stressors, as is living in temporary accommodation.15
In the April 2016 Canterbury Wellbeing Survey, 10 per cent of respondents reported that dealing
with insurance issues had a strong (moderate or major) negative impact on their everyday life, a
substantial improvement from 37 per cent in September 2012. Nine per cent said ‘decisions about
house damage, repairs and relocation’ were still having a strong negative impact on their everyday
lives, compared with 29 per cent in 2012.
Housing and insurance-related issues continue to have significant impacts on the wellbeing of those
with on-going repair and rebuild issues, but there has been progress in resolving earthquake-related
dwelling claims. By the end of the second quarter of 2016, 140,575 of the approximately 141,593
property claims under the EQC cap had been settled, as had 21,005 of the 26,147 over-cap claims
lodged with private insurers. This is a total of 161,580 properties, representing 96.3 per cent of the
approximately 167,740 properties with earthquake dwelling claims in greater Christchurch.

Housing affordability and availability
Since the earthquakes, three significant market pressures have impacted on housing affordability and
availability, particularly in the rental market:
•	Permanent relocation of households from the residential red zone and other homes that cannot
   be repaired or rebuilt
•	Displaced households requiring temporary accommodation while their homes are repaired or
   rebuilt
•	The arrival of the labour force that is assisting with the rebuild.
Canterbury housing recovery programmes were previously delivered jointly by Canterbury Earthquake
Recovery Authority (CERA) and the Ministry of Business, Innovation and Employment (MBIE).
CERA was responsible for ‘residential repair and rebuild’ including:
•	brokering solutions for emerging residential repair and rebuild issues
•	monitoring the pace and rate of insurance settlements
•	participating in governance of the Residential Advisory Service (RAS) and operational delivery of
   RAS services

               Canterbury Wellbeing Index 2016 | Housing affordability and availability | 2
MBIE was responsible for a ‘New Housing Action Plan’, which was partially implemented through the
Christchurch Housing Accord (the Accord), with activities including:
•	monitoring the housing market generally and providing advice (as needed) on housing supply, the
   housing shortfall, rents and house prices
•	provision of temporary village accommodation and the Canterbury Earthquake Temporary
   Accommodation Service (CETAS)
•	supporting the Accord implementation in partnership with the Christchurch City Council (CCC)
•	using the Accord fund to facilitate residential development at Awatea, and at Welles and Colombo
   Street sites
•	supporting analysis of residential aspects of the Land Use Recovery Plan, Christchurch Central
   Recovery Plan, and Christchurch District Plan Review
MBIE also provided support for CERA’s Residential Repair and Rebuild work. For example, by
providing technical guidance on residential construction, surveying the quality of earthquake repairs,
and providing a technical engineering panel to support RAS.
From 1 December 2015, as provided for in the The Transition Recovery Plan ‘Greater Christchurch
Earthquake Recovery: Transition to Regeneration’, MBIE assumed full responsibility for the residential
repair and rebuild programme work when CERA was disestablished.

Short- and medium-term solutions for temporary accommodation
After the February 2011 earthquake, the exact number of people needing urgent accommodation was
unknown. MBIE commissioned 350 campervans to provide temporary shelter for displaced residents
and HNZC established an 0800 service to match displaced residents with unused private homes or
holiday homes. However, uptake of these services was relatively low as people opted to stay with
friends and family.
In 2011, MBIE partnered with the Ministry of Social Development (MSD) to form the Canterbury
Earthquake Temporary Accommodation Service (CETAS).
Under CETAS, MBIE has a responsibility to coordinate the provision of temporary accommodation
to earthquake affected residents, and manage the government’s Canterbury earthquake temporary
accommodation housing stock, comprising:
•	Kaiapoi village (22 re-locatable homes), opened July 2011, closed April 2016 – due to easing
   demand
•   Linwood Village (42 re-locatable houses), opened August 2011
•   Rawhiti Village (20 re-locatable houses), opened July 2012
•   Rangers Park (40 permanent houses), opened September 2013

Residents are eligible for CETAS assistance to find temporary accommodation, including
accommodation in the temporary village housing, when they are the legal owner or tenant of a house
that is confirmed as having earthquake damage and the household must vacate that house for repair,
rebuild or remedial work to begin.
Since August 2011, CETAS has helped over 6,360 earthquake affected residents find temporary
accommodation, including placing over 1,160 households into temporary accommodation village
housing. The median length of stay in the temporary villages is currently 42 nights for occupants
whose home is being repaired and 234 nights for occupants whose home is being rebuilt.
Demand for assistance to find temporary accommodation is reducing. Currently, CETAS is managing
240 displaced residents/households, down from 470 in June 2015 and 830 in June 2014.
MSD’s obligations under CETAS are to support households affected by the earthquakes to plan their
recovery and connect to the services they need. This support is provisioned through the Earthquake
Support Coordination (ESC) Service. By 30 April 2016, 10,406 individuals and families had registered
with this service.

               Canterbury Wellbeing Index 2016 | Housing affordability and availability | 3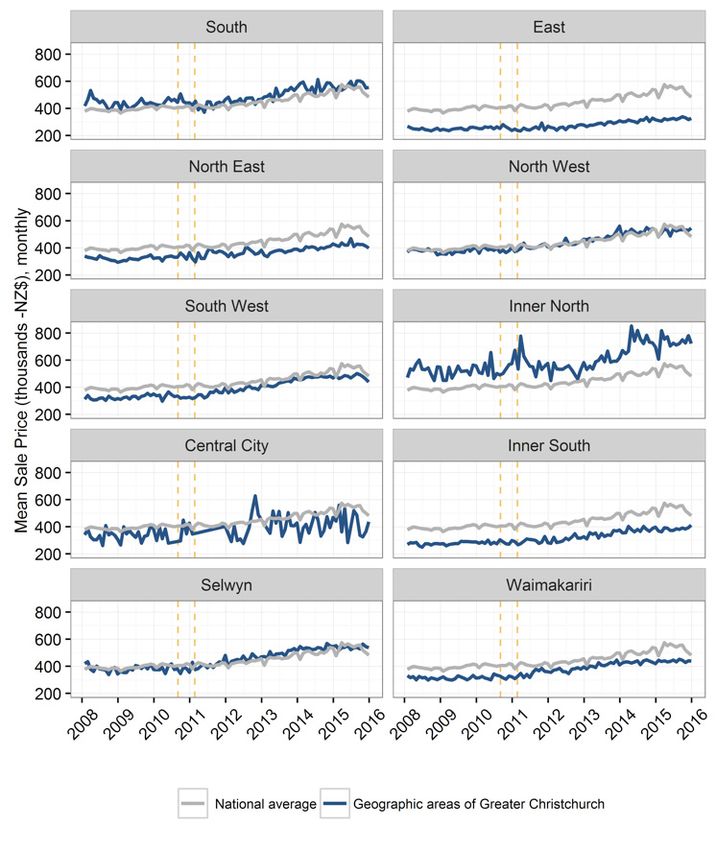
MSD has another role under CETAS, to provision government financial Temporary Accommodation
Assistance (TAA) to support homeowners who have a temporary accommodation cost (e.g.
rent, board or motel stays). This assistance is only available once insurance cover for temporary
accommodation costs has expired; it is not income or asset tested. In total, 3,259 households have
received this financial support since 2011 at a total cost of over $50 million. As at 30 April 2016, 315
households were receiving it, a total of $86,322 weekly. TAA is currently funded until December 2017.
On 1 December 2015, MBIE inherited the Residential Advisory Service (RAS) when CERA was
disestablished. The RAS was established in May 2013 and provides free independent legal and
technical advice to residential property owners to enable progression of their unresolved insurance
claim. Since 2013 the RAS has helped over 3,500 property owners.

Social and affordable housing
The earthquakes had a significant impact on social and affordable housing demand and supply.
Supply of low-cost housing fell after the earthquakes, particularly within the rental market and social
housing sector, while demand for low-cost accommodation increased. MBIE’s March 2013 Housing
Pressures Report documented these changes and the subsequent increasing trend in overcrowding,
homelessness and demand for NGO services.16
By December 2012, HNZC had repaired and tenanted 212 vacant earthquake-damaged homes.
In April 2013, it reached a $320 million settlement with insurers over 5,559 homes damaged in the
Canterbury earthquakes, which has enabled it to develop its repair and rebuild programme.
HNZC announced that by the end of December 2015, up to 5,000 of its earthquake-damaged
properties would be repaired. In addition, up to 700 new houses would be built to replace housing
lost due to the earthquakes, including red-zoned housing. HNZC subsequently completed all
repairs in 2015, as well as 643 new builds. A further 59 new builds are scheduled for completion by
September 2016, and a further 100-150 new houses are planned to be constructed in Canterbury
from next year on.
The Government’s Social Housing Fund provided $24 million of capital grant funding between
2012 and 2015 to support the provision of new social and affordable housing in Canterbury. This
was supplemented by $10 million from the Canterbury Community Trust (now known as the Rātā
Foundation). In total this funding will deliver 194 units with a total project value of $56 million. As at
30 June 2016, 136 houses had been completed, with the remaining 58 houses currently expected to
be completed by June 2017.
In 2014 the Government also announced a Housing Accord with the CCC to boost the supply
of temporary and affordable housing, improve supply and quality of social housing, and remove
regulatory barriers to the development of more residential housing. Government established a
Christchurch Housing Accord Fund to progress three housing developments at Awatea, Welles Street,
and Colombo Street totalling around 420 houses that will be completed by 2017. All the developments
require a proportion of houses to be affordably priced. The first houses at the Awatea development
were opened in March 2016, where 40 per cent of almost 240 dwellings will be priced under $415,000
(in 2014 dollars) and ten houses will involve shared equity ownership with the New Zealand Housing
Foundation.
MSD contracts VisionWest and Comcare to provide short-term housing for families and single
households in Christchurch. At the end of June 2016, 9 families and 12 single households were
housed. Six families and 45 single households were awaiting assistance. Providers report that the
average stay is less than 8 weeks and that the households exit to social or private rental housing.
In July 2015 CCC provided funding for one year to the Christchurch Methodist Mission to provide
transitional housing for six homeless households.
The City Mission, CCC, and MBIE provided funding for the Christchurch City Mission to refurbish
a shelter to provide transitional housing for up to three homeless families, which opened in
December 2015. To date six families have been housed, all of them moving on to more permanent
accommodation.
In July 2015 the Supported Accommodation for Youth initiative commenced in Christchurch. MSD
contracts Presbyterian Support to assist up to eight young people at a time, providing both housing
and mentoring.

               Canterbury Wellbeing Index 2016 | Housing affordability and availability | 4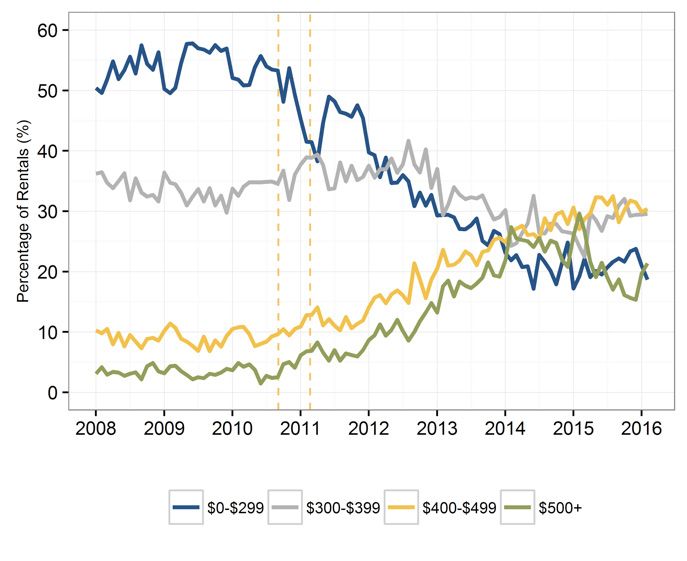
In 2015, MSD completed the Emergency Housing Funding Review as part of the Social Housing
Reform Programme, which led to the recommendation of a new Emergency Housing Funding Model.
As part of Budget 2016, the Government committed $41.1 million over four years towards a new
Emergency Housing Funding Model, which has two main parts:
•	Contracts with selected emergency housing providers to provide around 3,000 emergency
   housing places a year (approximately 800 places at any one time) for individuals and families
   across New Zealand, with a significant proportion of these being in Auckland. This will ensure the
   availability of places and give providers greater certainty of income.
•	A new, non-recoverable emergency housing Special Needs Grants for individuals and families
   unable to get into one of the contracted places to cover the cost of emergency housing, generally
   for up to seven days. This grant has been available from 1 July 2016.
The Request for Proposal (RFP) for contracted emergency housing places opened on 1 June 2016,
and funding was made available for 14 existing providers from 1 July 2016. Contracts for places are
currently being negotiated.
In July 2016, the Christchurch Methodist Central Mission purchased five Canterbury Earthquake
Temporary Accommodation houses from Kaiapoi village. These homes have been reinstated on their
Tilford Street, Linwood site and once ready, will be used to accommodate people from the social
housing waitlist.

Regulations to encourage an increase in the housing supply
Land has been freed up to enable rapid rebuilding, with thousands of sections rezoned since the
earthquakes. Between September 2010 and March 2015 consents were issued for more than
$2.7 billion of earthquake-related building in Canterbury, including consents for 3,188 new dwellings.17
Regulatory changes have been made to District Plans to streamline the design and consenting
process. In November 2012 the Minister for Canterbury Earthquake Recovery directed Environment
Canterbury to prepare a Land Use Recovery Plan (LURP) for greater Christchurch with support from
Christchurch City Council, Selwyn and Waimakariri District Councils, Te Rūnanga o Ngāi Tahu, New
Zealand Transport Agency and CERA.
The LURP responds to the impacts of the earthquakes on residential and business land use, and
provides a framework for rebuilding and future development. It puts land use policies and rules in
place to assist in the rebuilding and recovery of communities (including housing and businesses) that
have been disrupted by the earthquakes. The LURP took effect on 6 December 2013.18
By April 2016, thirty of the actions in the LURP were completed, eleven further actions must be
completed before the Christchurch Replacement District Plan process is completed. There are nine
actions which are ongoing, including Action 10: Investigation of housing models. This action directs
central government and district councils to investigate mechanisms to encourage the provision and
retention of affordable housing in proposed new residential developments.
The LURP identified greenfield land adjacent to existing urban areas for potentially 40,000 residential
sections. To date around 28,500 residential sections have been zoned, through plan changes, from
rural land to residential. Of these around 13,000 sections are subject to or have received subdivision
consent. The greatest areas of new housing have been in Selwyn and Waimakariri districts. Housing
affordability and intensification within urban areas remain issues despite the LURP enabling provision
for broader housing choices. However, social housing supply has been supported by the HNZC being
able to use rules introduced by the LURP to replace and build new housing stock. As at February
2015 the new rules had provided for the consenting of 164 HNZC houses.19
The Residential Chapter of the Christchurch Replacement District Plan places a focus on increasing
the supply of housing to enable a wide range of housing types, sizes and densities, meeting the
diverse needs of the community in the immediate recovery period and longer term (including social
housing options), and assisting in improving housing affordability.

               Canterbury Wellbeing Index 2016 | Housing affordability and availability | 5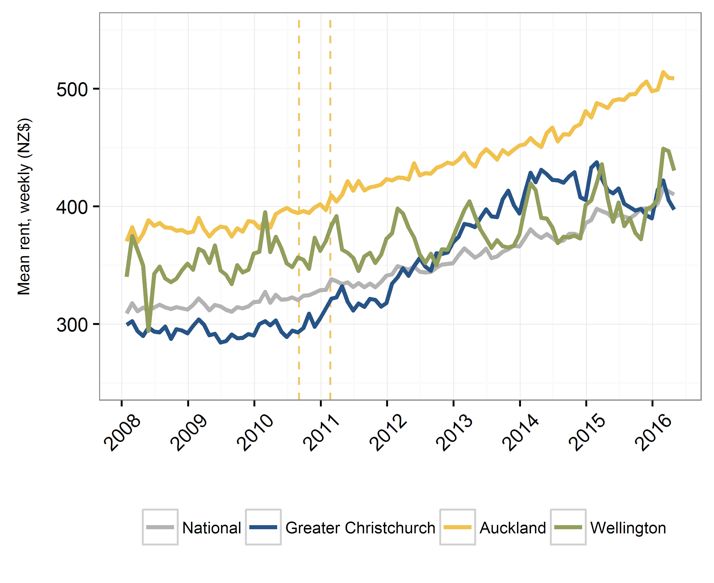
What are the indicators telling us?
The following indicators for housing are, where possible, broken down into the eight geographic
areas of Christchurch city shown in map 1 below, as well as Selwyn and Waimakariri districts, which
together form the greater Christchurch area. Please refer to Map 1 when reading this section.

Map 1: Geographic areas of Christchurch city

Houses and sections
Trends in affordability and availability within the house and section market are being measured using
the following indicators:
•	Mean sale price for houses as an indicator of affordability, which can also reflect changes in
   availability
•	Number of houses and number of sections sold each month in greater Christchurch as indicators
   of changes in demand and supply.
Figure 1 shows that monthly mean house sale prices remained largely stable before and immediately
after the earthquakes for most of greater Christchurch. However, pressures subsequently pushed
up prices throughout greater Christchurch. House sale prices have stabilised in greater Christchurch
since 2014, in contrast to house price appreciation for the rest of New Zealand since that time.

              Canterbury Wellbeing Index 2016 | Housing affordability and availability | 6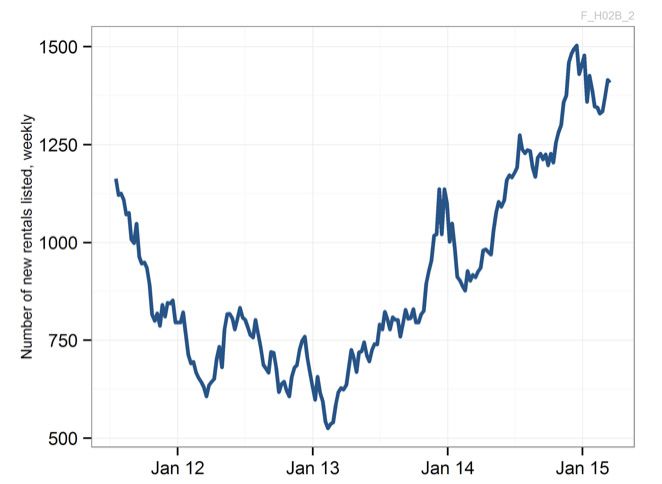
Figure 1: Mean house sale price for area and New Zealand

Taking a longer view, Table 1 shows that greater Christchurch experienced substantial increases
in mean house sale prices between 2010 and 2015. Prices rose most notably in the Inner North
(51 per cent), North West (47 per cent), Inner North (51 per cent), and South West (46 per cent) of the
city. There were smaller overall increases over this time period across the North East (19 per cent),
the East (15 per cent), and the South (6 per cent). Selwyn (46 per cent) and Waimakariri districts
(28 per cent) also experienced overall price increases over this time period.
Table 1 also shows that between March 2015 and March 2016, mean house sales prices dropped
across most areas of greater Christchurch (ranging from a 3 per cent drop in the South, East of
Christchurch and for the Selwyn District, to a 16 per cent drop in the North East of Christchurch). In
areas that saw increases in mean house prices, growth slowed substantially.

               Canterbury Wellbeing Index 2016 | Housing affordability and availability | 7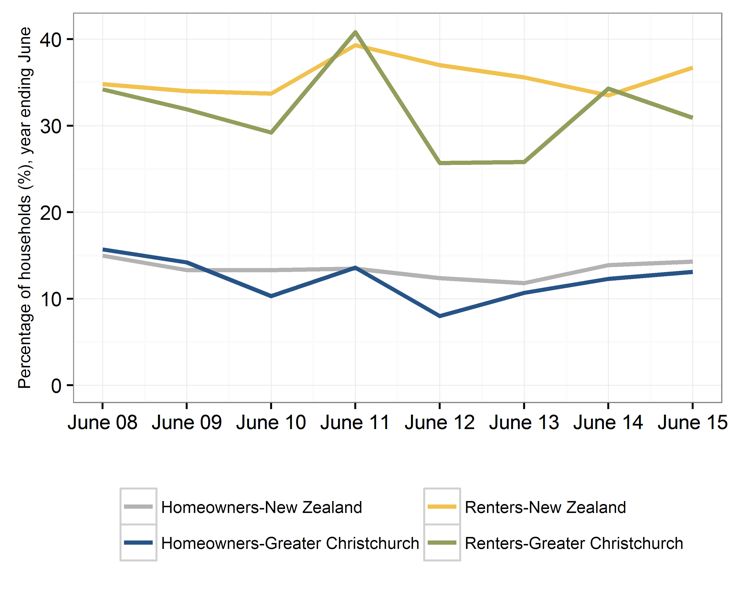
Table 1: Change in mean house prices from September 2010 to March 2016

                                                          % change                         % change
 Area               September 2010        March 2015                       March 2016
                                                         2010-2015                        2015-2016
 South                    $506,773           $535,260              6         $521,542                -3
 East                     $280,028           $322,562            15          $312,280                -3
 North East               $370,656           $440,295            19          $371,573            -16
 North West               $382,579           $562,557            47          $535,926                -5
 South West               $328,295           $479.200            46          $506,768                6
 Inner North              $501,644           $755,435            51          $774,345                3
 Central City*            $296,813           $367,470            24*         $579,538            58*
 Inner South              $289,759           $391,596            35          $420,688                7
 Christchurch
                          $382,105           $509,564            33          $490,905                -4
 city (total)
 Selwyn District          $396,424           $578,609            46          $562,803                -3
 Waimakariri
                          $372,740           $478,499            28          $473,915                -1
 District
 National                 $417,185           $589,608            41          $535,498                -9

* Low sample size means this area is measured with significant measurement error.

Figure 2 shows the number of houses sold monthly in each area of greater Christchurch through
December 2015. The number of monthly house sales in Waimakariri District increased considerably
after the February 2011 earthquake, peaking at 180 sales in September 2011. House sales also grew
in Selwyn District, reaching a peak of 147 in March 2014.
Sales in Waimakariri increased substantially from 666 in 2010 to 1,248 in 2012. Sales slowed in 2013
and 2014 and dropped back to 1,041 in 2015.
Sales in Selwyn also increased substantially from 504 in 2010 to 1,128 in 2012. Sales continued to
grow to 1,197 in 2013 and 2,256 in 2014, before decreasing to 1,287 in 2015.
In comparison, sales in Christchurch city declined from 6,114 in 2010 to 5,283 in 2011 (down
16 per cent). Sales then increased to 7,176 in 2012 and continued to grow to 7,683 in 2014 and
8,271 in 2015.
Across the geographic areas within greater Christchurch, a pattern emerged of a market that had
declining sales in the pre-earthquake period followed by a growth in sales in 2012. This pattern was
particularly noticeable in the North West and South West of the city and Waimakariri District. The
South, East, and North East have recorded gradual increases over the years since 2011, but remain
below the pre-earthquake levels. However, the rate of increase appears to have levelled off in a
number of areas since 2012 (Figure 2).
When viewed together, Figures 1 and 2 indicate that while house sales increased in 2011, there was
sufficient supply in most areas. However, high demand in North West, Inner North, and Inner South
of Christchurch increased mean prices markedly in those areas between 2010 and 2014. Despite
a more subdued market in the South and a decrease in the Central City (partly due to low sales),
overall mean house prices in greater Christchurch increased at a faster rate than those across
New Zealand until 2014.20

                 Canterbury Wellbeing Index 2016 | Housing affordability and availability | 8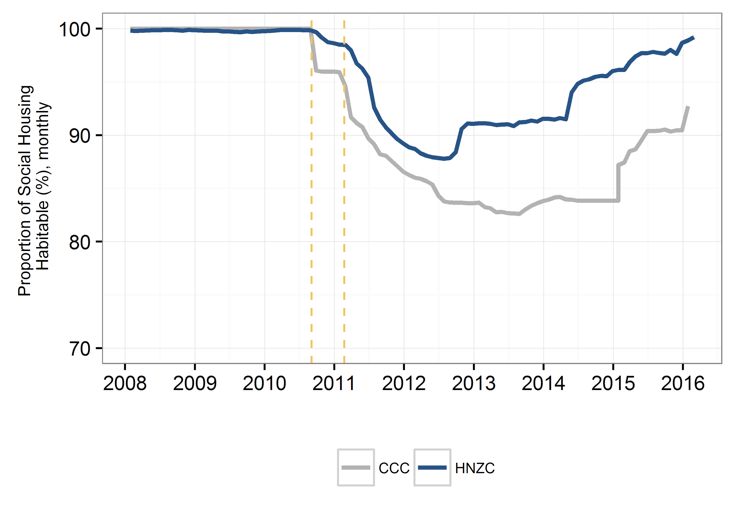
Figure 2: Number of houses sold
Between 2011 and 2012 the number of sections sold in Christchurch city increased by 65 per cent
(from 421 to 694). Sales rose another 42 per cent to 986 sections in 2013 before dropping to 800 in
2014. No comparable section sales data are available beyond 2014.
Rental market
Mean weekly
rent for new The affordability and availability of rental housing are measured using the following indicators:
tenancies increased • Mean (average) weekly rent for new tenancies each month, as an indicator of changes in
substantially affordability
throughout greater
Christchurch • The total number of bonds lodged for rental properties in Christchurch that cost under $300 per
following the week, as an indicator of affordability and the availability of low-cost rental properties
earthquakes but • The number of new rentals listed with Trade Me in Christchurch city each week, as an indicator of
this plateaued from availability.
mid-2014, around
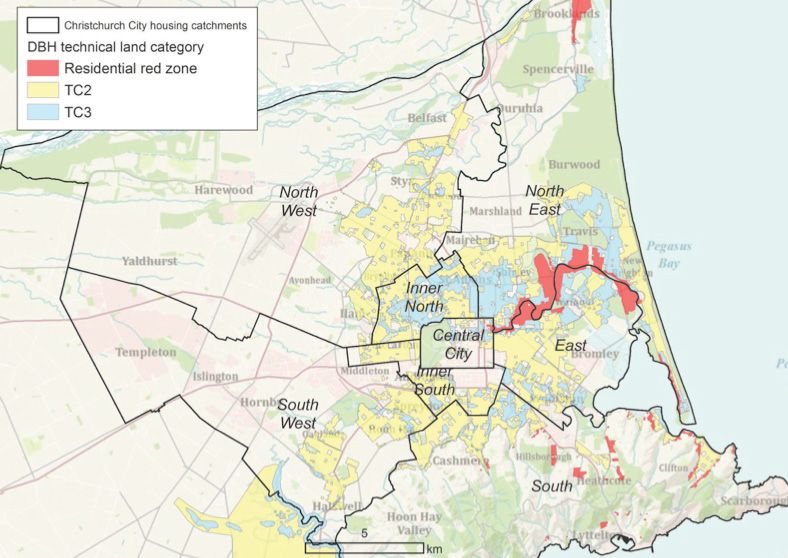
the time that almost Figure 3 shows that mean weekly rent for new tenancies increased substantially throughout greater
80 percent of under- Christchurch following the earthquakes but this plateaued from mid-2014, around the time that almost
cap repairs had been 80 percent of under-cap repairs had been completed, and has been decreasing since 2015.
completed, and has
been decreasing
since 2015.
Canterbury Wellbeing Index 2016 | Housing affordability and availability | 9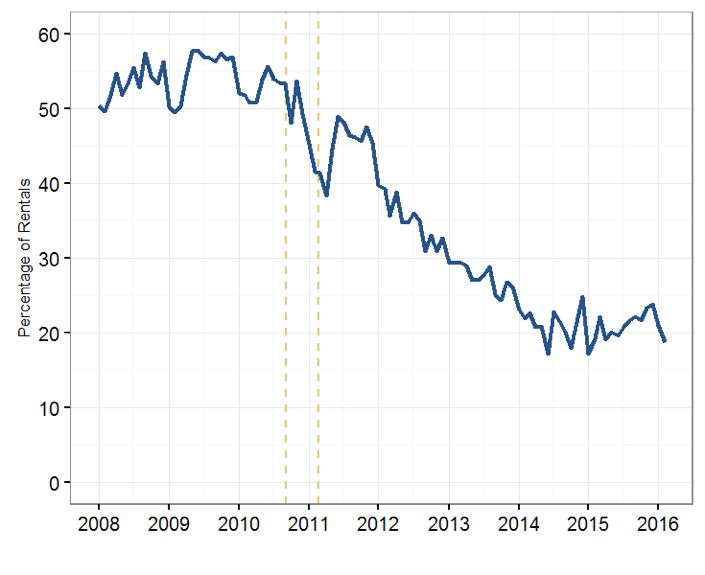
Figure 3: Mean weekly rent

Table 2 shows the change in mean weekly rent for Christchurch city increased by 37 per cent
between September 2010 and March 2015, which equates to rents being $126 higher per week.
Mean weekly rent increased across homes of all sizes between 2010 and 2015, but especially for
houses with more bedrooms. Demand for larger houses and increasing rents may have been driven
by the growing need for accommodation for incoming workers and the large number of household
being displaced due to the residential repairs (as shown in Figure 11).
Weekly rent decreased between March 2015 and March 2016 for all areas except for the South West.
The largest decreases were in the South and Inner North of Christchurch city, and in the Waimakariri
District. This decrease coincides with and may have been influenced by the steady decrease in the
estimated number of households displaced due to residential repairs and rebuilds, shown in Figure 11
later in this section, as EQC claims are settled.

.

             Canterbury Wellbeing Index 2016 | Housing affordability and availability | 10
Table 2: Mean weekly rent in September 2010, March 2015, and March 2016
September % change % change
Area March 2015 March 2016
2010 2010 to 2015 2015 to 2016
South $354 $489 23.0 $435 -10.9
East $263 $369 32.6 $348 -5.6
North East $304 $400 26.3 $384 -3.9
North West $310 $469 48.9 $462 -1.5
South West $294 $391 41.4 $416 6.3
Inner North $285 $442 41.3 $402 -9.1
Central City $281 $356 26.6 $355 -0.2
Inner South $265 $412 46.7 $389 -5.4
Christchurch
$294 $420 37.1 $403 -4.0
city (total)
Selwyn District $340 $476 39.8 $475 -0.1
Waimakariri
$311 $440 24.3 $386 -12.1
District
Greater
$394 $437 49.3 $422 -3.5
Christchurchb
Nationalc $320 $398 24.4 $416 4.4
Figure 4 shows that the proportion of bonds for low-cost rentals (less than $300 per week) lodged per
month within greater Christchurch remained relatively steady in the three years before the September
2010 earthquake (averaging 51-52 per cent of all bonds lodged). After the earthquakes there has
been a substantial decrease in the proportion of low-cost rentals to 17 per cent in January 2015,
before recovering slightly to 19 per cent in February 2016.
Figure 4: Percentage of rental bonds lodged monthly with weekly rent below $300
b
Monthly data from 28/8/2010, 28/2/2015, and 28/2/2016
c
Monthly data from 28/8/2010, 28/2/2015, and 28/2/2016
Canterbury Wellbeing Index 2016 | Housing affordability and availability | 11Figure 5 shows the percentage of rental bonds lodged by weekly rental price band.
In January 2010 84 per cent of rentals in greater Christchurch cost less than $400 per week
(50 per cent cost less than $300 per week and 34 per cent cost between $300-399).
By 2012, 73 per cent of rentals in greater Christchurch cost less than $400 per week and by January
2015 this had dropped to just 41 per cent of the market (16 per cent costing less than $300 and
25 per cent costing between $300-399).
During 2014, the proportion of rental bonds over $400 per week exceeded those under $300 for the
first time, a pattern which has continued despite slowing in 2015 and 2016.
Figure 5: Percentage of rental bonds lodged monthly by weekly rent level
Canterbury Wellbeing Index 2016 | Housing affordability and availability | 12Figure 6 shows that before the earthquakes greater Christchurch had mean weekly rent levels
Greater Christchurch below both the national rate and the other main centres. Between mid-2012 mean and early 2015,
rent levels have however, rent in greater Christchurch tracked above the national rate and eventually exceeded
largely decreased that of Wellington. After a period of consistent growth, greater Christchurch rent levels have largely
since early 2015 and decreased since early 2015 and were again below Wellington and the national level as at April 2016.
were again below
Wellington and the
Figure 6: Mean weekly rent for Auckland, Wellington, greater Christchurch and National
national level as at
April 2016.
Canterbury Wellbeing Index 2016 | Housing affordability and availability | 13Figure 7 shows that the number of rental listings on Trade Me for Christchurch fell between August
2011 and February 2013. In August 2011 there was a weekly average of 1,078 properties listed but
this fell to 536 by February 2013. Listings have subsequently shown a pattern of increase, recovering
to a weekly average of 1,398 in March 2015, which likely reflects the gradual inclusion of earthquake-
repaired housing in the rental market. These data are not available beyond March 2015.
Figure 7: Number of rental listings on Trade Me
Canterbury Wellbeing Index 2016 | Housing affordability and availability | 14Social housing
Social housing impacts are measured in two ways in this report:
• Habitability rates for CCC and HNZC social housing units
• Social housing waiting lists.
Following the earthquakes, a large number of social housing units were damaged and became
‘uninhabitable’, reducing the supply. Since April 2011, detailed engineering evaluations have found
structural problems in additional units and some have become uninhabitable.
Figure 8 shows that the percentage of habitable CCC and HNZC housing units decreased after
the September 2010 earthquake and continued to decrease as detailed engineering evaluations
progressed.
The proportion of habitable CCC housing units reached a low of 83 per cent in August 2013 and
levelled off at 84 per cent in 2014 before increasing to 93 percent in January 2016.
The proportion of habitable HNZC housing units followed a similar pattern and reached a low of
88 per cent habitability in July 2012. By October 2012 over 90 per cent of HNZC units were repaired
and became habitable and at February 2016 99 per cent were habitable.
The significant improvement in HNZC habitability occurred due to completion of HNZC’s planned
programme to repair 5,000 houses by December 2015.
Figure 8: Proportion of habitable HNZC and CCC housing units
From April 2014 the Ministry of Social Development has been responsible for managing applications
for social housing. Categories A and B are applicants with the most urgent housing needs.21
Figure 9 shows that while the social housing register for Christchurch city and the Waimakariri District
decreased over the first half of 2012, assisted by the repair of a number of units, it generally grew
from mid-2012 to a peak of 592 in June 2015, before dropping back to 425 in March 2016.
The CCC’s waiting list for its housing stock increased over 2012 and early 2013 but eased back from
late 2013 before peaking again at 358 in early 2015 and then settling back to 171 in February 2016.
Canterbury Wellbeing Index 2016 | Housing affordability and availability | 15Figure 9: CCC and HNZC/MSD (categories A and B only) waiting lists22
Canterbury Wellbeing Index 2016 | Housing affordability and availability | 16Temporary accommodation assistance
Most insurance policies cover Temporary Accommodation Claims (TAC) for a fixed period of time
(typically a year). After this, home owners who are still unable to return home can apply for Temporary
Accommodation Assistance (TAA) from the Canterbury Earthquake Temporary Accommodation
Service (CETAS).
Figure 10 shows the number of households displaced from their usual residence due to the repair or
rebuild of their earthquake-damaged home. The data is based on the number of completed repairs by
EQC, over-cap settlements by private insurance companies and estimates of how many households
have been displaced long-term due to their house becoming uninhabitable after the earthquakes. It
includes households who receive TAC paid by insurers or TAA from the Government and estimates
those that do not have any assistance.
Figure 10 shows that displaced residents peaked in December 2012, when 6,800 households
received payments for temporary accommodation (approximately 18,000 people). Latest estimates
indicate a decreasing need with over 95 per cent of EQC claims settled as at the first quarter of 2016.
Due to the complexity of some settlements, a small number of households are expected to continue
to require temporary accommodation into 2018.
The number of households receiving TAA increased every month during the first year that the
programme was established, peaking in September 2012 with 1,334 households registered for
assistance. This demand has subsequently decreased to 315 households in April 2016.
Figure 10: Estimated number of households who are displaced due to residential repair or rebuild
Canterbury Wellbeing Index 2016 | Housing affordability and availability | 17Housing costs relative to income
Housing affordability is usually defined as housing that is of reasonable quality and does not cost so
much that households cannot afford other basic needs (i.e. no more than 30 per cent of household
gross income).
Figure 11 indicates that the proportion of those in greater Christchurch spending more than
30 per cent of their household income on housing decreased from 34 per cent of renters in the year
ending June 2008 to 25 per cent in 2013 (after a peak of more than 40 per cent in 2011). In 2014 this
proportion increased back to 34 per cent, in line with the national rate, before decreasing to
31 per cent in greater Christchurch while the national rate increased to 37 per cent.
Over the same time, the percentage of home owners who spend more than 30 per cent of their
household income on housing decreased from 16 per cent in 2008 to 11 per cent in the year ending
June 2013. This proportion increased slightly to 12 per cent by June 2014 but remained slightly below
the national rate of 14 per cent, and this continued in 2015.
These findings relate to a small sample and should be treated with caution.
Figure 11: Percentage of households who spend more than 30 per cent of their household income
on housing
Canterbury Wellbeing Index 2016 | Housing affordability and availability | 18Find out more
Find out more about the Canterbury Wellbeing Index:
www.cph.co.nz/your-health/canterbury-wellbeing-index/
Find out more about the Land Use Recovery Plan: www.developingchoices.org.nz
Find out more about changes to social housing provision: www.msd.govt.nz and www.hnzc.co.nz
Find out more about a new client-focused social housing website: www.housing.msd.govt.nz
Find out more about the Canterbury Earthquake Temporary Accommodation Service, including
temporary villages and Temporary Accommodation Assistance: www.quakeaccommodation.govt.nz
Find out more about Housing New Zealand’s Earthquake Recovery Programme:
www.hnzc.co.nz/news/latest-news/housing-new-zealands-post-quake-mission-accomplished/
Find out more about the Earthquake Commission: www.eqc.govt.nz
Find out more about the Insurance Council of New Zealand: www.icnz.org.nz
Technical notes
Canterbury Wellbeing Survey (formerly the CERA Wellbeing Survey)
Data source: Canterbury Earthquake Recovery Authority,
Canterbury District Health Board
Data frequency: Six-monthly September 2012, April 2013, September 2013, April 2014,
September 2014, April 2015, September 2015 (all CERA) and April 2016
(CDHB)
Data complete until: April 2016
Notes: The April 2016 Canterbury Wellbeing Survey (formerly the CERA Wellbeing Survey) is
the eighth survey in the series providing information about the residents of greater Christchurch.
Respondents were randomly selected from the electoral roll. The survey was delivered online and by
hard copy from 30 March to 18 May 2016. The response rate was 41 per cent. Weighting was used
to correct imbalances in sample representation. The survey was originally developed in partnership
with Christchurch City Council, Waimakariri District Council, Selwyn District Council, the Canterbury
District Health Board, Ngāi Tahu and the Natural Hazards Research Platform. For results from the
surveys, see: www.cph.co.nz/your-health/wellbeing-survey/
House and section sales
Data source: Quotable Value (QV) Residential Property Monthly Price Movement
Dataset
Data frequency: Monthly
Data complete until: December 2015 (house sales) and March 2014 (section sales)
Notes: Houses include all properties with a land use description defined by QV as ‘bach’, ‘multi-unit’,
‘multi-use within lifestyle’, ‘multi-use within residential’, ‘residential’, ‘single unit – lifestyle’, ‘single unit
excluding bach’.
The method of extraction for those properties classified as “residential” has been revised from
previous versions of the Canterbury Wellbeing Index. General trends remain similar, but the new filter
method is considered a better reflection of residential sales.
Data for section sales is not available post March 2014.
Median house sale prices and weekly rents are not monitored as sale prices and rent values tend to
cluster at specific dollar amounts. This is a problem because, unlike an average, a median has to be
an actual number taken from the data. This means that median values can have larger variation over
time, instead of moving smoothly. For example, there can be long periods when there is no or little
change, followed by sharp jumps up or down.
Canterbury Wellbeing Index 2016 | Housing affordability and availability | 19Rental market
Data source: Tenancy Bonds database, MBIE
Data frequency: Monthly
Data complete until: April 2016
Notes: Seasonality may exist in the rental and housing market. Rentals may be especially affected by
the university term. Data are for new tenancy bonds registered per month.
Data source: Trade Me data, CETAS
Data frequency: Weekly
Data complete until: 16 March 2015
Notes: Seasonality may exist in the rental and housing market. Rentals may be especially affected by
the university terms.
Includes all listings not listed as ‘section’.
Trade Me data refer to all rental listings within Christchurch city, which makes up approximately 90
per cent of greater Christchurch’s rental market.
Data no longer available post March 2015.
Social housing capacity and waiting lists
Data source: Christchurch City Council and Housing New Zealand
Data frequency: Monthly (MSD waitlist data – quarterly)
Data complete until:
February 2016 (HNZC and CCC – habitable housing) and March 2016
(HNZC/MSD and CCC – waitlist)
Notes: Occupancy rates are calculated by dividing total habitable units by total occupied/let units.
Housing New Zealand habitability rate = (number of let properties at month end + number of vacant
properties at month end) / Total properties.
Social housing criteria: http://housing.msd.govt.nz/housing-options/social-housing/index.html
Housing New Zealand data are for waitlist categories A and B only.
CCC habitability rate = (Total Vacancies at month end + Total Occupied at month end) / Total housing
units.
Waiting list eligibility criteria: http://resources.ccc.govt.nz/files/CityHousingApplicationForm-docs.pdf
On 14 April 2014, the social housing assessment and waitlist was transferred from HNZC to MSD.
MSD publish the social housing waitlist each quarter.
Temporary accommodation
Data source: Canterbury Earthquake Temporary Accommodation Service (CETAS)
administrative records
Data frequency: Monthly
Data complete until: April 2016
Notes: CETAS data shown represent current claims/assistance on one day each month and
therefore should not be interpreted as an exact representation of the current claim levels over the
entire month. Figures displayed are those current, not the total who have applied. CETAS Temporary
Accommodation Assistance started on 21 February 2011, was stopped on 22 February 2011 due to
the earthquake, and became operational again in April 2011.
Data relate to households with current accommodation assistance/claims rather than individuals.
Canterbury Wellbeing Index 2016 | Housing affordability and availability | 20Housing costs relative to income
Data source: Household Economic Survey (HES) and Household Economic Survey
(Income), Statistics NZ
Data frequency: Years ending June 2008–2014
Data complete until: June 2015
Notes: The HES is conducted every three years, and collects information on household expenditure
and income, as well as a wide range of demographic information. A shorter version of the survey, HES
(Income), is collected in the two years between the full HES.
Differences between HES and HES (Income) mean that caution should be used when comparing
results over time.
Greater Christchurch is the aggregation of Christchurch city, Waimakariri District and Selwyn District
Councils and is below survey design level. Data are indicative only and should be interpreted
cautiously.
Households that are ‘Not owned’ cover dwellings where the household does not own the dwelling,
and either pays rent or lives there rent-free. ‘Owned’ households cover dwellings that are held (or not
held) in a family trust, regardless of whether mortgage payments are made or not made for
the dwelling.
Household income is from total regular and recurring income sources, and is gross (before tax)
income.
Housing costs include mortgage principal repayments, mortgage interest payments, mortgage
application fees, rent payments, other payments associated with renting (e.g., bonds paid in the last
12 months), property rates payments (both regional and local government), and payments associated
with building-related insurance.
The percentage spent on housing is calculated by dividing household income by housing costs.
Note that households with higher income can afford to pay more than 30 per cent of their income on
housing costs and may choose to do so without reducing their ability to afford other basic needs.
Canterbury Wellbeing Index 2016 | Housing affordability and availability | 21References
1. Ministry of Social Development. (2016). The Social Report 2016. Retrieved from:
socialreport.msd.govt.nz/economic-standard-of-living/housing-affordability.html
United States Department of Housing and Urban Development. (2012). Affordable housing.
Retrieved from: www.hud.gov/offices/cpd/affordablehousing
2. Affordable Housing National Research Consortium. (2001). Affordable housing in Australia:
pressing need, effective solution. Canberra: AHNRC.
3. Howden-Chapman, P. (2008). Effects of improved home heating on asthma in community
dwelling children: randomised controlled trial. British Medical Journal 337:a1411.
Howden-Chapman, P. (2007). Effect of insulating existing homes on health inequalities. British
Medical Journal 10.1136/BMJ.39070.573032.80.
4. Mitchell, I. and O’Malley, S. (2004). How affordable is housing in New Zealand and what
strategies are available to reduce housing stress? Paper presented to Social Policy, Research
and Evaluation Conference, 25–26 November.
5. Personal communication, M. Harding-Shaw (Ministry of Business Innovation and Employment)
6. Housing New Zealand Corporation earthquake recovery programme. Retrieved from:
www.hnzc.co.nz/news/latest-news/housing-new-zealands-post-quake-mission-accomplished/
7. Zhang, Y. and Peacock, W.G. (2010). Planning for housing recovery? Journal of the American
Planning Association 76(1): 5–24.
8. Levine, J.N., Esnard, A.-M. and Sapat, A. (2007). Population displacement and housing dilemmas
due to catastrophic disasters. Journal of Planning Literature 22(1): 3–15.
9. Hirayama, Y. (2000). Collapse and reconstruction: housing recovery policy in Kobe after the
Hanshin Great Earthquake. Housing Studies 15(1): 111–28.
10. Bolin, R. and Stanford, L. (1991). Shelter, housing and recovery: a comparison of US disasters.
Disasters 15(1): 24–34.
11. Comerio, M.C. (1997). Housing issues after disasters. Journal of Contingencies and Crisis
Management 5(3): 166–78.
12. MBIE, unpublished data.
13. Te Whare Roimata analysis of red stickered housing, inner city east zone (May 2011 and March
2012), cited in Canterbury Anglican Diocese Social and Environmental Issues Unit. (2012). Inner
city east recovery: Low income/social housing.
14. UK Department of Health. (2009). NHS emergency planning guidance: planning for the
psychosocial and mental health care of people affected by major incidents and disasters: Interim
national strategic guidance. London: Department of Health.
15. Lock, S., Rubin, G.L., Murray, V., et al. (2012). Secondary stressors and extreme events and
disasters: a systematic review of primary research from 2010-2011. PLoS Current. doi: 10.1371/
currents.dis.a9b76fed1b2dd5c5bfcfc13c87a2f24f
16. Ministry of Business, Innovation and Employment. (2013). Housing pressures in Christchurch:
a summary of the evidence. Ministry of Business, Innovation and Employment. Retrieved from:
www.mbie.govt.nz/publications-research/research/housing-and-property/christchurch-housing-
report.pdf
17. Building consents issued (Statistics New Zealand) March 2016. Retrieved from: www.stats.govt.
nz/browse_for_stats/industry_sectors/Construction/BuildingConsentsIssued_HOTPMar16.aspx
18. http://www.developingchoices.org.nz/
19. Land Use Recovery Monitoring report December 2014. Retrieved from:
www.ecan.govt.nz/publications/Plans/lurp-monitoring-report.pdf
20. Ministry of Business, Innovation and Employment (2013, August). Key Canterbury indicators.
Ministry of Business, Innovation and Employment.
Canterbury Wellbeing Index 2016 | Housing affordability and availability | 2221. Ministry of Business, Innovation and Employment. (2013). Housing pressures in Christchurch: a
summary of the evidence. Ministry of Business, Innovation and Employment.
22. Note that CCC data are missing for 2011 due to internal disruptions as staff were displaced
from their offices. Missing data from 2012 are due to staffing issues. Data trends between these
periods should be viewed with caution and are represented in the graph by a dotted line.
Canterbury Wellbeing Index 2016 | Housing affordability and availability | 23You can also read