Results and Outlook February 2021 - Total.com

Page created by Andrea Day
 
CONTINUE READING
Results and Outlook February 2021 - Total.com
Results and Outlook
February 2021
Results and Outlook February 2021 - Total.com
TotalEnergies : More energy, Less emissions
Results and Outlook February 2021 - Total.com
Safety, Total’s core value
Cornerstone of operational efficiency & sustainability                           Protecting our
                                                                             employees and partners
Total Recordable Injury Rate for Total and peers*
Per million man-hours
                                                                                 65 M masks delivered
                                                                                    to 110 countries
1.5

                                                                                 7 M gloves delivered
                                                                                    to 50 countries
                                                                        1.
                                                                        05
1.0
                                                                                  Hydroalcoholic gel
                                                                                produced in 6 countries

                                                                 0.74
                                                                                   COVID impact on
                                                                                 million hours worked:
                                                                        0.       only 8% less than 2019
0.5                                                                     73
   2015             2016             2017   2018   2019   2020

                                  One fatality in 2020                       Continuity of operations

* Peers: BP, Chevron, ExxonMobil, Shell

                                                                                       2020 Results and Outlook   |   3
Results and Outlook February 2021 - Total.com
Transforming Total into a broad energy company : TotalEnergies

           Gases
           • Grow LNG (#2 player) and develop renewable gas (biogas / clean H 2)
           • Promote natural gas for power and mobility

           Renewables & Electricity
           • Accelerate investments in low carbon electricity primarily from renewables
           • Integrate along the electricity chain (production, storage, trading, supply)

           Liquids
           • Focus investments on low cost oil and renewable fuels (biofuels, SAF…)
           • Adapt refining capacity and sales to demand in Europe

           Carbon Sinks
           • Invest in carbon sinks (NBS and CCUS)

                  Total will become TotalEnergies
             creating long-term value for shareholders

                                                                             2020 Results and Outlook   |   4
Results and Outlook February 2021 - Total.com
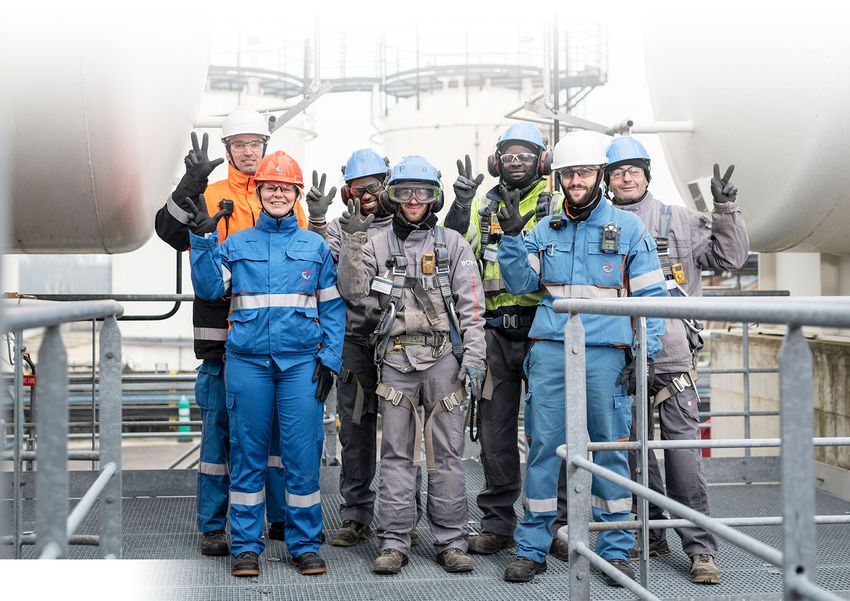
Growing energy production

          Mboe/d                                                  PJ/d

            4
                                                           ~120
                                             Electrons     TWh
                                         Renewable gas             20

            3

                                                   Gas

            2
                                                                   10
                                         Renewable fuels

            1
                                                    Oil

                   2019                                    2030

           LNG and Electricity driving Profitable Growth

                                                                         2020 Results and Outlook   |   5
Results and Outlook February 2021 - Total.com
Growing sales while adapting to demand

Energy sold to our customers
PJ

             12,000                                              % in sales

                                                Electrons            15%
                                                Renewable gas
                      5%

                                                                     50%
                  40%                           Natural Gas

                                                Renewable fuels

                  55%
                                                                     35%
                                                Oil products

                           2019          2030

                                                     2020 Results and Outlook   |   6
Results and Outlook February 2021 - Total.com
Reducing emissions while growing
Commitments to reduce Scope 3 emissions of our customers, in absolute value

Scope 3 emissions*
MtCO2e

                                400

                                          Other
                                         regions

                                                                          Europe
                                                        Covid
                                200                     impact             -30%
                                        Europe

                                          2015                     2020              2030

                            Europe: -30% by 2030 on the way to Net Zero by 2050
                                                   Worldwide: 2030 lower than 2015
* From energy products used by our customers (GHG Protocol Category 11)

                                                                                            2020 Results and Outlook   |   7
Results and Outlook February 2021 - Total.com
New commitment on Scope 1 & 2: - 40% 2030 vs 2015 while growing

Scope 1 & 2 emissions from operated oil and gas facilities
MtCO2e
                        46                                     Net*
                                                             emissions

                               36
                                                              -40%
                                                 < 40         vs 2015
         40
                                       Covid
                                      impact Acquisitions
                                         3   & start-ups      25-30
                                               since 2015

          0
                        2015   2020              2025          2030           2050

               On the way to Net Zero across Total’s worldwide operations by 2050

* Net of carbon sinks

                                                                         2020 Results and Outlook   |   8
Results and Outlook February 2021 - Total.com
Getting to Net Zero

   Total shares the ambition to get to Net Zero by 2050
       together with society for its global business
                     (Scope 1+2+3)

                                                            2020*
3 major steps to get Total to Net Zero                     vs 2015

              Net Zero on Operations by 2050 or sooner
    1                                                      -15%
              (Scope 1+2)

    2         Net Zero in Europe by 2050 or sooner
                                                           -12%
              (Scope 1+2+3)

              60% or more Net Carbon Intensity reduction
    3                                                       -8%
              by 2050 (Scope 1+2+3)

* Excluding Covid impact

                                                                     2020 Results and Outlook   |   9
Results and Outlook February 2021 - Total.com
Sustainability at the heart of Total’s transformation
                                                                                           CDP
                                                                                          A-
                                                                                Best score ex aequo in
                                                                                      O&G sector
   ENVIRONMENT                 SOCIAL                  GOVERNANCE

                                                                                          MSCI
                                                                                           A
                                                                                Best score ex aequo in
                                                                                      O&G sector

                                                                                         ISS ESG
                                                                                          B-
                                                                              Only major with Prime status
Climate ambition to    Responsible employer:        Environmental and                 since 2006
Net Zero               no lay-offs despite crisis   social challenges
                                                    integrated in all Board
Biodiversity new                                                                    Sustainalytics
                                                    decisions
commitments            2025 new diversity                                        ESG rating risks: 27.1
                       ambition 30% women           CEO compensation:           Best O&G major score
Advocacy consistent
                       in all management            • reduced during crisis
with our climate
                       bodies                       • linked to ESG factors
ambition
                                                    (25% of variable part
                                                    and LTI)                  Bloomberg intelligence
                                                                                Carbon transition score:
                                                                                        9.33/10
          Transparency through additional ESG reporting                            Best O&G score
                     TCFD, SASB, WEF, WDI

                                                                                 2020 Results and Outlook   |   10
Embedding climate ambition into financing policy

                       Sustainability Linked Bonds:
                    the “new normal” at TotalEnergies

        • All new bond issues to be Climate KPI-linked
        • Favoring long maturities
        • Measurable KPIs
             Scope 1+2 oil & gas operated emissions
             Scope 3 absolute emissions and/or carbon intensity objectives
        • Verified by external auditors

                                                                       2020 Results and Outlook   |   11
Market environment
2020 Energy demand reveals contrasted dynamics by energy

World GDP and demand evolution
2020 vs. 2019 (%)

                                      ~-4%                   ~-5%      ~-9%   ~+3%      ~+13%

                                       World
                                       GDP                   Energy     Oil

                                                                              LNG    Electricity from
                                                                                      Wind + Solar

                    LNG and Renewables: key contributors to the energy transition

Sources: IMF, WEO 2020 (IEA), Rystad Energy, BNEF and Total analysis

                                                                                                        2020 Results and Outlook   |   13
Oil: risk of medium-term supply crunch

Oil supply-demand outlook to 2025
Mb/d
                                                                      > 10 Mb/d
                                                                        unidentified

                                                                                                                2020 highlights
           OPEC+
           quotas
100
                                                                                                          • Effectiveness of OPEC+ in
                                                                                                            managing unpredictable
                                                            ?                            2020
                                                                                        Demand              short-term oil demand
                                          Post-FID
                                                       Shale supply
                           ~5%/y    Conventional        net growth                                        • Uncertainty on US shale
                       Conventional   start-ups
                        oil decline                                                                         dynamics
                                                                                                          • Underinvestment in
                                                                                                            conventional oil
                                                                                                          • Resilient Asian demand
 50
           2020                                                                          2025
          Supply*                                                                      Expected
                                                                                       demand

         More investments on new projects required
  Source: IEA, Rystad Energy, Wood Mackenzie, Oxford Economics, Lambert Energy Advisory, Total analysis
* Including biofuels and refinery processing gains

                                                                                                                     2020 Results and Outlook   |   14
Gas: growing LNG demand despite economic downturn

LNG demand                                                                   2020 highlights
Mt

                                                          +3%
                                                                       Demand
                                          +12%                         • LNG demand (+3%)
                                                                         outpacing gas (-2%)
                       350
                                                                         in Covid crisis
                                                                       • Demand elasticity
                                                                       • Asian energy policies
                                                                         favoring LNG

                                                                       Supply
                                                                       • Only 2 LNG project FIDs
                       200                                               (NLNG T7, ECA)
                                   2018            2019         2020

                    China                         +12%          +11%
                                                                       • LNG supply chain more in
                                                                         tension than expected
                     India                         +4%          +15%

Source: Rystad Energy, IHS Waterborne, Total analysis

                                                                                  2020 Results and Outlook   |   15
2020: Resilient in the storm
Investing for growth – maintaining dividend – controlling gearing

2020 cash flow allocation                              Net-debt-to-capital
B$                                                     %, Total vs. peers*, excluding leases

                                                                   10                        20                         30
                                    Working
                                    capital
           Debt     5.6

                                    Capital
                            13.0
                                    investment

          CFFO     15.7

                                    Return to
                            7.2
                                    shareholder

                  Sources   Uses

                                   Discipline in cash flow allocation

                                                       * Estimated for peers (BP, Chevron, Exxon, Shell)

                                                                                                           2020 Results and Outlook   |   17
Delivered action plan to weather the storm

                                           May 2020
                                          Action plan   Realized

               Reduce                      < 14 B$
                                                         13 B$
               Capital investment          vs 18 B$
   Capital
                                                                   Ability to flex Capex
 investments
               Maintain
                                             2 B$         2 B$
               Renewables & Electricity

   Opex                                      1 B$
               Cost savings vs. 2019                     1.1 B$        Cost culture
  Savings                                  vs 0.3 B$

        Low-breakeven high-quality portfolio at the heart of the resilience

                         Pre-dividend organic breakeven ~26 $/b

                                                                           2020 Results and Outlook   |   18
Discipline on costs
While preserving workforce competencies

Opex savings vs. 2019                                    Production costs*
B$                                                       $/boe

                                                1.6 B$

                                      +0.5 B$            15

                           1.1 B$                                                           Exxon
                1.0 B$
                                                                9.9                         Chevron
                                                         10
                                                                                            Shell

      0.3 B$
                                                                                            BP
                                                                                      5.4        5.1
                                                          5

        2020      2020    2020                  2021           2014                              2020   2021
       initial  revised Realization
     objective objective

               Accelerating                                              Best in class
          new sustainable savings                                     targeting 5 $/boe
                                                         * ASC 932

                                                                                 2020 Results and Outlook   |   19
2021: prudent capital planning in uncertain environment
Flexibility to mobilize short cycle capex

Capital investment*                                                      Capex savings 2020
B$                                                                       vs original budget of ~18 B$
                                                                         B$
                                   17.4
                                                                                                   ~5 B$

                                                   13.0
                                                                  12          Net acquisitions

                                                                                 Downstream

                                                                                   Upstream
                                                                                     projects
                                                                                rescheduling

                                                                                     Flexibility
                                                                                 on Upstream
                                                                                  short cycle

                                   2019            2020           2021
Brent ($/b)                         64              42            40

                         Renewables & Electricity > 20%

* Capital investment = Organic Capex + acquisitions – disposals

                                                                                              2020 Results and Outlook   |   20
Maintaining dividend through the cycle

Quarterly dividends since start of oil crisis                     2020 TSR*
                                                                  %

  100%                                                  Chevron
                                                        Exxon

                                                                                                  BP

                                                                                                  Chevron

                                                                                                  Exxon
   50%                                                  BP

                                                                                                  Shell
                                                        Shell
                                                                        -40%       -20%

          Q1’20          Q2’20          Q3’20   Q4’20

                            Building long-term trust with shareholders

                                                                  * Source: Bloomberg

                                                                                    2020 Results and Outlook   |   21
Positive benchmark vs peers

2020 adjusted net income*                                                 2020 CFFO**
B$                                                                        B$

   5
                                                                            15

2019-20 impairments*                                                      2020 ROE*
B$                                                                        %

 10

  Peer group: BP, Chevron, Exxon, Shell
* Estimated for peers, and for BP, excluding 7.6 B$ recurring write-off   ** Excl. working capital variation

                                                                                                               2020 Results and Outlook   |   22
Transforming while keeping focus on
HSE, delivery, cost and cash
Renewables: increasing scale, growing ambition

Renewables gross installed capacity                Gross portfolio to 2025
GWp                                                GWp

                                         10 GW

                                                   In operation                    In construction
         10                      7 GW

          5                                                       35 GW
                                                   Adani
                                                   Green
                                                   (20%)

                                                                                 In development
                2018     2019    2020     2021

              Gross organic Capex ~5 B$ in 2021      2025 GW target in portfolio
               > 10% Equity IRR for all projects

                                                                  2020 Results and Outlook   |   24
Renewables: capturing early stage opportunities at low entry cost
 Keeping up 2020 momentum
                                                                                             Major building block of
                                                                                              Renewables strategy
                                                                       1st steps in US                                     Offshore wind feeding
                                                                  utility scale projects                                    post 2025 pipeline

                                                                    1.6 + 2.2                 20% of Adani
                                                    Up to                 GW                  Green Energy                         1.5 GW
  800 MW              3 GW           5 GW          1.5 GW
   Qatar              India          Spain           UK
                                                                          USA                    India                                 UK

                           10 GW in 2020                                                      > 10 GW 2021 YTD                          More to come

1st large solar   Partnership     Entered        1st giant       50/50 JV with Hanwha        ~20 GWp of contracted         50/50 GIG (Macquarie)
plant in Qatar    with Adani      solar market   offshore wind                               capacity                      – Total
                                                                 Sunchase pipeline (Texas)
                  in India        in Spain       project in UK                               AGEL objective: 25 GWac       Round 4 award
                                                                 12+4 solar & storage
                                                                                             = 32 GWp by 2025
                                                                 projects
                                                                                             N°1 solar developer in
                                                                 Start-ups over 2020-24
                                                                                             the world*
                                                                 Phased premium
                                                                                             2 B$ equity investment
                                                                 payments

                                                                             2021 Hybrid bond to finance renewables
                                                                                          3 B€ – average coupon 1.9%
                                                                                     Highly competitive cost of capital
 * Source Mercom capital

                                                                                                                      2020 Results and Outlook   |   25
Deep Dive in Total Renewables business

      Total Solar                                                     Adani Green                                        Total Distributed
                              Total Quadran        Total EREN                             Offshore Wind
     International                                                     Energy Ltd                                          generation
                                   100%               30%                                     100%
         100%                                                             20%                                                  100%

 Solar in Europe,           Solar and onshore   Solar and onshore   Solar and wind in   Fixed bottom in UK             Global business
 US and Middle              wind in France      wind worldwide      India               (JVs)                          100% except JV
 East                                                                                                                  (50/50) with
                                                Option to acquire                       Floating offshore in           Envision for China
 50/50 JV with                                  100% in 2023                            South Korea, UK
 AGEL in India                                                                          and France (JVs)               SunPower (52%
                                                                                                                       stake) in US

        3.3 GW                    1 GW               1.9 GW               - GW                 - GW                           0.8 GW

                          Priority to developing utility scale portfolio

Gross capacity end-2020

                                                                                                               2020 Results and Outlook   |   26
Renewables delivering predictable long-term cash flow

                                                             In development           In development
         In operation               In construction
                                                                 to 2025                 post-2025

                7 GW                      5 GW                      23 GW                    4 GW
               Net : 3.1                  Net : 3                  Net : 21                  Net : 2

       Covered by PPA               Covered by PPA            Covered by PPA           Covered by PPA
                > 99%                      90%                  Already 40%

     Average remaining
                                    Average duration         Average duration         Offshore wind PPAs
          duration
                                         21 years                 20 years            under negotiation
             ~18 years

                                                              Offtaker: ~60% state,
    Offtaker: > 95% state            Offtaker: 99% state
                                                                 ~40% corporate
  av. PPA price > 110 $/MWh       av. PPA price ~55 $/MWh   av. PPA price ~45 $/MWh

                            ~60% of portfolio (>20 GW) already covered by PPA

All figures at 05/02/2021

                                                                                       2020 Results and Outlook   |   27
Renewables : delivering profitable growth
Equity IRR > 10% through capital light model

Cumulative cash flow model (equity view)*
B$
                                                                                                       Farm-downs:
         Development                                                                              accelerating cash flow,
         Construction                                  Operation
                                                                                                    increasing returns,
                                                                                                    derisking portfolio

                                                                                    Shareholder
                                                                                                  2018-2021
                                                                                    return
                                                                                                  5 farm-downs executed

                                                                                                  France and Japan portfolio
                                                                                    Farm down
                                                                                    proceeds      550 MW for 1.1 B$ EV

                3 to 5                     1         1 to 5     1 to 15   1 to 30
                Years                                      (Years)
                Equity                  Farm-                    PPA       Tail
              injection                 down                    Period    upside
                ~30%                     50%                              Period

* Based on 10 GW announced in 2020, on a normalized COD basis

                                                                                                              2020 Results and Outlook   |   28
Growing profitable power business

Electricity production (Group share)*                                 Electricity Proportional EBITDA (Group share)**
TWh                                                                   B$

                                                                                 1.0
                                               ~20 TWh

          20                      14 TWh

                                                                                 0.5

          10
                                                                                                                                       Renewables

                                                         Renewables

                    2019           2020         2021                                        2019              2020             2021

* From renewables and gas fired power plants                          ** Including proportional share of equity affiliates and SAFT

                                                                                                                       2020 Results and Outlook   |   29
Integrated LNG sales growth adding resilient cash flow
2nd largest worldwide player

CFFO*                                                              LNG sales
B$                                                                 Mt/y

                                                3.2 B$                                          +10%
                                                                                      +10%

                                                                                                  42
                             3                                                         38
                                                                          40
                                                                                34                        Spot

                                    40 $/b
                                                                                                          Supply from
                                                                                                          3rd party

                                                                          20
                                                                                                          Supply from
                                                                                                          equity JVs

                                                                                                          Equity JV sales
                                                                                                          to 3rd party

                                    2019        2020                           2019   2020       2021
Brent ($/b)                          64           42
HH ($/Mbtu)                          2.5         2.1
JKM ($/Mbtu)                         5.5         4.4

                                             Creating value from scale and arbitrage
* Excl. working capital variation

                                                                                             2020 Results and Outlook   |   30
Progressing flagship LNG projects despite the crisis

                           Russia – Arctic LNG2                                  Nigeria LNG Train 7
                       Total 21.6%1 – 19.8 Mt/y capacity                       Total 15% – 7.6 Mt/y capacity

                     Leveraging Yamal LNG success                                Low-cost expansion
                    45% progress on Train 1 end-2020                      EPC contracts awarded in May 20
                    Carbon intensity3 33 kgCO2/boe                         Carbon intensity3 30 kgCO2/boe

                             Mozambique LNG                                      Mexico – ECA LNG
                        Total 26.5% – 13.1 Mt/y capacity                      Total 16.6% – 3.2 Mt/y capacity

                          World-class gas resource                Low-cost project, sourced from low cost Permian gas,
                           21% progress end-2020                    located on Pacific coast, closer to Asia market
                       Monitoring security issues                                  Sanction in 4Q20
                    Carbon intensity3 25 kgCO2/boe                         Carbon intensity3 28 kgCO2/boe

                                           Delivering > 1.5 B$/y CFFO2 at 50 $/b 2025+
1   10% direct + 11.64% indirect
2   CFFO project view in Group share
3
    Upstream + Liquefaction, for ECA LNG: liquefaction only

                                                                                                   2020 Results and Outlook   |   31
Advancing renewable gas

                  Europe                       United States                        Hydrogen
                n°1 in France            Teaming up with Clean Energy              First pilot project

       Fonroche acquisition               50/50 JV with Clean Energy*            50/50 JV with Engie
    500 GWh/y renewable gas
       production (7 plants)                  Integrated strategy:           40 MW electrolyser to produce
  + 4 projects totaling 425 GWh/y          renewable gas production       firm green H2 in La Mède biorefinery
                                         bio-CNG & bio-LNG distribution   from > 100 MW operated solar farms
    Feed-in tariffs secured for 15 y
    > 10% market share in France

                         Targeting 1.5 TWh/y of renewable gas production by 2025
* Total owns 25% of Clean Energy

                                                                                         2020 Results and Outlook   |   32
Oil E&P: strong Group cash provider
Performance underpinned by high-quality assets

Oil E&P                                              Upstream adjusted net operating income
B$                                                   B$, Total and peers

                                                                                                                     4

                                            7.6 B$
                                            CFFO*

                              1.5 B$
                               NOI

                               2020          2020
     Brent ($/b)                       42

               Oil E&P : 50% of Group CFFO                                  Best in class results

                                                     Peer group: BP, Chevron, Exxon, Shell.
* Excl. working capital variation                    Estimated for BP, excluding 7.6 B$ recurring write-off

                                                                                                      2020 Results and Outlook   |   33
Short term production impacted by quotas, maintaining 2025 outlook

Upstream production
Mboe/d                                                                                  3.3 - 3.4
                                                                                        Mboe/d

                                                                   stable                           Pre-FID
               3.0
                                                                                                    Projects
        3                                                                                           already
                                                        2.9
                                                                                                    launched
                        Decline       New     Quotas*
                                     projects & Libya
                                                               Decline Quotas*
                                                                       & Libya

                                                                                                    Base

        2
               2019                                     2020                     2021     2025

                      12 years of proved reserves – 60% gas – 127% 3-year RRR**
                               18 years of proved and probable reserves
 * Quotas & voluntary curtailments
** Reserves Replacement Rate

                                                                                            2020 Results and Outlook   |   34
Taking FIDs for large profitable oil projects despite the storm

           Mero 3 – Brazil                          Lake Albert – Uganda
           Total 20% – First oil 2024                  Total 56.6%, Op. – First oil 2024

                                                                        Tilenga
                                                                                   Uganda
                                                                   Lake Albert
                                                                    Kingfisher
                                                                                                     Kenya
                                                                                     Lake
                                                                                    Victoria

                                                  Democratic
                                               Republic of Congo             EACOP
                                                                                                         Tanga
                                                                                 Tanzania

        150 kb/d (100%) capacity                      230 kb/d (100%) capacity
         Technical costs < 20 $/b                      Technical costs < 20 $/b
      Carbon intensity 15 kgCO2/boe                 Carbon intensity 13 kgCO2/boe

          On the way to 150 kb/d               Leveraging giant resource base while
     equity production in Brazil by 2025     managing social and environmental impacts

                      Consistency with Total Climate ambition :
                 low technical costs and minimized carbon intensity
                                                                                        2020 Results and Outlook   |   35
Exploration targeting low cost development projects
Exploration Budget 2021 800 M$

                        Suriname & Guyana – Keeping up the 2020 momentum

                             Block 58
                                                                          4 major                  Block 58
                         Canje     Bulletwood                           discoveries              operatorship
                                                                          to date                 Jan 2021
         Orinduik                               Maka Central
                                                                                          1/3
                                                Kwaskwasi                               of overall
                                                Sapakara West                          2021 Explo
GUYANA              Kanuku
                                                Keskesi
                                                                                       & Appraisal
                                      B58
                                                                                          effort
                                                                                                    Targeting
                                                                       Up to 9 wells
   Discoveries                                                                                  first oil by 2025
                                                                         in 2021
   Upcoming wells
  Exploration blocks
                                                                                                 from Block 58
                                                            0   50km
  Other discoveries
                                 SURINAME

                                      1 $/boe discovery cost in 2020 worldwide

                                                                                                     2020 Results and Outlook   |   36
Downstream cash flow benefiting from integration
2020 refining margins at historic low

CFFO*
B$
                                                                            2020 Highlights

                                    4.7 B$                 > 5 B$   Resilient petrochemical

                   6
                                             Refining
                                             margin                 Trading overperforming
                   5                         impact

                                             Refining &
                                                                    Marketing & Services
                                             Chemicals              contributing solid cash flow

                                             Marketing &
                                                                    Growing profitable
                                             Services               renewable fuel

                          2020       2020                   2021
                        Guidance    Actual
VCM Refining                  30     11                      25
Europe ($/t)

* Excl. working capital variation

                                                                                 2020 Results and Outlook   |   37
European Refining: dynamic adaptation to the market

2020 European refining margin on variable costs
$/t
                                                                  Covid-related action plan

                                                     Reduced cash spends        Reduced runs to 61%
                                                       by 0.4 B$ in 2020
                                                                                Voluntary shutdown of
                                                        (Opex, Capex)             Donges end 2020
40                       Min - max
                          2016-19

                                                           Adapting to structural demand decline

15
                                                                                Converting Grandpuits
                                                     Selling Lindsey refinery      (100 kb/d) into a
                                                             in the UK           zero crude platform :
                                                            110 kb/d             renewable fuels and
-10
                                                                                      bioplastics
      January   April   July         October   Jan

                                                                                  2020 Results and Outlook   |   38
M&S: resilience supported by strong retail business

M&S fuel sales evolution*                                                              M&S CFFO**
2020 vs. 2019 (%)                                                                      B$

                                                                                                                              -15%
                                                                                                          2.5

    0%
                                                                            Diesel
                                                                                                                                       B2B Sales
                                                                            Gasoline                                                   (incl. Aviation,
                                                                                                                                       Marine Fuels)

  -40%

                                                                                                                     Retail   Retail

                                                                            Jet
  -80%
          Jan Feb Mar Apr May Jun Jul Aug Sep Oct Nov Dec                                                             2019    2020

                  M&S sales: -20% vs 2019                                                                Non-fuel contributing to
                                                                                                       1/3 of retail CFFO in Europe
* Worldwide sales, excluding perimeter change, trading and refining bulk sales         ** Excl. working capital variation

                                                                                                                               2020 Results and Outlook   |   39
Outlook
Strong cash flow outlook supported by profitable projects

Debt adjusted cash flow (DACF)
B$
                                                                                  ROE > 10%
                                                                                   @50 $/b

                                                    60 $/b
                30
                                                    60 $/b            Growth by 2025 supported by

                                                    50 $/b
                                                                      • iGRP: +3 B$, driven by LNG
                                                             40 $/b
                                                                        and Renewables growth
                                                                      • Downstream: +2 B$
                20                         50 $/b
                          50 $/b
                                                                      • E&P: +1 B$
                                           40 $/b

                                                                      Capturing oil price upside:
                                                                      2021 sensitivity 3.2 B$ for 10 $/b
                10                                                    liquid realized price
                           2020            2021     2025
Brent ($/b)                 42             40/50    50/60
NBP ($/Mbtu)                3.3             4.3      5.0
VCM* ($/t)                  11               25      30

* European refining variable cost margin

                                                                                    2020 Results and Outlook   |   41
Clear priorities for cash flow allocation

         1                   2                      3                          4
     Capital                                    Balance                  Share
                         Dividend
   investment                                    sheet                  buyback

    12 B$ in 2021
  13-16 B$ 2022-25                            Gearing < 20%            Flexible at
                     Supporting dividend
                                                                    higher oil prices
                      through the cycle
Renewables & Power                         Grade A credit rating   when gearing < 20%
      > 20%

                                                                     2020 Results and Outlook   |   42
Transforming Total into TotalEnergies
Growing profitably while getting to Net Zero

  Growing energy from            Upgrading
  LNG and Renewables         Climate roadmap

   Embedding climate           Business model
      ambition into         supporting dividend
    financing policy         through the cycle

                TotalEnergies
         a broad energy company
 creating long-term value for shareholders

                                                  2020 Results and Outlook   |   43
Appendix

           2020 Results and Outlook   |
Deep Dive in Total Renewables business
February 2021
Deep Dive in Total Renewables business

      Total Solar                                                     Adani Green                                        Total Distributed
                              Total Quadran        Total EREN                             Offshore Wind
     International                                                     Energy Ltd                                          generation
                                   100%               30%                                     100%
         100%                                                             20%                                                  100%

 Solar in Europe,           Solar and onshore   Solar and onshore   Solar and wind in   Fixed bottom in UK             Global business
 US and Middle              wind in France      wind worldwide      India               (JVs)                          100% except JV
 East                                                                                                                  (50/50) with
                                                Option to acquire                       Floating offshore in           Envision for China
 50/50 JV with                                  100% in 2023                            South Korea, UK
 AGEL in India                                                                          and France (JVs)               SunPower (52%
                                                                                                                       stake) in US

        3.3 GW                    1 GW               1.9 GW               - GW                 - GW                           0.8 GW

                          Priority to developing utility scale portfolio

Gross capacity end-2020

                                                                                                               2020 Results and Outlook   |   1
Renewables delivering predictable long-term cash flow

                                                       In development      In development
         In operation               In construction
                                                           to 2025            post-2025

                7 GW                     5 GW               23 GW                 4 GW
               Net : 3.1                 Net : 3            Net : 21              Net : 2

       Covered by PPA               Covered by PPA      Covered by PPA      Covered by PPA
                > 99%                     90%            Already 40%

     Average remaining
                                    Average duration   Average duration    Offshore wind PPAs
          duration
                                        21 years           20 years        under negotiation
             ~18 years

                                                           Offtaker:
             Offtaker:                 Offtaker:
                                                          ~60% state,
            > 95% state                99% state
                                                        ~40% corporate

                            ~60% of portfolio (>20 GW) already covered by PPA

All figures at 05/02/2021

                                                                            2020 Results and Outlook   |   2
7 GW in Operation
Producing ~6 TWh/y of electricity

By developer                           By technology                 By geography
GW                                     GW gross                      GW gross

                       Gross   Net*
                                         20%                                                 France
                                         wind                            India
 Total Solar Int.       3.3    1.6
                                                                                                              Rest of
 Total Quadran          1.0    0.7                                                                            Europe

 Total EREN             1.9    0.5
                                                                                                               Africa

 Total Solar DG         0.8    0.3                                                                            Middle East

                                                                                                      North
 Total                  7.0    3.1
                                                            80%                     Asia     South
                                                                                                      America

                                                            solar                Oceania     America

                                      ~4.5 years average asset age
                18 years remaining PPA duration at average PPA price > 110 $/MWh
* Group share

                                                                                   2020 Results and Outlook    |   3
5 GW in Construction

                                By technology               By geography
                                GW gross                    GW gross

                                  40%                                                France
                 Gross   Net*     wind                           India
                                Onshore
 Capacity (GW)    5       3                                                                           Rest of
                                                                                                      Europe

                                                              Asia
                                                           Oceania
                                Offshore
                                                                 South

                                                   60%           America
                                                                                     Middle East
                                                   solar

                 21 years average PPA duration at PPA price ~55 $/MWh
* Group share

                                                                           2020 Results and Outlook   |    4
2025 pipeline > 20 GW
Targeting > 10% equity IRR

                                        By technology                       By geography
                                        GW gross                            GW gross

                                          10%
                                          wind
                                                     Onshore
                         Gross   Net*                                            India                          France
                                          Offshore

 Capacity (GW)             23    21

                                                                   Asia/Oceania                                         Spain
                                                                       South America

                                                               90%                       North
                                                                                         America
                                                                                                          Rest of
                                                                                                          Europe
                                                               solar

                                              9 GW under PPA
                         20 years average PPA duration at PPA price ~45 $/MWh
* Group share, pre-farm-down

                                                                                             2020 Results and Outlook   |   5
> 20 GW covered by PPA

                                             In operation                    In construction                     In development to 2025
 Gross capacity                    Onshore                          Onshore Offshore                   Onshore Offshore
 covered by PPA (GW)                Wind        Solar       Total    Wind    Wind      Solar   Total    Wind    Wind             Solar      Total

 Europe                                1.3       0.5        1.8       0.3      0.8      0.3    1.4         0.3         x          3.5           3.9

 Asia                                   x        4.1        4.2       0.3       -       2.1    2.4         0.4          -         4.1           4.4

 North America                          x        0.6        0.6        x        -       x      0.1          x           -         0.5           0.6

 RoW                                    x        0.3        0.4       0.3       -       0.2    0.5          x           -         0.2           0.3

 Total                                 1.4       5.6        7.0       0.9      0.8      2.7    4.4         0.8         x          8.3           9.2

                                             In operation                    In construction                     In development to 2025
 PPA price                         Onshore                          Onshore Offshore                   Onshore Offshore
 ($/MWh)                            Wind        Solar       Total    Wind    Wind      Solar   Total    Wind    Wind             Solar      Total

 Europe                                119       251        156       79       61       63      64         72          x          43            48

 Asia                                   x        89          89       50        -       45      46         34           -         40            40

 North America                          x        155        157        x        -        -     147          x           -         32            49

 RoW                                    x        100        102       52        -       45      50          x           -         95            126

 Total                                 116       112        113       64       61       47      54         65          x          42            45

x : not disclosed, capacity < 0.2 GW

                                                                                                       Deep Dive in Total Renewables business    |    6
4 GW offshore wind post-2025 pipeline

            Up to 400 MW             > 2,000 MW              1.5 GW
                 UK                  South Korea               UK

           Erebus/Valorous               Bada            Round 4 award

             First floating          Scaling up in        Scaling up in
            offshore wind               floating          fixed bottom
                                     offshore wind        offshore wind

                                      50% Total             50% Total
              80% stake
                                 50% Macquarie (GIG)   50% Macquarie (GIG)

            Target FID 2024          Target FID 2023
               (100 MW)                 (500 MW)

                              2020                            2021

                                                              Deep Dive in Total
                                                                            2020Renewables
                                                                                 Results and business
                                                                                             Outlook    |   7
Growing profitable power generation from Renewables

Renewables production (Group share)   Renewables Proportional EBITDA (Group share)*
TWh                                   B$

                            ~7 TWh

                                                0.5
                   4 TWh

      4

           2019     2020     2021                           2019              2020           2021

      Targeting > 30 TWh by 2025                3 B$ Group share net debt **
                                       * Including proportional share of equity affiliates
                                      ** At December 31, 2020

                                                                        Deep Dive in Total
                                                                                      2020Renewables
                                                                                           Results and business
                                                                                                       Outlook    |   8
Disclaimer
This document may contain forward-looking statements within the meaning of the Private Securities                 (ii) Inventory valuation effect
Litigation Reform Act of 1995, notably with respect to the financial condition, results of operations, business   The adjusted results of the Refining & Chemicals and Marketing & Services segments are presented
activities and industrial strategy of TOTAL. This document may also contain statements regarding the              according to the replacement cost method. This method is used to assess the segments’ performance and
perspectives, objectives and goals of the Group, including with respect to climate change and carbon              facilitate the comparability of the segments’ performance with those of its competitors.
neutrality (net zero emissions). An ambition expresses an outcome desired by the Group, it being specified
                                                                                                                  In the replacement cost method, which approximates the LIFO (Last-In, First-Out) method, the variation of
that the means to be deployed do not depend solely on TOTAL. These forward-looking statements may
                                                                                                                  inventory values in the statement of income is, depending on the nature of the inventory, determined using
generally be identified by the use of the future or conditional tense or forward-looking words such as
“envisions”, “intends”, “anticipates”, “believes”, “considers”, “plans”, “expects”, “thinks”, “targets”, “aims”   either the month-end price differentials between one period and another or the average prices of the
                                                                                                                  period rather than the historical value. The inventory valuation effect is the difference between the results
or similar terminology. Such forward-looking statements included in this document are based on economic
data, estimates and assumptions prepared in a given economic, competitive and regulatory environment              according to the FIFO (First-In, First-Out) and the replacement cost.
and considered to be reasonable by the Group as of the date of this document.                                     (iii) Effect of changes in fair value
                                                                                                                  The effect of changes in fair value presented as an adjustment item reflects for some transactions
These forward-looking statements are not historical data and should not be interpreted as assurances that
the perspectives, objectives or goals announced will be achieved. They may prove to be inaccurate in the          differences between internal measures of performance used by TOTAL’s management and the accounting
                                                                                                                  for these transactions under IFRS.
future, and may evolve or be modified with a significant difference between the actual results and those
initially estimated, due to the uncertainties notably related to the economic, financial, competitive and         IFRS requires that trading inventories be recorded at their fair value using period-end spot prices. In order to
regulatory environment, or due to the occurrence of risk factors, such as, notably, the price fluctuations in     best reflect the management of economic exposure through derivative transactions, internal indicators
crude oil and natural gas, the evolution of the demand and price of petroleum products, the changes in            used to measure performance include valuations of trading inventories based on forward prices.
production results and reserves estimates, the ability to achieve cost reductions and operating efficiencies
without unduly disrupting business operations, changes in laws and regulations including those related to         TOTAL, in its trading activities, enters into storage contracts, whose future effects are recorded at fair value
the environment and climate, currency fluctuations, as well as economic and political developments,               in Group’s internal economic performance. IFRS precludes recognition of this fair value effect.
changes in market conditions, loss of market share and changes in consumer preferences including those
                                                                                                                  Furthermore, TOTAL enters into derivative instruments to risk manage certain operational contracts or
due to epidemics such as Covid-19. Additionally, certain financial information is based on estimates              assets. Under IFRS, these derivatives are recorded at fair value while the underlying operational transactions
particularly in the assessment of the recoverable value of assets and potential impairments of assets
                                                                                                                  are recorded as they occur. Internal indicators defer the fair value on derivatives to match with the
relating thereto.
                                                                                                                  transaction occurrence.
Neither TOTAL nor any of its subsidiaries assumes any obligation to update publicly any forward-looking
                                                                                                                  The adjusted results (adjusted operating income, adjusted net operating income, adjusted net income) are
information or statement, objectives or trends contained in this document whether as a result of new
                                                                                                                  defined as replacement cost results, adjusted for special items, excluding the effect of changes in fair value.
information, future events or otherwise. Further information on factors, risks and uncertainties that could
affect the Group’s business, financial condition, including its operating income and cash flow, reputation or     Euro amounts presented herein represent dollar amounts converted at the average euro-dollar (€-$)
outlook is provided in the most recent version of the Universal Registration Document which is filed by the       exchange rate for the applicable period and are not the result of financial statements prepared in euros.
Company with the French Autorité des Marchés Financiers and the annual report on Form 20-F/A filed with the
United States Securities and Exchange Commission (“SEC”).                                                         This document also contains extra-financial performance indicators, including a carbon intensity indicator
                                                                                                                  for energy products used by Total customers, that measures the average greenhouse gas emissions of
Financial information by business segment is reported in accordance with the internal reporting system and        those products, from their production to their end use, per unit of energy. This indicator covers the direct
shows internal segment information that is used to manage and measure the performance of TOTAL. In                GHG emissions of production and processing facilities (scope 1) and their indirect emissions associated with
addition to IFRS measures, certain alternative performance indicators are presented, such as performance          energy purchase (Scope 2), as well as the emissions associated with the use of products by the customers
indicators excluding the adjustment items described below (adjusted operating income, adjusted net                of the Group (Scope 3) which Total does not control (for the definitions of scopes 1, 2 and 3, refer to Total’s
operating income, adjusted net income), return on equity (ROE), return on average capital employed                Universal Registration Document).
(ROACE), gearing ratio and operating cash flow before working capital changes. These indicators are meant to
facilitate the analysis of the financial performance of TOTAL and the comparison of income between periods.       This document does not constitute an offer to sell or the solicitation of an offer to buy securities in any
                                                                                                                  jurisdiction. The securities offered in any potential capital markets transaction will be made by means of a
They allow investors to track the measures used internally to manage and measure the performance of the
Group.                                                                                                            prospectus.

These adjustment items include:                                                                                   Cautionary Note to U.S. Investors – The SEC permits oil and gas companies, in their filings with the SEC, to
                                                                                                                  separately disclose proved, probable and possible reserves that a company has determined in accordance
(i)        Special items                                                                                          with SEC rules. We may use certain terms in this presentation, such as “potential reserves” or “resources”, that
      Due to their unusual nature or particular significance, certain transactions qualified as "special items"   the SEC’s guidelines strictly prohibit us from including in filings with the SEC. U.S. investors are urged to
      are excluded from the business segment figures. In general, special items relate to transactions that       consider closely the disclosure in our Form 20-F/A, File N° 1-10888, available from us at 2, place Jean Millier –
      are significant, infrequent or unusual.                                                                     Arche Nord Coupole/Regnault – 92078 Paris-La Défense Cedex, France, or at our website total.com. You can
                                                                                                                  also obtain this form from the SEC by calling 1-800-SEC-0330 or on the SEC’s website sec.gov.
However, in certain instances, transactions such as restructuring costs or asset disposals, which are not
considered to be representative of the normal course of business, may be qualified as special items
although they may have occurred within prior years or are likely to occur again within the coming years.

                                                                                                                                                                                         2020 Results and Outlook            |
For more information, please visit

total.com

TOTAL S.E.
Investor Relations
10 Upper Bank Street, Canary Wharf
London E14 5BF
United Kingdom
Share capital: 6,632,810,062.50 euros
542 051 180 RCS Nanterre                Reception:            +33 (0)1 47 44 45 46
total.com                               Investor Relations:   +44 (0)207 719 7962
You can also read