Investor Roadshow Presentation - November 2016

Page created by Chris Logan
 
CONTINUE READING
Investor Roadshow Presentation - November 2016
STOCK EXCHANGE LISTINGS: NEW ZEALAND (MCY) / AUSTRALIA (MCY)

NEWS RELEASE

Investor Roadshow Presentation – November 2016
22 November 2016

Mercury will be giving presentations at a series of international investor meetings during November 2016.

The presentation materials are attached.

ENDS

For further information:
David Glendining
Head of Communications
T 0272 105 337

Tim Thompson
Investor Relations/Treasury
T 0275 173 470

ABOUT MERCURY NZ LIMITED

At Mercury we’re thinking boldly about the possibilities with energy and inspiring New Zealanders with our renewable electricity
and ideas – making energy wonderful. Energy from Mercury’s hydro and geothermal stations will power a brighter future for our
country.

Visit us at: www.mercury.co.nz
Investor Roadshow Presentation - November 2016
Mercury
Investor Roadshow

FRASER WHINERAY    WILLIAM MEEK
Chief Executive    Chief Financial Officer

22 November 2016
Investor Roadshow Presentation - November 2016
DISCLAIMER
This presentation has been prepared by Mercury NZ Limited and its group of companies (“Company”) for informational purposes. This disclaimer
applies to this document and the verbal or written comments of any person presenting it.
Information in this presentation has been prepared by the Company with due care and attention. However, neither the Company nor any of its
directors, employees, shareholders nor any other person gives any warranties or representations (express or implied) as to the accuracy or
completeness of this information. None of the Company, its directors, employees, shareholders or any other person shall have any liability
whatsoever to any person for any loss (including, without limitation, arising from any fault or negligence) arising from this presentation or any
information supplied in connection with it.
This presentation may contain projections or forward-looking statements regarding a variety of items. Such projections or forward-looking
statements are based on current expectations, estimates and assumptions and are subject to a number of risks, and uncertainties, including
material adverse events, significant one-off expenses and other unforeseeable circumstances, such as, without limitation, hydrological conditions.
There is no assurance that results contemplated in any of these projections and forward-looking statements will be realised, nor is there any
assurance that the expectations, estimates and assumptions underpinning those projections or forward looking statements are reasonable. Actual
results may differ materially from those projected in this presentation. No person is under any obligation to update this presentation at any time after
its release or to provide you with further information about the Company.
A number of non-GAAP financial measures are used in this presentation, which are outlined in the appendix of the presentation. You should not
consider any of these in isolation from, or as a substitute for, the information provided in the audited consolidated financial statements, which are
available at www.mercury.co.nz.
The information in this presentation is of a general nature and does not constitute financial product advice, investment advice or any
recommendation. The presentation does not constitute an offer to sell, or a solicitation of an offer to buy, any security and may not be relied upon in
connection with the purchase or sale of any security. Nothing in this presentation constitutes legal, financial, tax or other advice.

     2 DISCLAIMER
Investor Roadshow Presentation - November 2016
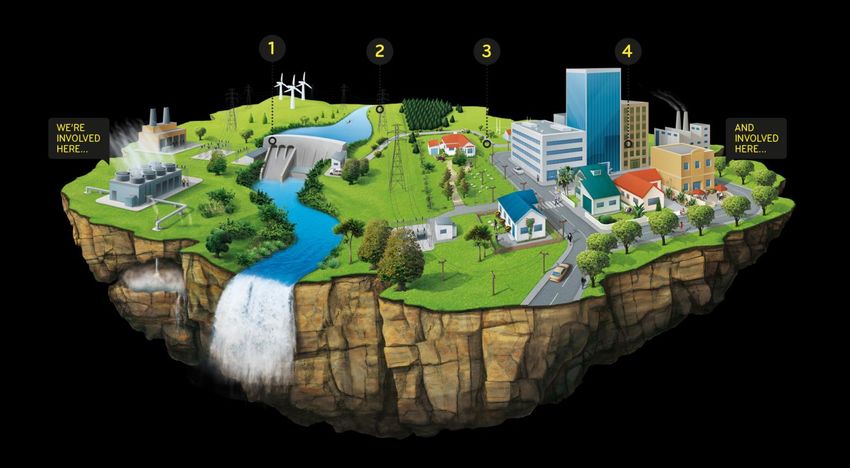
3 COUNTRY, INDUSTRY & MERCURY
Investor Roadshow Presentation - November 2016
NEW ZEALAND ECONOMIC OVERVIEW
Key Facts                                                              >   Stable political environment
Credit Rating: AA/stable                                                   > National government since 2008 and in 3rd term
Population: 4.7 million
                                                                       > Robust GDP growth achieved over recent years (currently
Currency: New Zealand Dollar (NZD)                                         3.6%1), with below-trend unemployment (currently 4.9%2)
GDP: NZ$250 billion
                                                                           Current supportive drivers of GDP growth include:
                                                                           >   Strong tourism growth
NEW ZEALAND GDP BY SECTOR
                                                                           >   Robust construction sector activity
                                                                           >   Robust house price growth
                                     Services Sector
                                                                           >   Low interest rate environment (1.75% cash rate)
                                     Manufacturing, Energy &
                                                                           >   Historic high net migration (60,000 net annual inflows or 1.3%)
                                     Construction
                                     Agriculture, Forestry & Fishing       Factors dampening GDP growth include:
                                     Mining                                > Global geopolitical and growth concerns
                                                                           > Slower growth profile for China and East Asia
                                     Other
                                                                           > Canterbury rebuild activity at peak
                                                                       >   Inflation expected to stay below central bank target (1-3%) over
                                                                           the near-term (currently 0.4%2)
                                                                                                                      1   Year to 30 June 2016
                                                                                                                      2   Year to 31 September 2016
     4 COUNTRY
Investor Roadshow Presentation - November 2016
NEW ZEALAND’S COMPETITIVE ADVANTAGE IN ELECTRICITY

                                  RENEWABILITY
                            NZ 3rd highest level of renewable
                             electricity generation in OECD

 COMPETITIVENESS                                                                           RELIABILITY
       ‘Among the most                                                                     NZ ranks 3rd lowest out of
     competitive markets                                                                   25 large energy-consuming
            in the world’                                                                  countries for energy
                                                                                           security risk

                            Source: Accenture, Ministry of Business, Innovation & Employment, United States Chamber of Commerce

  5 COUNTRY
Investor Roadshow Presentation - November 2016
THE INDUSTRY WE OPERATE IN
                                                                                                  RETAILERS AND
1. GENERATORS                                                                                     CONSUMERS
>   Generate electricity and                                                                  >   22 retailers buy from
    sell to wholesale market                                                                      wholesale market and on-
>   5 major generators                                                                            sell to nearly 2 million
    producing about 95% of                                                                        consumers
    NZ‟s electricity                                                                          >   Retail prices determined by
>   80% renewable electricity                                                                     competition (unregulated)
    (unsubsidised)                                                                            >   Electricity Authority
>   Solar installed in 11,500                                                                     responsible for promoting
    or 0.6% of total customer                                                                     competition, efficiency and
    connections                                                                                   reliability of supply for long-
                                                                                                  term benefit of consumers
                                                                                              >   NZAS (aluminium smelter)
                                                                                                  13% of national demand
                                                                                              >   2 major metering
                 2. THE NATIONAL GRID                             DISTRIBUTION AND                companies with national
                 >   Transpower (State-owned                      NETWORK OWNERS                  smart meter penetration of
                     Enterprise) is owner and operator                                            69%
                                                              >   15,000km of overhead and
                 >   Transports high voltage electricity to       underground networks
                     networks and large industrial users
                                                              >   29 distribution companies
                 >   1200MW HVDC link between South           >   Regulated monopolies
                     and North Islands

           6 INDUSTRY
Investor Roadshow Presentation - November 2016
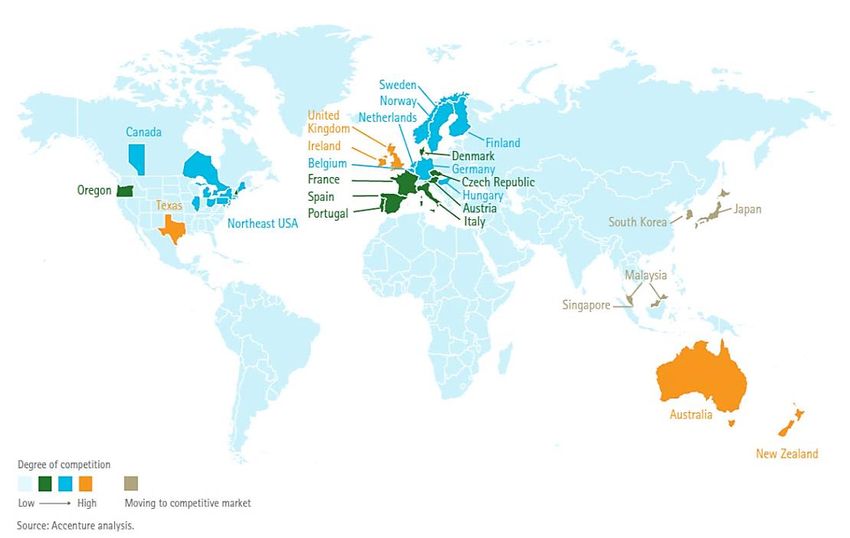
UNSUBSIDISED RENEWABLE ELECTRICITY MARKET
      NEW ZEALAND’S GENERATION MIX                                                                                                                                                                   2015 OECD RENEWABLE ELECTRICITY
        Hydro                Wind            Coal               Gas            Waste Heat/Biogas, Oil and Wood                                              Geothermal
      50,000                                                                                                                                                                                         100
      45,000                                                                                                                                                                                             90
      40,000                                                                                                                                                                                             80
      35,000                                                                                                                                                                                             70
      30,000                                                                                                                                                                                             60
      25,000

                                                                                                                                                                                                     %
GWh

                                                                                                                                                                                                         50
      20,000                                                                                                                                                                                             40
      15,000                                                                                                                                                                                             30
      10,000                                                                                                                                                                                             20
       5,000                                                                                                                                                                                             10
          0                                                                                                                                                                                               0
               1990
                      1991
                             1992
                                    1993
                                           1994
                                                  1995
                                                         1996
                                                                1997
                                                                       1998
                                                                              1999
                                                                                     2000
                                                                                            2001
                                                                                                   2002
                                                                                                          2003
                                                                                                                 2004
                                                                                                                        2005
                                                                                                                               2006
                                                                                                                                      2007
                                                                                                                                             2008
                                                                                                                                                    2009
                                                                                                                                                           2010
                                                                                                                                                                  2011
                                                                                                                                                                         2012
                                                                                                                                                                                2013
                                                                                                                                                                                       2014
                                                                                                                                                                                              2015

                                                                                                                                                                                                                           Israel

                                                                                                                                                                                                                      Denmark
                                                                                                                                                                                                                          Japan

                                                                                                                                                                                                                            Chile

                                                                                                                                                                                                                        Norway
                                                                                                                                                                                                                       Australia

                                                                                                                                                                                                                        Iceland
                                                                                                                                                                                                               United Kingdom
                                                                                                                                                                                                                         Ireland
                                                                                                                                                                                                                        Greece

                                                                                                                                                                                                                      Germany

                                                                                                                                                                                                                             Italy

                                                                                                                                                                                                                        Finland

                                                                                                                                                                                                                        Canada
                                                                                                                                                                                                                   Luxembourg

                                                                                                                                                                                                                         Turkey
                                                                                                                                                                                                                           Spain
                                                                                                                                                                                                                         France

                                                                                                                                                                                                                       Belgium
                                                                                                                                                                                                                          Korea

                                                                                                                                                                                                                       Hungary

                                                                                                                                                                                                                  United States
                                                                                                                                                                                                                   Netherlands

                                                                                                                                                                                                                         Poland
                                                                                                                                                                                                                        Estonia
                                                                                                                                                                                                                        Mexico

                                                                                                                                                                                                               Slovak Republic

                                                                                                                                                                                                                       Portugal

                                                                                                                                                                                                                    Switzerland
                                                                                                                                                                                                                       Sweden

                                                                                                                                                                                                                         Austria
                                                                                                                                                                                                                  New Zealand
                                                                                                                                                                                                               Czech Republic

                                                                                                                                                                                                                       Slovenia
                                                                                                                                                                                                              Source: Ministry of Business, Innovation & Employment, IEA
               7 INDUSTRY
Investor Roadshow Presentation - November 2016
COMPETITIVE RETAIL MARKET
                                                   2015 OECD RESIDENTIAL ELECTRICITY PRICES1

                                                   0.40

                                                   0.35

                                                   0.30

                                     US$ per kWh
                                                   0.25

                                                   0.20

                                                   0.15

                                                   0.10

                                                   0.05

                                                   0.00

                                                                   Norway

                                                                      Chile

                                                                 Denmark
                                                                     Japan

                                                                   Greece

                                                                 Germany
                                                                   Finland

                                                              Luxembourg

                                                                    Ireland

                                                                       Italy
                                                                    Turkey
                                                             United States
                                                                     Korea

                                                                   France
                                                               Switzerland

                                                                  Belgium

                                                                  Hungary

                                                                   Poland

                                                                  Portugal
                                                                   Mexico

                                                                  Sweden

                                                             New Zealand

                                                              Netherlands
                                                                   Austria

                                                          Slovak Republic
                                                                  Slovenia
                                                           Czech Republic
                                                          United Kingdom
                                                                  Estonia
                            1Residential pricing in US dollars per unit using Purchase Price Parity (PPP)
  8 INDUSTRY                Source: Ministry of Business, Innovation & Employment, IEA, Accenture
Investor Roadshow Presentation - November 2016
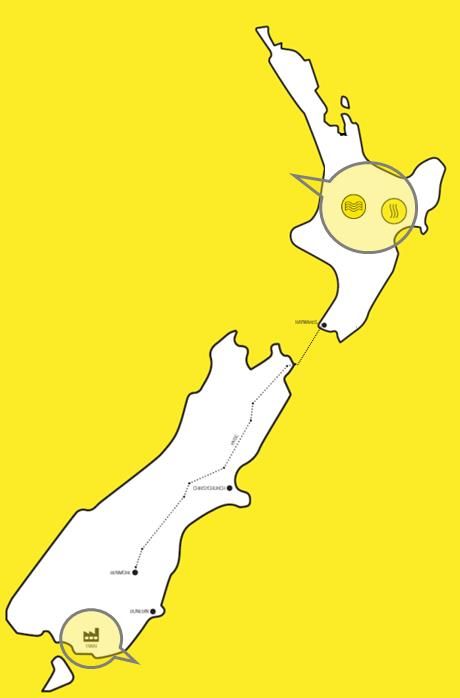
REGULATORY
Market
> Government and opposition parties constructively engaged in policy discussions
> Consultation continues on changes to the methodology for recovering the cost of transmission (Transmission Pricing
  Methodology - TPM) with implementation likely beyond 2019
  > Additional Mercury charges minor (indicatively assessed by Electricity Authority at ~$5m/annum)
> Regulatory focus on reforms to distribution pricing in response to emerging technology
Water
> No charge for use of water for hydro generation
> Consultation at national and regional levels regarding water quality standards and long-term water management
> Government has established a technical advisory group to advise on water allocation approaches to address Maori
  rights and interests
Climate
> Carbon cost expected to increase with the removal of the transitional 2-for-1 surrender obligations under the NZ
   Emissions Trading Scheme (ETS)
> Carbon pricing has increased 250% through FY2016 to circa $18/t
> Government announced policy package to promote the adoption of EVs - target 64,000 vehicles by 2021

  9 INDUSTRY
INTEGRATED ELECTRICITY GENERATOR & RETAILER

 10 MERCURY
OUR PURPOSE                                                            OUR GOAL
   Inspiring New Zealanders to enjoy energy in more                        To be New Zealand’s leading energy brand
                   wonderful ways

                Inspiring New Zealanders                                             OUR STRATEGY
   We want to inspire New Zealanders by delivering value,             Mercury will create long term value for our owners by:
         innovation and outstanding experiences
                                                                       1                        2                        3
                     To enjoy energy
                                                              Delivering customer      Leveraging core       Delivering sustainable
 We want our customers to enjoy what energy does for them          advocacy               strengths                  growth
and choose Mercury because we make a positive difference in
                                                                  Outstanding              Operational           Executing relevant
                        their lives                           customer experience           efficiency         strategic opportunities
                 In more wonderful ways                          Leading digital         Astute portfolio        Being ready for
                                                                   offerings              management             domestic growth
 We will bring new technology and ideas to create wonderful
 experiences for our customers in a uniquely New Zealand         Culture-driven          Efficient capital     Embracing emerging
                          context                                 innovation                allocation            technologies

  11 MERCURY
MERCURY’S COMPETITIVE ADVANTAGE

     100% renewable generation with two      Rain-fed North Island hydro catchment
     low-cost complementary fuel sources     with inflows correlated with winter peak
     in base-load geothermal and peaking     demand (unlike South Island)
     hydro

     North Island generation is uniquely     Building a track record of customer-
     located close to major load centres     led innovation and rewarding loyalty
     and not dependent on the inter-island
     transmission link (HVDC)

     Waikato Hydro System is the largest     Long-term commercial partnerships
     series of peaking stations in the       with Maori landowners and other key
     North Island                            stakeholders

 12 MERCURY
13 MARKET DYNAMICS
NEW ZEALAND ELECTRICITY SUPPLY
> Rationalisation of thermal capacity within FY2016           NZ ENERGY MARGIN
  has resulted in supply and demand being better
  balanced                                                                       30%                         Margin - Likely Generation Development

  > Mercury closed 140MW Southdown power station in                                                          Margin - 2 Huntly Rankine Units
    December 2015                                                                25%                         Margin
  > Contact Energy closed 400MW Otahuhu B power station in

                                                              NZ Energy Margin
    September 2015                                                               20%
> Genesis‟s Huntly Rankine units contracted through
  2022 ensuring energy security                                                  15%                                              Security Standard
  > Ultimate future linked to on-going operation of the New
    Zealand Aluminium Smelter (NZAS)                                             10%

                                                                                 5%

                                                                                 0%
                                                                                       2015 2016 2017 2018 2019 2020 2021 2022 2023 2024 2025

                                                                                                            Calendar Year

                                                                                                                 Source: Transpower, Mercury

 14 MARKET DYNAMICS
NEW ZEALAND ELECTRICITY DEMAND
      > High net migration and GDP per capita growth more than offsetting reductions in per household consumption
        resulting from efficiency gains
         > Highest demand on record for FY2016 and increases over the past two financial years relative to pcp
         > Demand up 0.3% in FY2016, 0.6% after normalising for temperature
      > Solar remains a niche customer proposition
         > Solar installed in 11,500 or 0.6% of total customer connections

  ANNUAL ELECTRICITY DEMAND AND GROWTH RATE                                                                                           TEMPERATURE ADJUSTED SEGMENT ELECTRICITY DEMAND
         Annual Growth Rate (RHS)                             Consumption (LHS)
                                                                                                                                      14,000                                                           FY2012
      44,000                                                                                                              4%                                                                           FY2013
                                                                                                                                      12,000
      42,000                                                                                                              3%                                                                           FY2014
                                                                                                                                      10,000                                                           FY2015
      40,000                                                                                                              2%
                                                                                                                                       8,000                                                           FY2016

                                                                                                                                GWh
      38,000                                                                                                              1%
GWh

      36,000                                                                                                              0%           6,000
      34,000                                                                                                              -1%          4,000
      32,000                                                                                                              -2%          2,000
      30,000                                                                                                              -3%
                                                                                                                                          0
               2002
                      2003
                             2004
                                    2005
                                           2006
                                                  2007
                                                           2008
                                                                  2009
                                                                         2010
                                                                                2011
                                                                                       2012
                                                                                              2013
                                                                                                     2014
                                                                                                            2015
                                                                                                                   2016                        Urban*   Rural*   Dairy        Tiwai       Industrial    Irrigation
                                                                                                                                                                                         (excluding
                                                         Financial Year                                                                                                                     Tiwai)

                                                                                                                                                                 * normalised for temperature

       15 MARKET DYNAMICS
NEW ZEALAND ALUMINIUM SMELTER (NZAS)
> 13% of New Zealand national demand
> Financial contract between NZAS and Meridian for 572MW through to 31
  Dec 2030                                                                                                      AUCKLAND   •
  > Annual right to terminate contract with 12 months notice from 1 Jan 2017               Mercury generation assets
  > Right to reduce from 572MW to 400MW with 12 months notice from 30 Apr 2017
> Trading conditions for the aluminium industry remain challenging despite
  recent price recovery
  > Aluminium prices have increased over last 12 months from post GFC lows to circa                             HAYWARDS

    US$1,750/t (up ~20%)
                                                                                                                               HVDC
> Further thermal rationalisation in the North Island highly likely in response
  to NZAS closure
  > Industry has demonstrated ability to quickly respond to changes in supply and demand
> Mercury best placed in the event of NZAS closure
  > 100% renewable North Island generation close to major North Island load centres            BENMORE

  > Physical transmission of South Island hydro generation to North Island load centres,
    as well as locational wholesale price effects, are second order considerations of a
    NZAS closure                                                                                         NZAS

 16 MARKET DYNAMICS
INTERPRETING MARKET DYNAMICS
                       DYNAMIC: DEMAND GROWTH AND THERMAL RATIONALISATION
                         FUNDAMENTALS: SUPPLY AND DEMAND BETTER BALANCED

EXPECTED MARKET RESPONSE                                     OBSERVED MARKET RESPONSE
   Increased wholesale price volatility                      Annual futures pricing flat
   Futures price increase                                    Customer churn remains at high levels
   Commercial and Industrial (C&I) pricing increase          Growing number of new entrant retailers
   Retail margin reduction in the absence of energy price
    increases                                                MITIGATING FACTORS
                                                              Benign wholesale prices due to generally above average
                                                               inflows into South Island catchments and short-term
                                                               management of thermal fuel positions
                                                              NZAS closure uncertainty

    17 MARKET DYNAMICS
WHOLESALE ELECTRICITY PRICES
> Wholesale spot prices and electricity futures prices not currently reflecting changes in supply and demand
  > Benign wholesale prices due to generally above average inflows into South Island catchments and short-term management of
    thermal fuel positions
  > Electricity futures prices reflecting lack of wholesale spot price volatility and NZAS closure uncertainty

                                      WHOLESALE ELECTRICITY PRICES
                                      $200+
    Wholesale / Futures Price (OTA)

                                                                                          Daily observed prices                                           Quarterly futures
                                      $180
                                      $160
                                      $140
                                      $120
                                      $100
                                       $80
                                       $60
                                       $40
                                       $20
                                        $0
                                             Jul-12

                                                               Jul-13

                                                                                 Jul-14

                                                                                                    Jul-15

                                                                                                                      Jul-16

                                                                                                                                        Jul-17

                                                                                                                                                             Jul-18

                                                                                                                                                                               Jul-19

                                                                                                                                                                                                 Jul-20
                                                      Jan-13

                                                                        Jan-14

                                                                                           Jan-15

                                                                                                             Jan-16

                                                                                                                               Jan-17

                                                                                                                                                 Jan-18

                                                                                                                                                                      Jan-19

                                                                                                                                                                                        Jan-20
 18 MARKET DYNAMICS
CUSTOMER
> Retail energy prices flat, reflecting strong competition
               > MBIE „Residential sales-based electricity cost‟ flat (+0.3%) for the four years to 31 March 20161
> Churn remains high relative to international benchmarks
               > Major centres (such as Auckland) observing slightly higher churn due to customer density
               > Historic incumbencies (such as Mercury in Auckland) showing churn advantage
               > Churn rates of niche brands (such as Globug and Bosco) higher reflecting behaviours of customer bases
   NATIONAL CHURN                                                 All Retailers (excl. Mercury)                                        AUCKLAND CHURN                                         All Retailers (excl. Mercury)
                                                                  Mercury (excl. Globug and Bosco)*                                                                                           Mercury (excl. Globug and Bosco)
               30%                                                Mercury*                                                             30%                                                    Mercury
               25%                                                                                                                     25%

                                                                                                                                                                                                                                                }
Annual Churn

                                                                                                                        Annual Churn
               20%                                                                                                                     20%                                                                                                          Total switches

               15%                                                                                                                     15%
               10%                                                                                                                     10%

               5%                                                                                                                      5%                                                                                                       }   Trader switches2

               0%                                                                                                                      0%

                                                                                                                                             Jul-11

                                                                                                                                                               Jul-12

                                                                                                                                                                                 Jul-13

                                                                                                                                                                                                   Jul-14

                                                                                                                                                                                                                     Jul-15

                                                                                                                                                                                                                                       Jul-16
                                                                                                                                                      Jan-12

                                                                                                                                                                        Jan-13

                                                                                                                                                                                          Jan-14

                                                                                                                                                                                                            Jan-15

                                                                                                                                                                                                                              Jan-16
                     Jul-11

                                       Jul-12

                                                         Jul-13

                                                                           Jul-14

                                                                                             Jul-15

                                                                                                               Jul-16
                              Jan-12

                                                Jan-13

                                                                  Jan-14

                                                                                    Jan-15

                                                                                                      Jan-16

               *Step up in Mercury trader churn from May 2015 partially related to consolidation of niche brands (i.e. switching between Mercury brands)

                                                                                                                           Source: Electricity Authority
                                                                                                                           1 Sales-based costs are after discount costs which reflect actual uptake of prompt
         19 MARKET DYNAMICS                                                                                                payment discounts, dual fuel discounts, and incentive discounts for attracting or
                                                                                                                           retaining a customer
                                                                                                                           2 A trader switch is where a customer changes retailer without changing house
20 BUSINESS OVERVIEW
HEALTH & SAFETY
> Zero harm is our well-being goal                                     TOTAL RECORDABLE INJURY FREQUENCY RATE
> FY2016 demonstrates continued improvement in                         (TRIFR)
                                                                       (per 200,000 hours; includes onsite employees and contractors)
  achieving our goal
  > no high severity incidents involving employees, contractors or     2.0
                                                                                                                         Low Severity Incidents
    visitors on Mercury controlled sites                               1.8
                                                                                                                         Moderate Severity Incidents
  > reduction of lost time (moderate severity) incidents from 5 to 3   1.6
                                                                                                                         High Severity Incidents
  > continued high engagement survey rating reflecting commitment to   1.4
    the health and safety of Mercury‟s people                          1.2
> One high severity incident in FY2017 to date                         1.0
  > A contractor was injured in an office stair fall                   0.8
                                                                       0.6
> Collaboration to improve industry-wide safety with
  initiatives such as the industry forum - StayLive                    0.4
                                                                       0.2
                                                                       0.0
                                                                                2012           2013            2014           2015            2016

                                                                                                          Financial Year

  21 BUSINESS OVERVIEW
CUSTOMER
> Rewarding loyalty leading to increased customer                                           CUSTOMERS HIGHLY SATISFIED12
                                                                                            Rolling 3 months                                                                 Mercury
  satisfaction and reduced churn
                                                                                                                                                                             Largest 4 Brands (excl. Mercury)
  > Free Power Day – a loyalty product which helps customers                                       70%
    appreciate the value of electricity
  > Airpoints – Mercury has partnered with Air New Zealand to                                      65%

                                                                         Percentage of Customers
    enable customers to earn Airpoints dollars
  > 41% of Mercury2 residential customers on fixed-price contracts                                 60%
  > Through FY2016 61% of Mercury2 customers responded as
    highly satisfied in the Company‟s regular survey – the highest of                              55%
    the five large retailers
> On-going focus on increasing depth of customer                                                   50%
  relationships through innovative propositions
  > The acquisition of in-house solar capability through the purchase                              45%
    of What Power Crisis (WPC) adds to innovative customer
    solutions available – GLOBUG, Good Energy Monitor (GEM) and
    fixed-price contracts                                                                          40%

                                                                                                                                                         Jul-15

                                                                                                                                                                                                               Jul-16
                                                                                                                  Nov-14

                                                                                                                           Jan-15

                                                                                                                                                                           Nov-15

                                                                                                                                                                                    Jan-16
                                                                                                         Sep-14

                                                                                                                                                                  Sep-15

                                                                                                                                                                                                                        Sep-16
                                                                                                                                    Mar-15

                                                                                                                                                May-15

                                                                                                                                                                                             Mar-16

                                                                                                                                                                                                      May-16
  > Enabling customers to utilise electricity as a transport fuel – EV
    fuel package, customer discounts for e-bikes and partnering with
    Plugshare to establish the country‟s „Electric Highway‟

                                                                                                                                      1 Based      on Mercury‟s monthly survey
                                                                                                                                      2      Mercury (excluding Bosco and GLOBUG)
 22 BUSINESS OVERVIEW
ELECTRICITY GENERATION
> 100% renewable generation with two complementary low-                                   ANNUAL GENERATION1                                                                          Hydro
                                                                                       5,000                                                                                          Geothermal
  cost fuel sources                                                                                                                 Long-term hydro average
  > High up-front build cost, low operating cost                                       4,000

                                                                                 GWh
  > Central North Island close to major load centres and not dependent                 3,000
    on HVDC                                                                            2,000
  > Generation Weighted Average Price (GWAP) favourable to peers                       1,000
    reflecting the flexibility and location of assets
                                                                                                0
> Flexible hydro generation (1052MW)                                                                          2012                2013            2014                    2015                    2016
                                                                                                                                             Financial Year
  > Largest series of peaking stations in North Island
  > Seasonal inflow patterns correlated with demand and inversely                              MONTHLY GWAP                                                                             Peer GWAP
    correlated to those of the major South Island hydro catchments2                            200                                                                                      MRP GWAP
  > Built 1929 - 1970                                                                          150

                                                                                       $/MWh
> Base-load geothermal generation                                                              100
  > Only renewable not dependent on weather
                                                                                               50
  > Built 1997 - 2013
                                                                                                 0

                                                                                                     Jul 11

                                                                                                                         Jul 12

                                                                                                                                               Jul 13

                                                                                                                                                                 Jul 14

                                                                                                                                                                                         Jul 15

                                                                                                                                                                                                              Jul 16
                                                                                                                Jan 12

                                                                                                                                    Jan 13

                                                                                                                                                        Jan 14

                                                                                                                                                                             Jan 15

                                                                                                                                                                                                     Jan 16
                                                              1A   long term time-series of hydro generation can be found in the appendix (pg. 35)
                                                              2 Further  detail can be found in the appendix (pg. 36)
 23 BUSINESS OVERVIEW
PORTFOLIO MANAGEMENT
> Average net long (generation) position reflecting integrated portfolio and closure of Southdown
   > Portfolio management is subject to robust risk management framework
   > Movement in net position year-on-year due to hydrology, plant availability and value of sales

       ANNUAL NET POSITION                                                                 FY2016 ANNUAL NET POSITION
               Net Position              Whakamaru Average Spot Price
       1,000                                                            90                 9,000
                                                                                                       Gas-Fired
        800                                                             80                 8,000
                                                                                                        CFD Buy
                                                                                                                          Other CFD Sell
        600                                                             70                 7,000
                                                                                                    Additional Hydro    'End User' CFD Sell
        400                                                                                6,000
                                                                        60
        200

                                                                             $/MWh

                                                                                     GWh
 GWh

                                                                        50                 5,000                           Commerical
          0                                                                                          Minimum Hydro
                                                                        40                 4,000                              Losses
       -200
                                                                        30                 3,000
       -400                                                                                                                 Residential
       -600                                                             20                 2,000      Geothermal

       -800                                                             10                 1,000                           Norske Skog

   -1,000                                                               0                            CFD Buy - VAS        CFD Sell - VAS
                                                                                              0
                  2011        2012    2013     2014    2015     2016
                                                                                                         Buy                   Sell
                                     Financial year

 24 BUSINESS OVERVIEW
METRIX
> Metrix 2nd largest NZ meter data and services provider with 436k meters owned or under management1
  > Market consolidated and initial meter upgrade largely complete or contracted
> Smart meter deployment has enabled customer-led product development
  > Broadly utilised by retailers with products such as Mercury‟s Free Power Days, GEM and GLOBUG

  NATIONAL MARKET SHARE                                               GREATER AUCKLAND MARKET SHARE2
  September 2016                                                      September 2016

            2%
          3%
                   8%                        Vector
        3%
                                             Metrix
                                                                               32%
           9%                                TrustPower                                                        Metrix Owned
                                             Contact Energy                                                    Metrix Managed
                              56%
                                             Smartco Ltd                                                       Other
                                                                                            62%
            19%                              Counties Power                        6%
                                             Other

                                                                                              1   396k meters are owned by Metrix
                                                                                              2   Includes Vector and Counties networks
  25 BUSINESS OVERVIEW
26 FINANCIAL OVERVIEW
FINANCIAL TRACK RECORD

      ENERGY MARGIN                                             EBITDAF
      700                                                       700
      600                                                       600
      500                                                       500
      400                                                       400

                                                           $m
 $m

      300                                                       300
      200                                                       200
      100                                                       100
        0                                                         0
            FY2012   FY2013   FY2014    FY2015    FY2016               FY2012    FY2013    FY2014   FY2015   FY2016

      UNDERLYING EARNINGS                                        FREE CASH FLOW
                                                                 700
      700
      600                                                        600
      500                                                        500
      400                                                        400

                                                            $m
 $m

      300                                                        300
      200                                                        200
      100                                                        100
        0                                                          0
            FY2012   FY2013   FY2014   FY2015    FY2016                 FY2012    FY2013   FY2014   FY2015   FY2016

 27 FINANCIAL OVERVIEW
DIVIDENDS
> Mercury‟s dividend policy is to make distributions with
                                                                                         DIVIDEND           Interim    Final   Specials   Ordinary guidance
  a pay-out ratio of 70% to 85% of Free Cash Flow on
  average through time1                                                                  25

  > FY2017 ordinary dividend guidance is an increase of 2% to
    14.6cps, the sixth year of consecutive ordinary dividend growth
                                                                                         20
> Supplementary dividend paid to non-residents to

                                                                       Cents per share
  reduce economic impact of Non-Resident Withholding
                                                                                         15
  Taxes
> Focus remains on appropriate capital management
                                                                                         10
  > FY2016 non-imputed special dividend of 4.0cps increased total
    distributions to 100% of Free Cash Flow and distributed
    proceeds from land sales within FY2015 and FY2016                                    5

                                                                                         0
                                                                                              2012   2013       2014           2015       2016      2017F
                                                                                                              Financial Year

                                                                1With consideration given to working capital requirements, maintenance of a BBB+
                                                                credit rating, economic market and hydrological risks, and estimated financial
  28 FINANCIAL OVERVIEW                                         performance
CAPITAL EXPENDITURE
 > Stay-in-business capital expenditure expect to be circa $80m per annum over the medium term
 > FY2017 guidance of $125m for stay-in-business and for minimal growth capital expenditure
   > Stay-in-business includes the drilling of four wells as part of a co-ordinated drilling campaign across multiple reservoirs (circa $55m) and
     the continuation of the company‟s hydro refurbishment programme
   > Stay-in-business consistent with medium-term guidance (FY2013 to FY2017f average circa $80m)

       CAPITAL EXPENDITURE                                                                                           New investment
       400    Growth: Domestic geothermal generation                                                                 Stay-in-business
       350                                                                                                           Normalised stay-in-business
       300
       250                                                             Below normalised stay-in-business guidance
                 288                                                   due to timing of geothermal makeup wells
  $m

       200
       150                                183                                 Growth: Metering
       100                                                                            31
                                                              33                                               13
        50                                                                                                                        125
                  74                      69                  60                      79                       59
         0
                 2012                    2013                2014                    2015                     2016               2017F
                                                                    Financial Year

 29 FINANCIAL OVERVIEW
OPERATING EXPENSES
 > FY2017 operating costs guided to be comparable with FY2016 levels
 > Operating expenditure below 2010 levels, despite 2 new geothermal stations added

       OPERATING EXPENDITURE
                                                                                         One-off costs
       350
                                                                                         Operating expenditure
       300
                                 69
       250
  $m

       200

       150
                259              245
       100                                       216                     217      217

       50

         0
                2012            2013             2014                    2015     2016            2017
                                                        Financial Year

 30 FINANCIAL OVERVIEW
FUNDING PROFILE
      DEBT MATURITIES AS AT 31 OCTOBER
       Domestic Wholesale Bonds   US Private Placement   Capital Bond      Drawn Bank Facilities    Undrawn Bank Facilities
      350
      300
      250
 $m

      200

      150
      100
       50

       -
               2017       2018     2019        2020      2021       2022        2023         2024      2025         2026      2027   2045

                                                                   Financial Year

 > The average debt maturity profile for committed facilities was 9.2 years at 31 October 2016
 > Interest costs elevated due to interest rate hedges put in place in 2008 during the company‟s domestic geothermal
   investment programme. These hedges roll off progressively from the end of FY2018 with an estimated $20-30m
   annual cash flow benefit in FY2019

  31 FINANCIAL OVERVIEW
CAPITAL STRUCTURE
 > bbb stand alone rating is key reference point for dividend policy and a sustainable capital structure
   > S&P re-affirmed Mercury‟s credit rating of BBB+/stable on 23 December 2015
   > One-notch upgrade given majority Crown ownership
   > Key ratio for stand alone S&P credit rating bbb requires Debt / EBITDAF between 2.0x and 2.8x
 > Capital management continues to be reviewed
   > Debt/EBITDAF 2.0x at 30 June 2016
   > Gearing will be maintained reflecting majority Government ownership

                                30 June 2016         30 June 2015          30 June 2014         30 June 2013             30 June 2012
 Net debt ($m)                          1,068                1,082                1,031                   1,028                     1,116
 Gearing ratio (%)                        24.4                24.5                 24.3                     24.4                     27.0
 Debt/EBITDAF (x)                         2.01                 2.01                 2.1                      2.7                       2.6

                                                                                          1   Adjusted for S&P treatment of subordinated debt

  32 FINANCIAL OVERVIEW
33 APPENDIX
OWNERSHIP
                                                                     MERCURY SHARE REGISTER1
> Listed on NZX and ASX in May 2013
> Currently more than 90,000 shareholders (widest held
  New Zealand register)
                                                                              4%2%
> Government majority ownership
  > Public Finance Act and Company‟s constitution require at least     19%                                 Government
    51% Crown ownership
                                                                                                           New Zealand Retail
  > No other person may hold more than 10% of shares
                                                                                           51%             International Institutions
> Eight independent Directors                                                                              New Zealand Institutions
> No direct government representation on Board                                                             Treasury Stock
                                                                        24%

                                                                                       1   Data as at October 2016

 34 APPENDIX
WAIKATO HYDRO SYSTEM
 > A cascade river system with nine power stations along the Waikato River (New Zealand‟s longest river)
 > Supports average annual generation of 4,000GWh - since 1999 ranged from 3,300GWh to 4,800GWh
 > Maximum storage capacity of 580GWh in Lake Taupo (New Zealand‟s largest lake by area); minimum flow
   requirement 7.5GWh per day
      WAIKATO HYDRO SYSTEM GENERATION

      6,000
                                                                                                                                                          Mercury Ownership
      5,000
                                                                                                                                                                                                                                  Long-term hydro average
      4,000
GWh

      3,000

      2,000

      1,000

         0
              1981
                     1982
                            1983
                                   1984
                                          1985
                                                 1986
                                                        1987
                                                               1988
                                                                      1989
                                                                             1990
                                                                                    1991
                                                                                           1992
                                                                                                  1993
                                                                                                         1994
                                                                                                                1995
                                                                                                                       1996
                                                                                                                              1997
                                                                                                                                     1998
                                                                                                                                            1999
                                                                                                                                                   2000
                                                                                                                                                           2001
                                                                                                                                                                  2002
                                                                                                                                                                         2003
                                                                                                                                                                                2004
                                                                                                                                                                                       2005
                                                                                                                                                                                              2006
                                                                                                                                                                                                     2007
                                                                                                                                                                                                            2008
                                                                                                                                                                                                                   2009
                                                                                                                                                                                                                          2010
                                                                                                                                                                                                                                 2011
                                                                                                                                                                                                                                        2012
                                                                                                                                                                                                                                               2013
                                                                                                                                                                                                                                                      2014
                                                                                                                                                                                                                                                             2015
                                                                                                                                                                                                                                                                    2016
                                                                                                                                                                                                                                                                           2017
                                                                                                                                 Financial Year

       35 APPENDIX
INFLOW DISTRIBUTIONS
                > Positive correlation of North Island hydro inflows and sales

AVERAGE SOUTH ISLAND INFLOWS VS. DEMAND                                                                          AVERAGE NORTH ISLAND INFLOWS VS. DEMAND
                     Average Inflows in SI (LHS)         Average Market Demand (RHS)                                                    Average Inflows in NI (LHS)          Average Market Demand (RHS)
                80                                                                            120                                30                                                                             120
                70
                                                                                              110                                25                                                                             110
                60
Inflows (GWh)

                                                                                                    Load (GWh)

                                                                                                                 Inflows (GWh)
                                                                                              100                                20                                                                             100

                                                                                                                                                                                                                      Load (GWh)
                50
                40                                                                            90                                 15                                                                             90
                30
                                                                                              80                                 10                                                                             80
                20
                                                                                              70                                  5                                                                             70
                10
                 0                                                                            60                                  0                                                                             60
                           Feb

                                 Mar

                                             May

                                                                Aug

                                                                      Sep
                                       Apr
                     Jan

                                                   Jun

                                                                            Oct

                                                                                  Nov

                                                                                        Dec
                                                          Jul

                                                                                                                                                  Mar

                                                                                                                                                              May

                                                                                                                                                                                  Aug

                                                                                                                                                                                        Sep
                                                                                                                                            Feb

                                                                                                                                                        Apr

                                                                                                                                                                                              Oct

                                                                                                                                                                                                    Nov

                                                                                                                                                                                                          Dec
                                                                                                                                      Jan

                                                                                                                                                                      Jun

                                                                                                                                                                            Jul
                     36 APPENDIX
REFERENCE MATERIAL
Mercury Investor Centre                              www.mercury.co.nz/Investor-Centre
INDUSTRY REFERENCES

Electricity Authority website                        www.ea.govt.nz

System Operator website                              www.systemoperator.co.nz

Wholesale electricity spot prices                    www.em6live.co.nz

Electricity futures prices                           www.asx.com.au/products/energy-derivatives/new-zealand-electricity.htm
INDUSTRY PUBLICATIONS

Ministry of Business, Innovation and                 www.mbie.govt.nz/info-services/sectors-industries/energy/energy-data-
Employment - Energy in New Zealand                   modelling/publications/energy-in-new-zealand

Electricity Authority - Electricity in New Zealand   www.ea.govt.nz/about-us/media-and-publications/electricity-nz

   37 APPENDIX
You can also read