Investor Presentation Highlights October 2019 - Dr Bernd van Linder Chief Executive Officer Mr Darren Clarke Chief Financial Officer - Commercial ...

Page created by Anita Reed
 
CONTINUE READING
Investor Presentation Highlights October 2019 - Dr Bernd van Linder Chief Executive Officer Mr Darren Clarke Chief Financial Officer - Commercial ...
Dr Bernd van Linder
Investor Presentation Highlights   Chief Executive Officer
October 2019                       Mr Darren Clarke
                                   Chief Financial Officer   0
Investor Presentation Highlights October 2019 - Dr Bernd van Linder Chief Executive Officer Mr Darren Clarke Chief Financial Officer - Commercial ...
Disclaimer
In accessing the information in this document, you agree to be bound by the following terms and conditions.

The information is provided to you solely for your information and may not be retransmitted, further distributed to any other person or published, in whole or in part, by any
medium or in any form for any purpose. The opinions presented herein are based on general information gathered at the time of writing and are subject to change without notice.
The Bank relies on information obtained from sources believed to be reliable but does not guarantee its accuracy or completeness. The financial information contained within this
presentation is, unless otherwise specified, taken from the Bank’s annual audited consolidated financial statements.

This document contains data compilations, writings and information that are proprietary and protected by copyright and other intellectual property laws, and may not be
redistributed or otherwise transmitted by you to any other person for any purpose.

This document does not constitute an offer, agreement, or a solicitation of an offer or an agreement, to enter into any transaction (including for the provision of any services). No
assurance is given that any such transaction can or will be arranged or agreed. Before entering into any transaction, you should consider the suitability of the transaction to your
particular circumstances and independently review (with your professional advisers as necessary) the specific financial risks as well as the legal, regulatory, credit, tax and
accounting consequences.

The information contained herein has not been independently verified and no responsibility is accepted nor a representation, undertaking or warranty is made or given, expressly
or impliedly, by CBD or any of its officers or advisers as to the accuracy, reliability or completeness of the information or as to the reasonableness of any assumptions on which any
of the same is based or the use of any of the same. Accordingly, no such person will be liable for any direct, indirect or consequential loss or damage suggested by any person
resulting from the use of the information or for any opinions expressed by any such person, or any errors, omissions or misstatements made by any of them. The statements
contained herein are made as at the date of this presentation, unless another time is specified in relation to them, and delivery of this presentation shall not give rise to any
implication that there has been no change in the information set forth in this document since that date. Save as otherwise expressly agreed, none of the above persons should be
treated as being under any obligation to update or correct any inaccuracy contained herein or be otherwise liable to you or any other person in respect of any such information.
Market data used in the information not attributed to a specific source are estimates of the Bank and have not been independently verified. No reliance may be placed for any
purpose whatsoever on the information contained in this document or on its completeness and accuracy.

Nothing contained in this presentation shall be deemed to be a forecast, projection or estimate of CBD’s future financial performance. This presentation may contain statements,
statistics and projections that include words such as "intends", "expects", "anticipates", "estimates" and words of similar import. All statements included in this presentation other
than statements of historical information, including, without limitation, those regarding financial position, business strategy, plans and objectives of management for future
operations (including development plans and objectives) are forward-looking statements. By their nature, such statements involve risk and uncertainty because they relate to
events and depend on circumstances that will occur in the future. No assurance can be given that such expectations will prove to be correct and actual results may differ materially
from those projected because such statements are based on assumptions as to future economic performance and are not statements of fact. CBD expressly disclaims to the fullest
extent permitted by law any obligation or undertaking to disseminate any updates to these forecasts, projections or estimates to reflect events or circumstances after the date
hereof, nor is there any assurance that the policies, strategies or approaches discussed herein will not change. Nothing in the foregoing is intended to or shall exclude any liability
for, or remedy in respect of, fraudulent misrepresentation.

For any inquiries, please contact investor relations team
investor.relations@cbd.ae
                                                                                                                                                                                      1
Investor Presentation Highlights October 2019 - Dr Bernd van Linder Chief Executive Officer Mr Darren Clarke Chief Financial Officer - Commercial ...
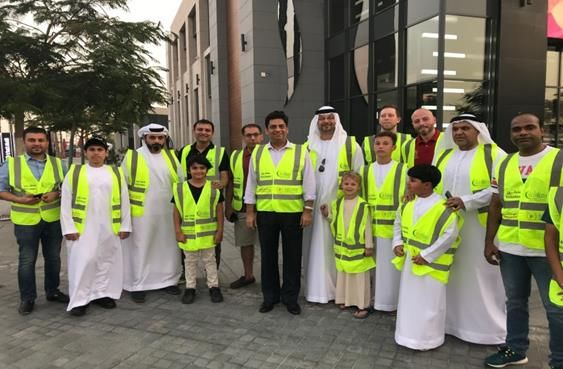
Commercial Bank of Dubai Q3 Overview

           Net Profit                          Gross Lending
                                                                                        Employees
       AED 1,063m                                 3.5%                                  ~1500
        26% from 9M 18                     UAE Loan Market Share

                                              Corporate Social
                                               Responsibility                           Credit Rating
          17 Branches                     Sponsored Jebel Ali
                                                                                       A- (Fitch)
                                          horse race for season
            153                           2018/2019
                                                                                     Baa1 (Moody’s)
           ATM/CDM                        Participated in Special
                                          Olympics World Games

            Best Call Centre, Best Cash    Best Mobile Banking App         Best Digital Bank
            Management, Best Digital       Global Finance - Best Digital   Business Live Middle East –
 Awards     Transformation Services        Bank Awards 2019                New Age Banking Awards
            – Banker ME Product Awards     (September 2019)                (July 2019)
            (October 2019)
                                                                                                         2
Investor Presentation Highlights October 2019 - Dr Bernd van Linder Chief Executive Officer Mr Darren Clarke Chief Financial Officer - Commercial ...
Earnings Snapshot – positive momentum in underlying performance reflected in key ratios
                                                                                               (AED m)

                                                                        Change            Change (%)
                                                     9M 19       9M 19 - 9M 18      9M 19 - 9M 18

Net profit                                         1,063.1                220.1               26.1%

Return on equity (RoE)                              15.04%               242 bp               19.2%

Return on assets (RoA)                               1.82%                25 bp               16.0%

Interest margin                                      2.53%               (18) bp              (6.8%)

Cost to income ratio                                29.11%             (233) bp               (7.4%)

Impairment charge to gross loans                     1.17%               (19) bp             (13.8%)

Capital adequacy ratio                              14.75%               (12) bp              (0.8%)

                                                                                                   3
Investor Presentation Highlights October 2019 - Dr Bernd van Linder Chief Executive Officer Mr Darren Clarke Chief Financial Officer - Commercial ...
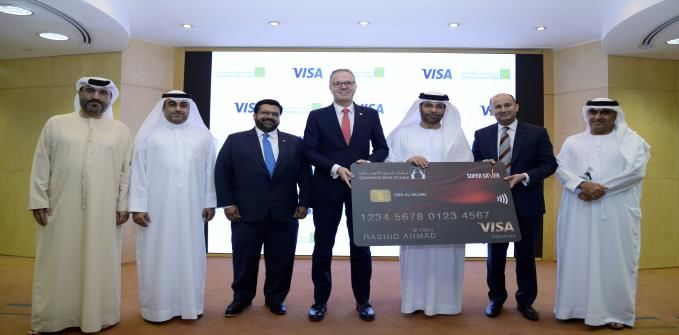
Financial Performance Snapshot – 9M 2019

                            Revenues                Net Profit          Return on Equity
   Shareholder
  Value Creation       AED 2,242m              AED 1,063m                  15.04%
                         11% from 9M 18         26% from 9M 18         242 bps from 9M 18

                              Assets           Customer Deposits           Gross Loans
  Focus on Growth       AED 82.5bn              AED 59.1bn               AED 59.9bn
                         14% from 9M 18         17% from 9M 18          13% from 9M 18

                     Capital Adequacy Ratio   Non-performing Loan       Return on Assets
  Strong Metrics          14.75%                    5.53%                   1.82%
                         12 bps from 9M 18      80 bps from 9M 18       25 bps from 9M 18

                                                                       Non Funded Income/
                        Operating Profit      Cost to Income Ratio
Improved Operating                                                     Operating Expenses
   Performance            1,589m                  29.11%                  113.04%
                          15% from 9M 18        233 bps from 9M 18
                                                                         1,995 bps from 9M 18

                                                                                                 4
Investor Presentation Highlights October 2019 - Dr Bernd van Linder Chief Executive Officer Mr Darren Clarke Chief Financial Officer - Commercial ...
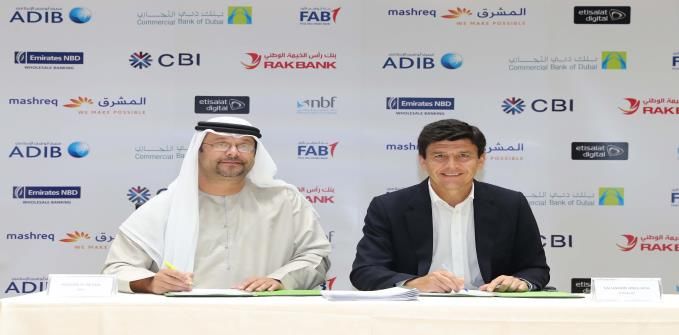
Performance Achievements in Q3 2019

    • Continued uplift in underlying business performance across all divisions

    • Loan growth in target segments above system; market share now at 3.5%

    • Increased non-funded income showing deepening relationships with our core
      customer base

    • Continuing digitization of primary customer facing processes

    • Improved credit risk management and recoveries resulting in lower trending
      retail provisions

    • Disciplined expense management

    • Ongoing optimization of our physical network

                                                                                   5
Investor Presentation Highlights October 2019 - Dr Bernd van Linder Chief Executive Officer Mr Darren Clarke Chief Financial Officer - Commercial ...
Strategic Pillars – outperformance through disciplined execution

              Achieve
      A
          Financial Results
                                                    Ongoing:

                                                    o Enhance customer experience
          Become Employer
      B                                             o Build on core strengths
            of Choice
                                                    o Focus on performance culture

                                                    o Balance sheet optimization
             Customer
      C                                             o Streamline and automate processes
               Focus
                                                    o Improve efficiencies

               Default
     D
               Digital

                                                                                          6
Investor Presentation Highlights October 2019 - Dr Bernd van Linder Chief Executive Officer Mr Darren Clarke Chief Financial Officer - Commercial ...
Strategic Execution in Q3 2019
                        o Net profit up by 26% compared to 9M 18
      Achieve           o Return on equity improved to 15.0% for Q3 YTD 2019
  Financial Results
                        o Cost to income reduced to 29.1% from 31.4%

                          o Embedding a high performance culture across the organization
  Become Employer         o Showcased the Employee Innovation Challenge
      of Choice
                          o Developing and retaining UAE national talent

                               o Rolled out enhanced CRM tool for Wholesale customers
          Customer             o Launched co-branded CBD Smiles Credit Card
            Focus
                               o Enhanced remittance capabilities

                                  o CBD Labs leading bank wide innovation
              Default
                                  o Digital customer onboarding
              Digital
                                  o Credit card digital process progression
                                                                                           7
Investor Presentation Highlights October 2019 - Dr Bernd van Linder Chief Executive Officer Mr Darren Clarke Chief Financial Officer - Commercial ...
9M 2019 Net Profit Performance – sustained robust business performance
                                                                                                                                                     (AED m)

  Foreign exchange and fee          NII increased by 77m due       Other income was higher      Other operating                 Net credit impairment
  income increased by 27%           to an increase in average      by 4m mostly from the        expenses were lower by          increased by 8m as a
  or 142m in 9M 19 across           loans and interest             21m gain on sale of the      1% or 2m as a result of         result of provision
  processing fees, fund             earning assets partially       Umm Suqeim building.         disciplined cost                increase across the
  management fees, loans
                                    offset by a drop in net                                     management practices            Commercial and Financial
  and advances, credit
  cards and trade finance           interest margins                                            and overall increased           Institutions segments.
  activities.                                                                                   operational efficiency.

                                                                                             +26.1%
  Net profit for the period
  increased by 220m (26.1%)                                                                                                                       1,063
  compared to 9M 2018                                                                    1
                                                                              4                       2        22         (8)          (20)
  Increase in net profit is              843                      77
  attributable to:
                                                     142
   • increase in foreign exchange
     and fee income;
   • increase in net interest
     income, other income, gain
     from Investments; and
   • decrease in other
     impairment charge.

                                        9M 18      Foreign         Net       Other      Gain      Other      Other     Net     Staff              9M 19
                                                  Exchange      Interest   Income        from    Operating Impairment Credit Expenses
                                                   and Fee      Income               Investments Expenses Charge Impairment
                                                   Income         (NII)
                                                                                                                                                           8
Investor Presentation Highlights October 2019 - Dr Bernd van Linder Chief Executive Officer Mr Darren Clarke Chief Financial Officer - Commercial ...
Underlying Business Growth – continued business growth                                                                                               (AED m)

                                      Revenue                                                                       Net profit
  OOI      NII

                                                                                                   +2%
                      +5%                                                                                                1,162
                              2,642          2,725                              1,066
                                                                +11%                       1,003          1,002                            +26%
             2,462
 2,352                                        813
                               822    +3%
              737                            (30%)                      2,242                                     +16%                            1,063
  712                         (31%)                    2,018
 (30%)       (30%)                                                       738
                                                        590                                                                         843
                                                                        (33%)
                                                       (29%)

             1,725            1,821          1,911
 1,640
             (70%)            (69%)          (70%)     1,427            1,504
 (70%)
                                                       (71%)            (67%)

 2015        2016             2017           2018      9M 18            9M 19   2015       2016           2017           2018     9M 18           9M 19

                                       Assets                                                                       Net loans

                                            +9%                        82,539
                                                                                                                         +10%                     56,373
                                                     74,102
                                        70,414                                                                                    50,945
                     64,080                                    +11%                                                      47,276
  57,864                                                                                           41,963                                  +11%
                                                                                  39,021

   2015              2016                   2017     2018              9M 19       2015            2016                  2017     2018            9M 19

                                                                                                                                                           9
Profitability and Returns – improved returns on delivery of the bank strategy                                                                                                                          (AED m)

                                             Expenses                                                                                       Revenue and expense JAWS

                                                                                                                        Revenue
                                               -5%                                                                      Expenses
                    871                901                                                                                                                                                       2,990
  859                                                   858                     +3%                                                                                         2,725
                                                                                                                                                           2,642
                                                                                                                 2,352             2,462
                                                                       634                653

                                                                                                                                                                                                             +8.3%
                                                                                                        (8.8%)                                                     +3.8%              +7.8%
                                                                                                                                           +3.3%

                                                                                                                 859                871                    901                  858                  870

  2015              2016            2017             2018            9M 18            9M 19
                                                                                                                 2015               2016                   2017                2018               9M 19
                                                                                                                                                                                               (Annualized)

                             RWA and Return on Equity                                                                                        Other Operating Income
    Credit Risk            Operational Risk          Market Risk            Return on Equity                        Fees and Commission            FX and Investment       Others

                                                                                                                                           +5%
                                               +9%                                71,681
                                                                                                                                                    822             813
                                                         63,603                                                                    737                                                        +25%
                               60,728                                                                              712                                      -1%
    55,187                                                                         15.0%
                                                          13.5%                                                                                                                                        738
     12.4%
                                11.7%                                                                                                               565                                590
                                                                                                                                                                    578
                                                                                  66,305                           498             495
                                55,412                   58,284                                                                                                                                        534
    50,669
                                                                                                                                                                                       433

                                                                                                                   178             204              211             165
                                                                                                                                                                                       123             165
                  4,409                      4,660                  4,893                       4,893               36              38               46              70
        109                      656                          426                   483                                                                                                 35             39
     2016                       2017                      2018                   9M 2019                           2015            2016             2017            2018              9M 18           9M 19

                                                                                                                                                                                                              10
Strategic Financial KPI’s – underlying performance continues to drive improved results
                    Return on Equity (ROE)                                             Cost to Income Ratio

                                                     +19%
            +18%
                             15.0%                          15.0%              -10%
                                                                    34.1%
            13.5%
                                             12.6%                             31.5%                                  -7%
   11.7%             +12%
                                                                                               29.1%          31.4%
                                                                                                                             29.1%
                                                                                        -8%

   2017     2018            9M 2019          9M 18          9M 19   2017       2018           9M 2019         9M 18          9M 19

                    Return on Assets (ROA)                                  Other Operating Income as % of Expenses

                                                     +16%
                                                                                                                      +21%
            +18%             1.8%                           1.8%
                                                                               +15%           113.0%                         113.0%
            1.6%                             1.6%
   1.4%
                     +16%                                                              +19%
                                                                               94.8%                          93.1%
                                                                    91.2%

   2017     2018            9M 2019          9M 18          9M 19   2017       2018           9M 2019         9M 18          9M 19

                                                                                                                                      11
Asset Quality and Impairments – improving asset quality, lower NPL with increased coverage
                                                                                                                                                                                     (AED m)

                                          Cost of Risk                                                         Impairment Charges  and Recoveries
                                                                                                                          Cost of Risk
                                                                                              Impairment charges              Recoveries             Coverage (%)

                                                                                                           102%
                                                                                        92%                                                                                       90%
                                  1.37%                                                                                           78%
      1.26%                                                                                                                                            78%
                                                          1.26%
                                                                             1.17%

                                                                                                                                 852
                                                                                                           704                                        752
                                                                                       514                                                                                  560

                                                                                                    87                  115                   112
                                                                                                                                                                   48                   34

      2016                        2017                    2018               9M 19           2015                2016                  2017                 2018               9M 19

                                          NPL Ratio                                                        Expected Credit Provisions – Segment
    NPL             NPL ratio (%)            Provisions to gross loans (%)                    NPL           Provisions             Coverage (%)
                                                                                             115.0%
                                             4,302

                                              8.7%                3,307        3,278                                                                                         93.7%
                          3,101
    2,895                                                                                                                                                          1,813
                          6.9%                                                                                                                                                 1,699
  6.9%                                                            6.2%
                                                                               5.9%                                                   75.4%
                          7.0%
  6.4%                                        6.6%                                                                            1,123
                                                                  5.8%         5.5%                                                            847

                                                                                             343         394

    2015                  2016               2017 *               2018        9M 19          Personal Banking                    Commercial                             Corporate

   * IFRS 9 transition.
                                                                                                                                                                                         12
Balance Sheet and Capital Strength – strong balance sheet and capital ratio supporting business growth
                             Capital Adequacy Ratio (CAR)                                                                                    CommonCost
                                                                                                                                                    Equity Tier 1 (CET1)
                                                                                                                                                        of Risk
         CAR           Regulatory limit (Minimum)                                                                      CET1          Regulatory limit (Minimum)

                                                +1%                                                                                                                                     -22 bp
                                                                               -21 bp
                                                                                                                  13.39%               13.41%             13.85%              13.81%             13.59%
    14.51%               14.56%               15.00%                14.96%               14.75%

                                                                                                                                       8.88%              9.50%                9.50%             9.50%
                                              13.00%                13.00%               13.00%                   8.25%
    11.75%               12.38%

    2017*                 2018                Mar 19                Jun 19               Sep 19                    2017                    2018           Mar 19              Jun 19             Sep 19
* 2017 retained earnings have been updated by 397m for IFRS9 opening adjustment to be 2.6b instead of 3.0b

                          Eligible Liquid Assets Ratio (ELAR)                                                                                Loans to Deposits and ASRR
         ELAR           Regulatory limit (Minimum)                                                                     Loans to Deposits           ASRR            Regulatory limit (Maximum)

                                               +2.0%                                                                                                  -0.8%
                                                                               -50 bp                        100.00%

                         16.23%                                     15.69%               15.19%
    14.38%                                    14.20%

10.00%                                                                                                         97.65%              95.82% 89.42%      94.85% 87.83%       99.23%             95.44% 87.50%
                                                                                                                        88.59%                                                     90.02%

     2017                 2018                Mar 19                Jun 19               Sep 19                    2017                    2018           Mar 19              Jun 19             Sep 19

                                                                                                                                                                                                          13
Funding and Liquidity – diversified and stable funding supporting franchise loan growth                                                                                                                                       (AED m)

                                               Customer Deposits                                                                                                      Other Funding Sources
          TD        CASA                                                                                                               Acceptances and Others           Due to Banks > 1year                        Equity
                                                                                                                                       Due to Banks < 1year             Notes and Medium Term Borrowing
                                                                    +6%
                                                                                                                      59,066
                                                                            54,614               55,264
                                                 53,165                                                                                                                           4%
                         48,411                                                                                                                                                                           23,167             23,473
   43,774                                                                                                                                              22,003                            21,549
                                                                                                                                      20,306                            20,937
                                                                                                                      35,521                                                                              6,573              6,791
                                                                            31,184               32,846                                                6,053
                                                 32,484                                                                               3,986                              6,345           6,992
                         29,226                                                                                                                                                                                                        927
   24,576                                                                                                                                      1,560            780                               873              1,882
                                                                                                                                                                                 1,480                    2,600              2,608
                                                                                                                                      6,081            6,090                     1,283            2,016                      3,230
                                                                                                                                                                         2,610           2,610            2,611

                                                 20,681                     23,430               22,418               23,545                                                                                                 9,917
   19,198                19,185                                                                                                       8,680            9,081             9,219           9,058            9,501

     2016                  2017                    2018                      Q1 19                Q2 19                Q3 19          2016             2017              2018            Q1 19            Q2 19              Q3 19

                                                Loans to Deposits                                                                                                     Deposit Segmentation
           Net Loans                     Customer Deposits                         Net Loans to Deposit Ratio %                        Government          Individual        Corporate

                                                                                                    99.2                                                                         +8%
      95.9                  97.7                    95.8                                                                                                                                                                   59,066
                                                                               94.8                                     95.4                                                             54,614           55,264
                                                                                                                                                                        53,165
                                                                                                                                                       48,411                                                                14,644
                                                                                                                                      43,774                                             13,069           12,771
                                                                                                                                                                        13,744
                                                                                                                                                       11,852
                                                                                                                             59,066

                                                                                                                                      10,815
                                                                                                                    56,373
                                                                                                           55,264
                                                                                      54,614

                                                                                               54,841

                                                                                                                                                                                                                             14,548
                                                           53,165

                                                                          51,801

                                                                                                                                                                                                          14,096
                                               50,945

                                                                                                                                                                                         14,347
                                48,411
                       47,276

                                                                                                                                                                        13,866
           43,774

                                                                                                                                                       11,649
 41,963

                                                                                                                                      10,998

                                                                                                                                                       24,910           25,556           27,198           28,397             29,874
                                                                                                                                      21,961

     2016                  2017                    2018                      Q1 19                Q2 19                Q3 19          2016             2017              2018            Q1 19            Q2 19              Q3 19

                                                                                                                                                                                                                                      14
Balance Sheet Analysis – strong business growth and diversified investment portfolio                                                                                                                                      (AED m)

                                           Assets Mix                                                                                               Assets and Loans
                                                                                                              Loans and Advances                Total Assets
                        6%      3%         12%
                                                                                                                                                                    +7%
                8%                               3%

                                                                    Cash and balances with CB
                                                                    Due from banks
                             AED 83 billion                         Net loans and advances

                                                                                                                                                                                                                            82,539
                                                                                                                                                                                                        78,431
                              Total Assets

                                                                                                                                                                              76,163
                                                                                                                                                           74,102
                                                                    Investment securities

                                                                                                                                       70,414
                                                                                                                64,080
                                                                    Acceptances

                                                                                                                                                                                                                 56,373
                                                                                                                                                                                               54,841
                                                                                                                                                                     51,801
                                                                                                                                                  50,945
                                                                                                                              47,276
                                                                                                     41,963
                                                                    Other Assets

                                     68%
                                                                                                         2016                     2017                2018              Q1 19                     Q2 19             Q3 19

                       Gross Loans and Advances by Sector                                                                                 Investment Securities Portfolio
Sector                                                Q3 19          Q2 19           Var %                                    By Type                                                        By Geography
Manufacturing                                            1,956           1,656              18.1
                                                                                                                              5%
Services                                                 5,538           5,001              10.7                         9%
Trade                                                    5,660           5,186               9.1                                                                                       26%
Construction                                             4,321           4,074               6.1                                                                                                   74%
Others                                                   1,200           1,153               4.0                          AED 6.7 billion                                                       Invested
                                                                                                                                                  47%
                                                                                                                           Investment                                                          in the UAE
Hospitality                                              2,485           2,444               1.7                                                                                                                   56%
                                                                                                                             Portfolio                                                          and GCC
Real estate                                             20,610          20,373               1.2
                                                                                                               39%
Personal - mortgage                                      3,068           3,034               1.1                                                                                 18%
Personal - schematic                                     4,309           4,316               (0.2)
Government entities                                           273            275             (1.0)
Financial and insurance activities                       7,581           7,748               (2.2)              Fixed rate gov’t securities                                              Domestic
Individual loans for business                            1,714           1,756               (2.4)              Other fixed rate securities                                              GCC
Transportation and storage                               1,215           1,269               (4.3)              Floating rate non-gov’t securities                                       International
Total                                                   59,929          58,285                2.8               Fund of funds and Equities
                                                                                                                                                                                                                              15
Divisional Contributions - specialist business lines supporting our customers                                                                           (AED m)

                     Divisional net profit movement                                                   Divisional RWA movement

                                +26.1%                                                                           +11.7%

          178.8        (68.1)                          60.1      1,063.1                               3.9            0.4        (0.4)       0.6        71.7
                                             63.6
                                 (14.4)
 843.1                                                                                         3.0
                                                                                     64.2

 9M 18    Corp        Comm      Fin Inst   Personal   Trading    9M 19               9M 18     Corp   Comm       Fin Inst      Personal    Trading     9M 19
                                                      & Other                                                                              & Other
                                                                                                       Personal             Trading and
  9M 19                                             Corporate      Commercial          Institutions                                                   Total
                                                                                                       Banking                    Other

  Operating Income                                     774.8               619.9             54.2            505.3               287.9             2,242.2

  Expenses                                             (147.2)             (172.2)           (17.5)      (309.1)                   (6.7)             (652.8)

  Operating Profit                                     627.6               447.8             36.7            196.1               281.2             1,589.4

  Impairment (charges) / benefits                      (224.0)             (193.5)            (8.6)          (94.8)                (5.3)             (526.3)

  Net Profit                                           403.6               254.2             28.1            101.3               275.9             1,063.1

  % of Group Net Profit                                 38.0                23.9               2.6             9.5                25.9               100.0
                                                                                                                                                               16
CBD – a strong legacy to build an exciting future

       1969                                1982                                                             2019
                                                                                CBD is owned by UAE entities and nationals
Public Shareholding Company       With the introduction of
established by an Emiri Decree    restrictions on foreign banks’     • CBD shareholders: Government of Dubai (via the Investment Corporation of Dubai) with
issued by His Highness the late   operations in the UAE, CBD           20% and UAE nationals and entities owned by UAE nationals with 80%. In accordance
Sheikh Rashid Bin Saeed Al        converted into a national Public     with CBD’s articles of association, the shares which are listed on the Dubai Financial
Maktoum and owned by three        Shareholding Company.                Market are currently owned and shall be owned by, and may only be acquired by,
foreign      banks      (Chase                                         natural persons having UAE nationality or legal persons or corporations fully owned by
Manhattan,       Commerzbank                                           UAE nationals.
and Commercial Bank of                                               • CBD is managed by business segments namely: Corporate Banking, Commercial Banking,
Kuwait) whose combined                                                 Business Banking, Personal Banking and Treasury and Investments.
shareholding was 78%.                                                • CBD launched a full fledged Islamic Banking business in September 2008 to offer Shari’a-
                                                                       compliant banking and financial services.
                                                                     • CBD has five wholly-owned subsidiaries: CBD Financial Services LLC (CBDFS), which
                                                                       provides brokerage facilities for local shares and bonds; CBD Employment Services One
                                                                       Person Company LLC, which supplies manpower services; Attijari Properties LLC, which
                                                                       provides services for self-owned property management; CBD (Cayman) Limited, which
                                                                       was established for issuance of debt securities; and CBD (Cayman II) Limited, which was
                                                                       established to transact and negotiate derivative agreements. It also has one associate
                                                                       (17.8% shareholding) National General Insurance Co. PSC (NGI), which underwrites life
                                                                       and general insurance business as well as certain reinsurance business.

                                                                              Slide 17                                                                       17
Board of Directors and Management Team
                        Board of Directors                                                                                      Shareholders

                                                                                  Government of Dubai* 20%                                 Al Futtaim Private Co. 10.51%
                                                                                                                                                 Orient Insurance PJSC. 8.84%
                                                                                                                    UAE nationals                   Abdulla Hamad Al Futtaim 6.95%
                                                                                                                        80%                          Ghobash Trading & Inv. 6.37%
                                Mr. Humaid Mohammad                                                                                              A W Rostamani Group 6.19%
                                                                                   General public 36.14%
                                Al Qutami
                                Chairman
                                                                                                                                            Al Majid Investments 5%
                                                                                *Investment Corporation of Dubai (ICD)

                                                                                                                              Management Team
     Mr. Ahmad Abdulkarim Julfar                  Mr. Abdullah Salim Alturifi                                                  Dr. Bernd van Linder
     Vice-Chairman                                Director                                                                     Chief Executive Officer

                                                                                                    Mr. Darren Clarke                                        Mr. Fahad Al Mheiri
     Mr. Abdulla Saif Al Hathboor                 Mr. Abdul Wahed Al Fahim                          Chief Financial Officer                                  General Manager,
     Director                                     Director                                                                                                   CBD Al Islami

                                                                                                    Mr. Othman Bin Hendi                                     Mr. Abdul Rahim Al Nimer
                                                                                                    General Manager,                                         General Manager,
     Mr. Ali Fardan Al Fardan                     Mr. Buti Saeed Al Ghandi                          Corporate Banking                                        Commercial Banking
     Director                                     Director

                                                                                                    Mr. Hassan Al Redha                                      Mr. Amit Malhotra
                                                                                                    General Manager, Institutional &                         General Manager,
                                                                                                    Transaction Banking                                      Personal Banking Group
     Mr. Hamed Ahmed Kazim                        Mr. Khalid Abdul Wahed
     Director                                     Al Rostamani
                                                  Director                                          Mr. Mark Zanelli                                         Mr. Gareth Powell
                                                                                                    General Manager, Treasury and                            Chief Human Resources Officer
                                                                                                    Asset & Liability Management

     Dr. Omar Mohammad Ali                        H.H. Sheikh Maktoum Hasher
     Alqaizi                                      Al Maktoum                                        Mr. C. Krishna Kumar                                     Mr. Alan Grieve
     Director                                     Director                                          Chief Operating Officer                                  Chief Risk Officer

                                                                                                                                                                                         18
Corporate Governance – leading with excellence
                                                                          Board of Directors

                                                                                                                     Organisational Structure

The Board of Directors provides strategic guidance, effective                                                                     Chairman and
                                                                                                                                Board of Directors
monitoring of management, adequate controls and sets the
tone and culture of the Bank to enhance and ensure                Board
sustainable shareholder value.                                                               Nomination &               Financial                Audit &
                                                                  Credit & Investment                                                                                     Risk               IT and Digital
                                                                                             Remuneration           Settlements and            Compliance
                                                                      Committee                                                                                        Committee          Banking Committee
                                                                                              Committee           Recovery Committee           Committee
                                                                       Oversees the            Reviews and           Approves large        Assists the Board in    Supports the Board     Assists the board in
                                                                       quality of the        approves overall         restructuring             fulfilling its       in ensuring that         fulfilling its
The Board of Directors has a collective responsibility for the                                HR policies and          proposals,                oversight           CBD achieves its           oversight
                                                                      Bank’s Credit &
Bank, including approving the strategic objectives based on             Investment         strategy, and CBD’s       provisions and         responsibilities for   strategic objectives   responsibilities for
the long term financial interests of the Bank’s Shareholders,          portfolio and          compensation        write offs, oversees         CBD’s audit,           without being            the bank’s
overseeing the implementation of the strategy and                  effectiveness of its    program in order to      approach to and        internal control and    unduly exposed to          digitisation
                                                                                            attract, retain and         guides in              compliance                 risks.             program and
achievement of the strategic objectives and defining the risk       credit policies and
                                                                                               motivate its        restructuring and             systems.                                  related potential
appetite, internal controls, compliance, governance and            approves loans and
                                                                    investment above            employees.         recovery of large                                                      security risk issues.
corporate values. The Board sets the tone on professional              management                                      exposures.
standards that promotes integrity for itself, senior                       limits.
management and employees of the Bank.

                                                                                                                                                Head of Internal         Head of
                                                                                                            Board Secretary
                                                                                                                                                    Audit              Compliance
The Directors of the Board, as per the Articles of Association
of Commercial Bank of Dubai, are elected in the General
Meeting by secret ballot every three years. As at 30th
September 2019 the Board comprised of 11 non-executive                       Senior management and                               Chief Executive
members.                                                                     management committees                                   Officer

                                                                                  Management

The Board of Directors has delegated authority to CBD’s                                    Executive        Asset & Liability         Credit
                                                                                          Committee           Committee             Committee             Project         Operational Risk
executive management to enter into transactions which are
                                                                                                                                                        Investment         Management
consistent with the Bank's risk strategy and policy guidelines.                                                                    Information          Committee           Committee
                                                                                    Human Resources           Compliance
                                                                                                                                   Security Risk
                                                                                      Committee               Committee
                                                                                                                                    Committee

                                                                                                                                                                                                           19
Corporate Social Responsibility – fulfilling our social commitments
The elements of CBD’s CSR framework:

                     Education                                           Health
     Commercial Bank of Dubai targets the support      Commercial Bank of Dubai serves to foster the
     and development of educational programmes        health and wellbeing of people living in the UAE
                aimed at UAE Youth.                   through wellness programs, public health, safety
                                                      and cultural health initiatives by UAE federal and
                                                                    Dubai governments.

               Financial Literacy:
     Commercial Bank of Dubai aims to provide
      financial training programs geared toward
     university and schools students in order to
     build their competencies and knowledge in
                                                          Charity and volunteer programs
   financial literacy. The Bank also supports small
   and medium enterprises, significant creators of    Commercial Bank of Dubai is engaged in various
   employment in the UAE, by facilitating relevant      charitable activities and sponsorships which
   investments and providing the working capital         must be in line with above framework and
     required to expand their businesses. It also      support the involvement of its employees in
        provides non-financial support such as           such activities by volunteering programs.
                  technical assistance.

                                                                                                           20
Corporate Social Responsibility – fulfilling our social commitments

                                               Q3 CSR Activities

                                            Celebrated Zayed            Volunteered in “Their
     “Back to School 2019”                                                                         Participated in Ramadan
                                          Humanitarian Day by         Sohour is on us” organized
   initiative in affiliation with                                                                  Aman 8 organized by Al
                                          distributing over 4000           by Community
        UAE Red Crescent                                                                            Ihsan Charity in Dubai
                                                   meals               Development Authority

                                         Corporate Social Responsibility
                                            Excellence Award 2019
                                     The Award recognized supporters and contributors to
                                        the benefit of learning and developing people of
                                    determination across United Arab Emirates following the
                                       steps of our government in the race of excellence

                                                                                                                             21
Awards and Achievements
   Partnered with ICC Loyalty to launch its    Founding Member of UAE Trade Connect         Partnered with Xpress Money to expand its
       Exclusive CBD Rewards Program                         (UTC)                               international remittance services

 Partnered with FEWA for Payments and Cash                                                  Launched CBD Al Islami Super Saver Credit
                                                  Celebrated 50th Anniversary of CBD
           Management Solutions                                                                               Card

     Recognized with “Best Call Centre”,
                                              Recognized with “Best Mobile Banking App”
          “Best Cash Management”,                                                           Recognized with “Best Digital Bank” at the
                                                at the Global Finance - Best Digital Bank
    “Best Digital Transformation Services”                                                       New Age Banking Awards 2019
                                                              Awards 2019
 – Banker Middle East Product Awards 2019

                                                                                                                                         22
United Arab Emirates – the second largest economy in the Arab world
                                 UAE Stock market indices                                                               Limited Fiscal Deficit to be posted
                                                                                                      Surplus (AEDb)       As % of GDP                                              6.2
5,700                                                                     DFM     ADX

5,200
                                                                                                   (44.2)    (26.5)    (22.9)   (27.6)   (13.2)    (28.0)   (11.0)
                                                                                                                                                                       (3.0)
4,700                                                                                  5,054

4,200

3,700
                                                                                                                                                                                   0.3%
3,200                                                                                                                                                       (0.6%)    (0.2%)
                                                                                       2,781                                             (0.8%)
                                                                                                            (2.0%)     (1.6%)   (1.8%)            (1.7%)
2,700
                                                                                                (3.4%)
2,200
        2014         2015            2016            2017          2018         2019               2015      2016      2017     2018     2019F    2020F     2021F     2022F        2023F

Source: Abu Dhabi Securities Exchange, Dubai Financial Market                                  Source: International Monetary Fund

                                        5 Year CDS                                                                       UAE GDP and Government Debt
        DXB       AUH                                                                                Nominal Gross Domestic Product (AEDb)        Govt. debt as % of GDP            1,887
                                                                                                                                                                           1,803
300                                                                                                                                                           1,724
                                                                                                                                                    1,649
                                                                                                                                1,559     1,571
250                                                                                                                    1,405
                                                                                                   1,315     1,311
200

                                                                                         141
150

100
                                                                                         62
 50                                                                                                         20.2%      19.7%    18.7%     19.2%     19.0%    18.7%     18.4%        18.1%
                                                                                                 18.7%
  0
  Nov-15                Jun-16              Jun-17              Jun-18          Jun-19             2015      2016       2017     2018     2019F     2020F    2021F     2022F        2023F

 Source: Bloomberg                                                                             Source: International Monetary Fund

                                                                                                                                                                                            23
UAE Economic Update – mixed business conditions with weaker oil prices
                              UAE GDP and Inflation Trend                                                                          Purchasing Managers Index
   CPI       GDP                                                                                                 UAE       KSA

                                                                                                                                                                                         57.3
                                                                                                          56.7

                                                                                                          55.0

          5.1%
 4.1%
                                                                                                                                                                                         51.1
                                 3.1%                               3.1%                         2.8%
                       1.7%                    2.0%                         1.7%
                                                      0.5%
                                                                                           -0.4%
     2015                  2016                  2017                 2018                  Aug’19 YTD   Jan-17 Apr-17 Jul-17 Oct-17 Jan-18 Apr-18 Jul-18 Oct-18 Jan-19 Apr-19 Jul-19 Sep-19
Source: IMF, fcsa.gov.ae                                                                                   Source: investing.com

                              UAE and Dubai population (m)                                                                                    Brent oil
                                                                             Dubai              UAE                                                                                  USD / bbl

                                                                                                         111     114

                                                                                     10.1       10.4                                                                    86
                                                             9.6           9.9
                           8.8          9.0       9.0
    8.3          8.5                                                                                                                                                                74
                                                                                                                                                                                           61

                                                                                                                                                                             50
                                                                                     3.0         3.2
                                        2.2       2.3        2.4           2.7
    1.9          2.0       2.1
                                                                                                                                     29

   2010      2011       2012            2013     2014        2015      2016          2017       2018     2014          2015        2016         2017          2018           2019

Source: IMF, Dubai Statistics Center                                                                       Source: investing.com
                                                                                                                                                                                                24
Dubai – a pivotal hub in the global economy
                                      Growth in Economy                                                                                            Foreign Trade
          Real GDP (AED b)            Real GDP Growth Rates (%)                                                Exports & Re-Exports         Imports                                                            AEDb

                                 4.6%                                                                                                                   574
                                                                                                                                             545                             536
                      4.1%                            4.1%                                                                      502                                  514                  518
            3.0%                            3.8%                                                                                                                                                  471
   3.5%                                                                                                                 442
                                                                  2.7%      2.8%                            364
                                                                                                                              280          290                             325          337
                                                                                              2.1%                                                    299          311                          286
                                                                                     1.9%                             293
                                                                                                         283                                                                                                  190
                                                                                                                                                                                                            148

   290       299       311       325        337       366         379        389      398        406

   2010     2011      2012       2013       2014      2015        2016      2017     2018     2019P       2010        2011    2012         2013       2014         2015    2016         2017    2018        Q1 2019

Source: Dubai Statistics Centre, Dubai Economy Department                                              Source: Dubai Statistics Centre

                                Dubai GDP by sector (2018)                                                                                  Tourism remains robust
                                                                                                            Number of Visitors (m)

                             Other
                                                                         Wholesale & Retail trade
                                     23%
                                                                  27%
                                                                                                                                                            15.8                 15.9
                                                                                                                                    14.9
                                                                                                               14.2

    Hotels & Restuarants 5%

                                                                                                                                                                                                      8.4
                                10%                                 12%
           Financial Services                                              Transport & storage

                                           14%              9%

              Construction and real estate                   Manufacturing
                                                                                                               2015                 2016                    2017                 2018             H1 2019
   Source: Dubai Economic Report                                                                       Source: Dubai Statistics Centre
                                                                                                                                                                                                                25
Dubai Economic Update – softening real estate prices and general business conditions
                                      Dubai GDP growth                                                                           Dubai hospitality
                                                                                                Jul-17                                         -11.3%                                     AED
                                                                                                Jul-18
                                                                                                                                  471       476
                                                                                                Jul-19
            4.10%                                                                                                                                    422                         -13.5%

                                                                                                                                                                            362
                             2.70%           2.80%
                                                                                                                                                                      310             313
                                                                              2.10%                            -2.0%
                                                              1.90%

                                                                                                66        75           74

            2015             2016            2017             2018            2019P                  Occupancy %                   Average daily rate            Revenue per available room
  Source: Dubai Statistics Centre, Dubai Economy Department                                Source: STR Global

                              Dubai airport passenger traffic                                                                  Reidin Property Index
                                                                                                     Abu Dhabi Sale Prices               Dubai Sale Prices
                                                                                                     Abu Dhabi Rental Prices             Dubai Rental Prices

                                                      23.8                                       94
                    23.5
                                     22.8
                            21.7                                      22.2
                                                               21.6
          20.6                               21.0
                                                                                                 88
                                                                                19.0                                                                                                87
Million

                                                                                                 83
                                                                                                                                                                                    81
                                                                                                 82
                                                                                                                                                                                    77
                                                                                                                                                                                         76
          Q2 17     Q3 17   Q4 17    Q1 18   Q2 18   Q3 18    Q4 18   Q1 19    Q2 19   Aug-18        Sep-18        Nov-18       Jan-19       Mar-19          May-19     Jul-19       Aug-19

  Source: Dubai Airports, gulfbusiness.com

                                                                                                                                                                                              26
UAE Banking Sector – remains stable and resilient
                                   Key industry indicators                                                    Average Loan Yield & Cost of Deposits vs 3M EIBOR
                                                                                                        3M EIBOR              Yield on Loans          Cost of Deposits
 AEDb                                  2016         2017           2018    Aug-19     YTD
                                                                                                                                                                          5.5%
 Total assets                          2,593        2,694          2,869   2,983     4.0%    5.1%             5.2%                                           5.1%
                                                                                                                              5.0%
                                                                                                                                                                                          5.4%
 Customer deposits                     1,563        1,627          1,756   1,764     0.5%                                                     5.0%

                                                                                                                                                                          2.8%
 Loans and advances                    1,554        1,580          1,656   1,708     3.1%                                                                                                2.6%

                                                                                                                                                          1.5%
 Loan to deposit (%)                   99.4         97.1           94.3     96.8     2.5%
                                                                                                                                               1.2%                       1.8%            1.8%
                                                                                              1.0%             1.0%           1.0%
 CAR (%)                               18.9         18.1           17.5     17.9     0.4%                                                     1.2%           1.3%
                                                                                              0.8%             0.7%           0.8%
 Tier 1 ratio (%)                      17.3         16.6           16.2     16.7     0.5%
                                                                                              2013             2014           2015             2016           2017       2018             Jun’19
 Source: Central Bank of the UAE                                                              Source: Central Bank of the UAE

                           Improving industry asset quality                                                      Government deposits as % of total deposits
                    NPL Ratio                 Loan Loss Coverage
                                                                                     104%            The UAE banking system is one of the least dependent amongst GCC countries on
                                                       95%           96%                             government deposits making it relatively less vulnerable to a decline in liquidity
                                           88%                              91%
                                                                                                                      34.5%

                                                                                                                                                                     27.5%
                                57%
      44%        48%
                                                                                                                                     19.7%
                                                                                                                                                      15.5%
                                                                                                     10.1%                                                                          10.1%

     10.6%      10.4%           9.2%       5.6%        5.0%         5.0%    5.5%     5.1%

     2011       2012            2013      2014         2015         2016    2017    Q2 2018          Kuwait           Qatar       Saudi Arabia        UAE            Oman          Bahrain
 Source: Central Bank of the UAE                                                              Source: Central Bank of country, July 2019

                                                                                                                                                                                           27
UAE Banking Industry – CBD execution delivering above system growth
                                             Gross loans and deposits                                                                         Credit Growth in the UAE Banking Sector
                 Gross loans       Deposits                                             +0.5%                                  Domestic Credit           Foreign Credit

                                                                                +3.1%
AED Billion

                                                                                                                                                 15.9%
                                                                      1,657
                                                                              1,756       1,708 1,764
                                   1,554 1,563      1,580 1,627
               1,466 1,472                                                                                                                                                                                          12.0%
                                                                                                                                                                                                11.2%

                                                                                                                   8.0%
                                                                                                                                                                             6.0%
                                                                                                               3.5%                               5.2%
                                                                                                                                                                                                3.9%                    3.8%

                                                                                                                                                                           1.4%

                   2015               2016             2017              2018               Aug-19                2015                            2016                     2017                 2018                    2019
              Source: Central Bank of the UAE                                                                      Source: Central Bank of the UAE

                                                 CBD market share                                                                           3 Month EIBOR and UAE loan to deposit ratio
                  Gross loans                                                                                                 3.50%              3 Month EIBOR                                                  110.0%
                                                                                                                                                                      Fed Rate Increase (+25bps)
                  Deposits                                                                                                                       LDR                  Fed Rate Decrease (-25bps)                108.0%
                                                                                                3.5%                          3.00%

                                                                                                                                                                                                                         Loan to deposit ratio
                                                                                                                                                                                                                106.0%
                                                                                                     3.3%                     2.50%
                                                                                                                                                                                                                104.0%

                                                                                                            3 Month EIBOR %
                                                                                                                              2.00%                                                                             102.0%

                                                                                                                              1.50%                                                                             100.0%

                                                                                                                                                                                                        96.8%   98.0%
                                                                                                                              1.00%
                                                                                                                                                                                                                96.0%
                                                                                                                              0.50%
                                                                                                                                                                                                                94.0%

                                                                                                                              0.00%                                                                            92.0%
   Jul-14          Jan-15 Jul-15    Jan-16 Jul-16   Jan-17 Jul-17   Jan-18 Jul-18     Jan-19 Aug-19                                Dec-15              Nov-16             Oct-17       Sep-18            Aug-19

              Source: Central Bank of the UAE                                                                       Source: Central Bank of the UAE
                                                                                                                                                                                                                        28
You can also read