DUXTON ASSET MANAGEMENT - Global investing in agricultural land made simple
←
→
Page content transcription
If your browser does not render page correctly, please read the page content below

Private and Confidential: for Discussion Only
Subject to management as well as regulatory approval.

          DUXTON ASSET MANAGEMENT

        Global investing in agricultural land
                   made simple
         Ed Peter
         CEO
         Duxton Asset Management
         Singapore
         September 2011

                                                        1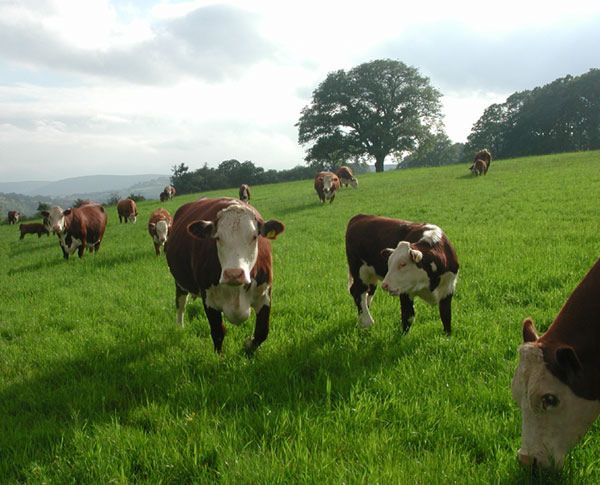
Duxton’s Investment Universe
 AUM by asset class                                                          Agricultural assets

                                                                                                              Agricultural Land
                 3%                                                                         4%

                                          Agricultural Land                           24%
                                                                                                              Soft Commodities
     37%                                  Commodities
                           56%            Equities                                    4%
                                                                                                  68%         Agricultrual Equities
                                          Other Assets
                                                                                                              & Closed End Funds
           4%
                                                                                                              Wine Assets

   AUM by client type
                                                                             Clients by account size
                                                                    Account Size $m              Number of Clients
           25%                              Institutional
                             38%                                    0 -10                        Approx 15 in various funds
                                            Private banks
                                                                    10-25                        Approx 2 in funds

                                            Others (includes        25-100                       1 client in funds
                                            family offices)
              38%                                                   100m+                        1 direct advisory mandate

Total AUM ~ USD 615 Mn as of July 31, 2011
All figures are approximate as at July 31, 2011 apart from client
numbers which are approximated as at August 31, 2011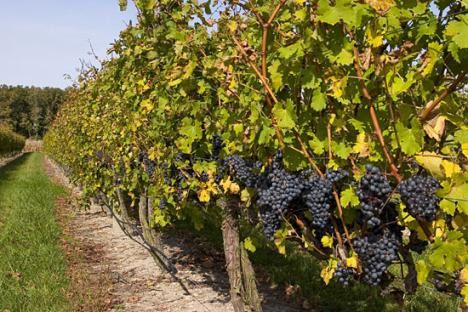
Duxton’s Agri land and listed funds
                                                                    DALT (Semi-annual liquidity)                                                                                        DACE (Daily liquidity)

                                                                                                                                                                                          Commodity Futures
                                                                             Farmland                                                                         Equities                        / Swaps                                Indices/ETFs
                                                                               70%
                                                                                +                                                                                  Asset Allocation over a four month period
                                                                             Commodity
                                             Equities                      Futures / Swaps         Indices/ETFs

                                                                                30%

                                                                                                    AUM development for DALT and DACE
                                                                                                                                                                    25                                                                       $120
                                                               10                                           11
                                                                                                                   NAV per Share ('000 USD)
                                                                                                                                                                                                                                             $100
AUM figures as at 31st July 2011 in USD

                                                                                                                                                                                                                                                    NAV per share (USD)
                                          AuM (USD Millions)

                                                                                                                                                                    20

                                                                                                                                              AuM (USD Miilions)
                                                               8
                                                                                                            10.5
                                                                                                                                                                                                                                             $80
                                                               6                                                                                                    15
                                                                                                            10                                                                                                                               $60
                                                               4                                                                                                    10
                                                                                                                                                                                                                                             $40
                                                                                                            9.5
                                                               2                                                                                                    5                                                                        $20
                                                               0                                            9                                                       0                                                                        $-
                                                                                                                                                                            Inception    30 Apr 11   31 May 11   30 Jun 11   31 Jul 11
                                                                                                                                                                         AuM (Assets Under Management)             NAV per share (Class B)
                                                                            AuM (Assets Under Management)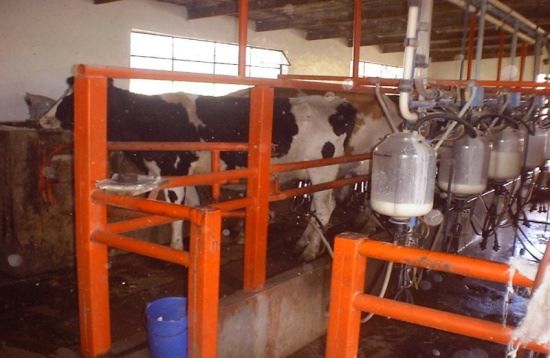
Duxton’s Direct Investment Experience - Strategy
                          AGGREGATION
                      • Economies of scale
                      • Limited Markets
                      • Financial robustness

      GREENFIELD                                   SPECIAL SITUATIONS
•   Market openings                                • Stressed sales
•   Dairy                   Investment             • Generational shift
•   Biofuels                Experience             • Political shift

                              CAPITAL
                      •   Transformation of land
                      •   Irrigation
                      •   Machinery
                      •   Technology

                                                                          4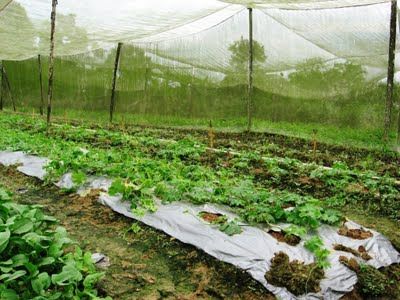
Duxton’s Direct Investment Experience – Value Add

 • Consolidate small fragmented                                                  • Optimize the farming system by
   parcels of land into larger                                                     applying a mixture of contracting,
   farmland (e.g. optimal size for                                                 leasing and owning, thereby
   generic grain farmland is 10K-12K                                               minimizing operating costs
   Ha), and maximizing land                                                        and investments in equipment
   utilization by removing fence                                                   and capital items.
   lines, and transforming
   undeveloped grazing land into
                                         Consolidation        Utilization
   cropping land. As such, synergies
                                                              (Optimizing the
   are created with existing farms        (Create EOS)
                                                             farming system)
   and economies of scale (“EOS”)
   are achieved.

                                         Human Capital
                                                            Agritechnology
                                          Management
 • Human Capital Management:                                 (Increase Yields)
                                         (Decrease Costs)                        • Adopt best agricultural practice
   Significantly reduce labor cost by
   managing human-capital.                                                         and technologies, such as laser
   Relatively less managers are                                                    leveling, pedologic analysis
   required to manage a larger farm                                                (spatial analysis, aerial survey)
   in developed countries. However,                                                that help to improve soil and
   the converse is true for our                                                    water-use efficiency, thereby
   strategies in developing countries,                                             increasing yield.
   where we utilize more labor than
   capital due to cheaper labor
   costs.
Duxton’s Agriculture Footprint

                                                                                                                            Russia

                                                                                   Bulgaria

                                                                                                                                Laos
                                                                                                                    India
                Mexico

                                                                                                                                                    Philippines
                                                                                                                                       Vietnam

                                                                         Democratic Republic      Kenya                                                     Papua New Guinea
                                                                         of Congo (DRC)
                                                                                                 Tanzania                      Singapore
                                                                              Zambia
                                                                                                                                Australia

                                     Argentina
                                          Chile
Opportunities being evaluated – In                  Uruguay                               South Africa
due diligence
                                                                                                                                                     New Zealand
 Pre-due- diligence

 Completed

                                                          Completed Investments
         Darjeeling Organic      African Crops                    Wyalong Rural         Mountainside                                             Green Feed &
                                                    Merriment                                               ACE Dairy         Los Yaros
         Tea Estates             Limited                          Investments          Farms                                                      Anova Corp
                                                    (Australia)                                             (Australia)      (Argentina)
         (India)                 (Zambia and DRC)                 (Australia)          (Tanzania)                                                  (Vietnam)
                                                                                                                                                                           6
Table of Contents:
I. Why invest in Agriculture and Soft Commodities?
II. Why Invest in Farmland?
III. Farming Asset Breakdown
7I. Why invest in Agriculture and Soft
Commodities?
8Fundamental Balances in the Production of Food
There are 80 million new mouths to feed every year
- Population Reference Bureau (PRB) World Population Clock 2006 Datasheet
The amount of arable land per person that we had 40 years ago has reduced by half.
- United Nations Food and Agricultural Division: Dimensions of need: An atlas of food and agriculture. Rome, FAO, 1995. p. 16-98
Growing Demand FOOD Constrained Supply
1. Soaring Global Population 5. Land
- Rising Food Consumption - Urbanisation
- Degradation
- Decreasing farmland yield growth
2. Urbanization
6. Water
- Changing Diets
- Climate Change
- More Processed Foods
- Pollution & Salinity
3. Rising Income 7. Farm Management
- Better Food - Competing Vocations
- Higher Protein Consumption 8. Transport & Logistics
- Infrastructure in Emerging Economies
- Energy costs
4. Alternative Uses
- Bio-fuels
9Expected Soft Commodities Price Appreciation
Growing Global Population & Static Rising Income = Better Food:
Growth in Farmland Area Increase in Population & Urbanization Higher Protein Consumption
World Population & Farmland (area) The Simple Income Food Formula
World Population 7.5
(bn)
Farmland (bn ha) 6.0
Farmland per
inhabitant (ha)
4.0
2.5
1.4 1.5 1.5
1.3
0.5 0.4 0.3 0.2
1950 1975 2000 2020
Farmland per inhabitant is projected to Unplanned urbanization is causing ■ Around 80% of the world’s population still
decrease from 0.5 ha per inhabitant in 1950 to cannibalization of potential agricultural land. earns a low income (GNI < USD 3,466 per
0.2 ha per inhabitant in 2020. Increase in population is putting substantial capita.)
Population projected to increase to 9.2bn in pressure on the food supply chain. ■ Increase in income increases people’s protein
2050. consumption.
Requires agricultural output to double by ■ These factors require substantial change &
2050. investments across the asset class.
(Source: Population Division of the Department of Economic
and Social Affairs of the United Nations Secretariat) (Source: Income Group Classification; World Bank 2006.
(Source: Population Division of the Department of Economic USDA; FAO/WHO/UNICEF Protein)
and Social Affairs of the United Nations Secretariat, World
Population Prospects, National Geographic June 2009)
10Expected Soft Commodities Price Appreciation
Feed conversion efficiency
Arable land as an attractive Long-term demand for Bio-Fuels
Meat is a resource-costly form
investment Increase in ethanol production
of food
Pounds of usable protein yields per acre of land
US average farm values vs. S&P 500
2.50
2.00
Index (Base = 1.00)
1.50
1.00
0.50
Wheat yields
more pounds
0.00
of usable
1998 1999 2000 2001 2002 2003 2004 2005 2006 2007 2008
protein than
beef US Average Farm Real Estate US Average Farm Real Estate
Value USD/acre (Nominal) Value USD/acre (Real)
S&P (Dec close - Nominal) S&P (Dec close - Real)
Meat, which is high in protein is a resource Farmland has shown low year-on-year Federal mandates promoting the use of
costly form of food. In terms of usable protein volatility and a low correlation with other ethanol soaked up 30% of last year’s corn
yield per acre of land, wheat can feed asset classes. production in the US, sending corn prices
approximately 7 times more people than beef In US, it has exceeded stock and bond market above USD 8 a bushel, almost triple its
World meat consumption is expected to returns with less volatility. 2005 price
double by 2050. Inflation hedge: Inflation adjusted return on As the United States is the world’s largest
It takes 100 times more water to. produce a dollar per S&P 500 at the end of 1998 was corn exporter, increased U.S demand for
kilo of beef than a kilo of wheat worth USD 0.55 at the end of 2008, compared corn leads to higher prices globally.
to 1.80 for land.
(Source : USDA; FAO/WHO/UNICEF Protein Advisory (Source: FAO, US Department of Agriculture,
Group, Diet for a New America. John Robbins.2004) (Source: Bloomberg 2009) National Geographic, June 2009)
11Ag assets vs. broader markets
ETF’s have underperformed spot Agricultural commodities and
prices of commodities over the equities have a strong co-relation
past 5 years to broader markets
Security DACE GSCI MSCI DWS AG
DACE 1 0.738 0.666 0.485
GSCI 0.738 1 0.555 0.449
MSCI 0.666 0.555 1 0.639
DWS AG 0.485 0.449 0.639 1
The above table shows prices for a 5-year period ending September 2, 2011 Cocoa
•The above table shows co-relation between the Duxton Agricultural Commodities and
prices are shown for a 2-year period ending September 2, 2011
Equities Sub Fund and the S&P GSCI index, the MSCI World Index and the DWS
Source : Bloomberg.
Agribusiness fund (equity focussed)
•The chart shows the comparative returns of DACE compared with DWS
Agribusiness fund, DACE and the S&P GSCI Index
Source : Bloomberg.Corn ETFs vs. spot prices over the past five
years
The chart above shows prices for a 5-year period ending September 2, 2011
Source : Bloomberg.
13II. Why Invest in Farmland?
14Investment Thesis: Two Phase Value Creation (α & β)
While investors wait for the expected future soft-commodities price appreciation to materialize (β), Duxton’s
investment approach of investing in farmland gives investors the additional benefit of alpha exposure (increasing
cash yield through farming efficiencies).*
FARMLAND SOFT COMMODITIES
Alpha (α) Creation Beta (β) Exposure
*No assurance can be given that the investment objectives will be achieved
15Why Invest in Farmland?
Historically, farmland investments have been less risky and less volatile relative to other asset classes.
Average Annual Nominal Returns, 1926 - 2002
Asset Mean Return Risk Premium Standard Deviation
Small Company Stocks 16.90% 13.10% 33.20%
Large Company Stocks 12.20% 8.40% 20.50%
Farm Real Estate 10.50% 6.70% 8.20%
Long-Term Corp. Bonds 6.20% 2.40% 8.70%
Long-Term Govt. Bonds 5.80% 2.00% 9.40%
Intermediate-Term Govt. Bonds 5.40% 1.60% 5.80%
U.S. Treasury Bills 3.80% - 3.20%
Inflation 3.10% 4.50%
Past performance is not indicative of future returns
Source: Ibbotson Associates. Stocks, Bonds, Bills and Inflation: 2003 Yearbook.
Farm Real Estate returns are estimated using USDA data
Annual Nominal Return = (Pt – Pt-1 + Dt)/Pt-1 16
Risk Premium equals difference between an asset’s mean return and U.S T-bill
returnAverage Returns Of USA Farmland*
Annual
Year Quarter 1 Quarter 2 Quarter 3 Quarter 4 Annual Farmland Index Return
1992 1.36% 1.84% 0.76% 2.25% 6.21%
1993 1.41% 2.13% 1.07% 3.64% 8.25% Last 15 YEARS 11.54%
1994 1.77% 2.84% 1.31% 3.13% 9.05% Last 10 YEARS 13.43%
1995 1.02% 4.25% 1.20% 2.88% 9.35%
1996 1.21% 3.23% 1.10% 3.96% 9.50% Last 5 YEARS 12.99%
1997 1.22% 3.58% 0.63% 3.12% 8.55% Last 5 YEARS (EXCLUDING
1998 1.04% 2.62% 1.21% 2.18% 7.05% 2010) 17.58%
1999 1.20% 1.41% 0.79% 3.39% 6.79%
2000 1.07% 1.33% 1.55% 2.87% 6.82%
2001 0.68% 1.31% 0.03% -0.01% 2.01%
2002 0.65% 1.68% 0.84% 3.55% 6.72%
2003 1.21% 1.74% 0.95% 5.51% 9.41%
2004 1.69% 2.61% 0.74% 14.63% 19.67%
2005 2.08% 3.66% 3.06% 22.78% 31.58%
2006 4.02% 2.44% 1.93% 11.55% 19.94%
2007 2.13% 2.33% 2.76% 7.92% 15.14%
2008 1.17% 4.50% 2.09% 7.33% 15.09%
2009 1.32% 1.15% 1.01% 2.71% 6.19%
2010 1.11% 0.67% 1.03% 5.79% 8.60%
2011 2.40% 1.48% NA NA NA
Sources: NCREIF US Farmland Index., NCREIF Report.
* Includes both capital appreciation and cash yield.
Past performance is not indicative of future returns
17III. Farming Asset Breakdown
18Farming Asset Breakdown
■ Most types of farmland assets can be broken down into 4 broad parts:
Land (Appreciating)
Machinery such as Plant and Equipment (Depreciating)
Other Related Assets - Livestock, Inventory (Volatile)
Improvements (Long term depreciating)
Cattle Farming Vineyard Vegetable Farming
Dairy Farm Broad acre 19Large Scale Cattle Operations
■ The typical assets of Cattle Operations can be
broken down into 3 parts:
Land ~ 40%
Machinery Plant and Equipment ~ 20%
Livestock and others ~ 40%
■ Cattle operations are dissimilar to broad acre
farming, in the sense that they have a much less
significant portion of their assets tied up in land.
■ Typically we find 40-50% of its assets in land,
10-20% in Plant and Equipment and the Source: Google Images
remaining 40-45%% in the animals themselves.
■ In terms of balance sheet that gives you 45%
appreciating assets. 15% depreciating & the bulk
open to short term fluctuation. A much less
attractive model than one’s instinct would
expect.
20A Full Operating Vineyard
■ The typical assets of Winery can be broken down
into 4 parts:
Land ~ 25%
Machinery Plant and Equipment ~ 35%
Land Improvements (Vines) ~ 25%
Inventory (Wine) ~ 15%
■ As such, the raw agricultural land component is
small. And a significant component of its assets is
comprised of Plant, Property and Equipment.
■ That said, the total package if done right as per Source: Google Images
Chateau Margeax can lead to very interesting
returns – but dependant on branding.
21Dairy
■ The typical assets of Dairy Operations (Pasture
based model) can be broken down into 3 parts:
Land ~ 75%
Machinery Plant and Equipment ~ 5%
Livestock and others ~ 20%
■ The livestock component, which comprises a
small portion of its balance sheet, generates
the bulk of its revenues.
■ The final produce of the livestock, such as
cheese and milk solids, is what generates the
revenue for the business
Source: Google Images
■ The relatively small land component
contributes indirectly to the bottom line by
reducing feeding costs required.
■ As such, pasture based dairy farms are
highly attractive investment cases, given that
the model is a steady state cash flow
business.
22Market Garden- Vegetables
■ The market garden assets can be broken down
into 2 parts:
Land ~ 25%
Machinery, Plant and Equipment,
Inventory and others ~ 75%
■ Market gardening is characterised by small-
scale production of fruits, crops, vegetables and
flowers, sold directly to consumers and
restaurants.
■ Crops are generally grown on relatively small
parcels of land and as such have a very small Source: Google Images
land component tied up in assets.
■ It is distinguishable from other types of farming
by the diversity of crops grown on a small area
of land, typically, from under one acre (0.4hA)
to a few acres, or sometimes in greenhouses.
23Broad Acre Farm
■ The assets of a large Broad Acre Farm can be
broken down into 2 parts:
Land ~ 70%
Machinery , Plant and Equipment ~ 30%
■ Large broad acre farms have a very significant
portion of their assets in land.
■ They also tend to have exposure to a very wide
basket of crops, providing diversification.
■ Broad acre farms roughly constitutes half of all
human caloric intake and three-fourths of the Source: Google Images
world eats grain products as an important food
source.
24About Duxton
■ Duxton Asset Management (“Duxton”) is a joint venture between Deutsche Asia Pacific Holdings Pte Ltd (“DAPH”) and
Duxton Capital Pte Ltd. DAPH owns 19.99% of Duxton, and the management owns the remaining 80.01% via Duxton
Capital. As at 5 September 2011, Duxton is regulated by the Monetary Authority of Singapore ("MAS") as a holder of a
Capital Markets Services License ("CMSL") to conduct the regulated activity of fund management for accredited investors
and institutional investors.
■ Duxton is led by Mr. Ed Peter, former Head & CEO of Deutsche Asset Management (“DeAM”) Asia Pacific, Middle East and
North Africa, former Head of Asian and Emerging Equities and former member of Deutsche Bank’s (“DB”) Group Equity
Operating Committee and Asset Management Operating Committee.
■ Other key management of Duxton include: Mr. Desmond Sheehy, former Head and Managing Director of DeAM Asia,
Complex Asset Investments Group and Mr. Stephen Duerden, former Chief Operating Officer (COO) of DeAM Singapore
and the Complex Asset Investments Group.
■ The investment professionals, who previously worked in DeAM’s Complex Asset Investments Group have also joined
Duxton, and all together Duxton employs 24 staff members.
■ Duxton focuses on long-term strategic, direct investments in the agricultural sector, emerging markets and wine sectors.
■ Duxton upholds strict compliance standards. As it is a joint venture with DAPH, and is the delegated fund manager for a
number of the DWS funds managed by DeAM Asia, Duxton complies with DB based compliance policies. Duxton also has a
dedicated in-house compliance/legal team. DeAM Asia has appointed KPMG as an independent auditor for the past 3 years
for the DWS funds currently managed by Duxton.
■ Duxton’s assets under management as at end of June 2011 are ~ USD $ 620 MN across a number of mandates
25Duxton’s Agricultural Investment Expertise
■ Duxton is a leading international player in the agricultural investment space. As at end of June 2011, Duxton’s AUM was ~ USD
620 MN, of which ~ USD 400 MN comprised listed and unlisted global agriculture investments, segregated into two big pools. The
first is the DWS Global Agricultural Land & Opportunities Fund (“GALOF”)*, of which we are the delegated manager looking
after both the listed and unlisted agricultural assets. The second pool is a non-discretionary institutional mandate from one of the
top 10 global pension funds for ~ EUR 150 MN
■ Duxton currently manages ~ 100,000 ha of farmland spanning 4 continents, managed by 60 on the ground senior farmers. We have
operating investments in Argentina, Australia, India, Tanzania, Vietnam and Zambia, and are currently working on live projects
in Latin America and Eastern Europe. Duxton uses the information from its direct investments in agriculture to stay in front of the
markets. Our farmers feed “on the ground” information back up to our fund managers who assimilate this with information
gleaned from the public markets, to construct a broad view on the markets. As an example, when the storms hit Australia in 2010
– within hours, we got information back about its impact on the grains in our fields, allowing us to make decisions on the whole
hard wheat complex well before the markets reacted
■ Our ability to look beyond traditional information sources such as broker research and conventional news gives us an important
in-house edge. We use our sizeable on-the-ground presence across continents, countries, and different farming sectors to measure
the pulse of the soft commodities market
■ Duxton’s 21 investment executives have worked at institutions such as Deutsche Bank, Credit Suisse, ABN AMRO, Ernst &
Young, Credit Lyonnais Securities, International Finance Corporation, AIG Investments, Rabobank, Nomura Securities, LODH,
and Vontobel. As such, Duxton's investment professionals are able to leverage their global networks to source capital and
identify lucrative investment opportunities for their clients
26Contact Information
Duxton Asset Management
1A. Duxton Hill, Singapore 089587
Company Registration Number 200903054G
DID +65 6511 0351 (Ed Peter), +65 6511 0359 (Arush Chopra)
P +65 6511 0350
F +65 6220 7956
Email (fund related enquiry): arush.chopra@duxtonam.com
27Disclaimer
The information outlined in this presentation is not the basis for any contract to deal in any security or instrument, or for Duxton Asset Management Pte Ltd
(“Duxton”) or its affiliates to enter into or arrange any type of transaction as a consequence of any information contained. This description is for general
reference only and is not intended to be a definitive statement on DACE. The terms of DACE are set out in the prospectus (“Prospectus”) of DACE, and
should there be any conflict between the terms set out in this presentation and the Prospectus, the terms in the Prospectus shall prevail.
This presentation is directed at accredited investors and qualified investors as defined in the Securities and Futures Act, Chapter 289 of Singapore
(“Permitted Investors”), and is not intended for use by retail investors. The content of this presentation is intended as a source of general information for
Permitted Investors only, and is not the basis for any contract to deal in any security or instrument, or for Duxton or their affiliates to enter into or arrange
any type of transaction as a consequence of any information contained herein. Information from this presentation must not be issued in any jurisdiction
where prohibited by law and must not be used in any way that would be contrary to local law or regulation. Specifically, this shall not be construed as the
making of any offer or invitation to anyone in any jurisdiction in which such offer is not authorized or in which the person making such offer is not
qualified to do so or to anyone to whom it is unlawful to make such an offer.
When used in or from Hong Kong or Singapore. This presentation is communicated in or from Hong Kong and Singapore by Morgan Stanley Asia Limited
and Morgan Stanley Asia (Singapore) Pte. respectively (collectively, “Morgan Stanley Private Wealth Management Asia”). This presentation has been
prepared as an aid for prospective investors in DACE. You should read this presentation in conjunction with the more detailed information which is
contained in the private placement memorandum of DACE. This presentation has been designed for use on a one-on-one basis for sophisticated investors,
and of whom Morgan Stanley Private Wealth Management Asia has some prior knowledge and experience. If you are not within one of the categories of
recipients described above, then these disclosures may not be adequate for your purposes. This presentation does not purport to be all-inclusive or to
contain all the information that a prospective investor may need or desire in investigating DACE or its sponsors. Please discuss any questions you may have
with an appropriate Morgan Stanley representative. DACE will be an unregulated collective investment scheme for the purpose of the Securities and
Futures Ordinance of Hong Kong (the "SFO"), and no prospectus in respect of the Fund will be registered in Singapore under the Securities and Futures Act
of Singapore (the "SFA"). The distribution of the Prospectus and other documents relating to the Fund, including this presentation, will therefore be
restricted by the SFO and the SFA in Hong Kong and Singapore respectively.
The forecasts provided / proposed investments are based upon our opinion of the market as at this date and are subject to change and dependent on future
changes in the market. Any prediction, projection or forecast on the economy, stock market, bond market or the economic trends of the markets is not
necessarily indicative of the future or likely performance. Investments are subject to risks, including possible loss of principal amount invested. The value of
shares/ units and their derived income may fall as well as rise. Past performance or any prediction or forecast is not necessarily indicative of future
performance. No assurance is given that the investment objective or the targets will be met.
28Disclaimer
This document does not constitute investment, tax, legal or any other form of advice or recommendation and was prepared without regard to the
specific objectives, financial situation or needs of any particular person who may receive it. Investors should study all relevant information and
consider whether the investment is appropriate for them. If you require investment or financial advice please contact a regulated financial adviser.
Duxton or its affiliates may hold positions in the securities referred. Where stocks are mentioned, it should not be construed that these are
recommendations to buy or sell those stocks. The investment schemes referred are not obligations of, deposits in, or guaranteed by Duxton or any of
its affiliates.
You are not authorized to redistribute this document nor qualified to make any offer, representation or contract on behalf of Duxton or its
affiliates. Although the information was compiled from sources believed to be reliable, no liability for any error or omission is accepted by Duxton
or its affiliates or any of their directors or employees. The information and opinions contained may also change. All third party data (such as MSCI,
S&P & Bloomberg) are copyrighted by and proprietary to the provider.
Copyright protection exists in this presentation. The contents of this presentation are strictly confidential and it may not be disclosed, reproduced,
distributed or published by any person for any purpose without our written consent. To the extent permitted by applicable law, none of Duxton
Asset Management, their affiliates, or any officer or employee of Duxton accepts any liability whatsoever for any direct or consequential loss arising
from any use of this presentation or its contents, including for negligence.
29You can also read