INVEST IN ITALY THE RIGHT PLACE, THE RIGHT TIME FOR AN EXTRAORDINARY OPPORTUNITY 2018
←
→
Page content transcription
If your browser does not render page correctly, please read the page content below

INVEST
IN ITALY
THE RIGHT PLACE, THE RIGHT TIME
FOR AN EXTRAORDINARY OPPORTUNITY
2018

             INVESTINITALY.COM
SUMMARY

THE RIGHT PLACE

TOP GLOBAL ECONOMY
EXPORT POWERHOUSE
WORLD CLASS MANUFACTURER
STRATEGIC GATEWAY

THE RIGHT TIME

PRO INVESTMENT INCENTIVES
INCREASING FDI

THE OPPORTUNITIES
INNOVATION CAPACITY
INDUSTRIAL DISTRICTS
INFRASTRUCTURE: TRANSPORT & DIGITAL
PUBLIC UTILITIES

                                          3

DOING BUSINESS IN ITALY

THE
                            investment guide 2018

RIGHT
PLACE

TOP GLOBAL ECONOMY
EXPORT POWERHOUSE
WORLD CLASS MANUFACTURER
STRATEGIC GATEWAY
                                             5
INVEST IN ITALY
  THE RIGHT PLACE, THE RIGHT TIME FOR AN EXTRAORDINARY OPPORTUNITY

TOP GLOBAL
ECONOMY

  Italy is a land of extraordinary beauty,
  taste and talent, but it is also one of
  the world’s top economies. With a GDP
  of over € 1.7 trillion and a population
                                                              THE IN’S AND OUT’S OF ITALIAN LEADERSHIP
  of more than 60 mln, Italy is the
  world’s 9th largest economy.                                                       about € 450 bln
                                                                     OUT             of export (goods)
                                                                                     across the globe

CONSISTENTLY RANKED IN THE WORLD’S                                   IN              about € 58 mln
TOP TEN                                                                              tourists welcomed into Italy

2nd       largest manufacturer in Europe
                                                             Operating in Italy means access to the
3rd       largest economy in Eurozone                        world’s largest single market.

5th       largest manufacturer in World

1st       number of UNESCO World Heritage Sites              Businesses in Italy have duty free access to more than
                                                             30 national markets within the European Economic
                                                             Area and over 500 mln consumers.
3rd       international overnight stays in Europe
                                                             Italy has produced many of the world’s leading multina-
                                                             tionals such as ENI, Fiat Chrysler, Luxottica and Leonardo
5th       tourist destination in World                       (former Finmeccanica) and it also attracts other top multi-
                                                             nationals, particularly in advanced and high-tech sectors.

      6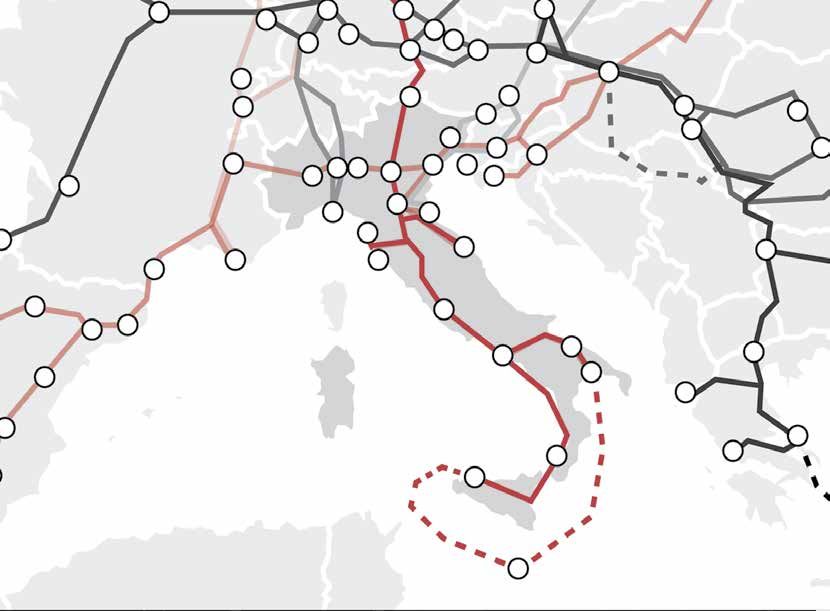
THE RIGHT PLACE
                                                                                                             TOP GLOBAL ECONOMY

Industrial foreign affiliates in Italy employ 11% of total   BREAKDOWN OF TOTAL AGGREGATED DEBT
workers, produce more than 20% of domestic turnover          (2017/2018*, % of GDP)
and account for 26% of exports.
                                                              450
                                                                        394
                                                              400
                                                              350
Italy has increasingly healthier public                                            288
                                                              300                              260
finances and low aggregated debt.                                                                        254        250        244
                                                                                                                                       243
                                                              250
                                                              200                                                                               167

                                                              150
• Net wealth of Italian households is about 8 times
                                                              100
  their disposable income, higher than in the United
  States, Germany and Canada.                                   50

• Italian households are less leveraged than in other             0
                                                                      Japan France USA Spain                         UK        Euro    Italy Germany
  OECD nations: 41% of disposable income vs. 86% in                                                                            Area
  the UK.
                                                                Government                    Households                       Non financial contractors

                                                             (*) Government (2018), Private (2017)
                                                             Source: Rapporto sulla stabilità finanziaria 1/2018 - Bank of Italy

                                                                                                                                        7
INVEST IN ITALY
    THE RIGHT PLACE, THE RIGHT TIME FOR AN EXTRAORDINARY OPPORTUNITY

EXPORT
POWERHOUSE

    Italy is one of only five countries
    in the world whose manufactured
    products have an export trade surplus
    (over € 47 bln).                                           Italian export annual growth rate improved by 2,41% in
                                                               2016.
                                                               In 2017 it registered an increase of +5,45%, performing
                                                               better than Germany and France, respectively at +2.63%
                                                               and +1.85%.

Over the last decade our companies have been innovating,        EXPORT ANNUAL GROWTH RATE
modernizing and creating new specializations making             (2016 vs 2017, AGR on Value of goods and services,%)
Italy one of Europe’s champions in export trade. Total
exports are more than € 500 bln and the exports of goods               Italy                              +5,45%
                                                                                                          +2,41%
in 2017 exceeded € 450 bln.
                                                               Germany                                    +4,62%
                                                                                                          +2,63%

                                                                  France                                  +3,12%
                                                                                                          +1,85%
GROWTH ITALIAN EXPORTS OF GOODS
(2011-2017, Value of goods, Billion euros)                                             2017   2016

   2011                              376                      Source: The World Bank

   2015                                      414               • Mechanical Machinery exports grew to € 80 bln in 2017
                                                                 (+ € 15 bln compared to 2015)
   2017                                         450            • Pharmaceutical exports doubled between 2009 and 2017
                                                                 up to € 24 bln
                                                               • Vehicles exports increased to € 23 bln in 2017 (+€ 4 bln from
                                                                 2015)

        8
THE RIGHT PLACE
                                                                             EXPORT POWERHOUSE

CONSISTENTLY RANKED IN THE EXPORT                    ITALY’S TOP 10 TRADE PARTNERS, BY VALUE
WORLD’S TOP TEN                                      (2017)

                                                                  1    Germany
2nd   largest world footwear exporter
                                                                  2    France
2nd   largest world wine exporter                                 3    USA
3rd   largest world yacht exporter                                4    Spain
                                                                  5    UK
3rd   largest world fashion exporter
                                                                  6    Switzerland
3rd   largest world electrical appliances exporter
                                                                  7    China
4th   largest world metal products exporter                       8    Belgium
4th   largest world furniture exporter
                                                                  9    Poland
                                                                  10   Netherland
5th   largest world mechanics exporter
                                                       Source: ISTAT

                                                                                            9
INVEST IN ITALY
    THE RIGHT PLACE, THE RIGHT TIME FOR AN EXTRAORDINARY OPPORTUNITY

WORLD CLASS
MANUFACTURER
    Italy is Europe’s 2nd largest
    manufacturer after Germany, and the
    5th top manufacturer in the World.
                                                                      FROM FASHION DESIGN TO MACHINE AND
                                                                      PHARMACEUTICALS EXPORTS
Despite the entrance of new competitive players from                 (2009-2017, Value of goods, Billion euros)
emerging countries, Italy has maintained its position in      € 90

the World’s Top 10 Manufacturers for over 30 years due        € 80

to the renowned excellence and quality of Italian goods.
                                                              € 70

                                                              €60

                                                              € 50

Made in Italy Manufacturing means                             € 40

excellence in many sectors.                                   € 30

                                                              € 20

                                                              € 10

Made in Italy is not only Fashion, Food and Furniture. The
                                                               €-
industrial sector has undergone a profound transformation                  2009             2011             2013            2015        2017
and is also Machinery, Pharmaceuticals and High-Tech.
In recent years, traditional Made in Italy sectors, like                   Mechanical Machinery                  Fashion            Chemistry
textiles and furniture, have thrived as they converted into                Vehicles                              Pharmaceuticals
high added-value segments while specialized sectors
                                                                     Source: Ministry of Economy Development on Istat data
like mechanical machinery, pharmaceuticals and high
technology have grown into important national industries.

                                                                                                          Ministry of
                                                                                                          Economic
       10
                                                                                                         Development
THE RIGHT PLACE
WORLD CLASS MANUFACTURER
Leading the way to sustainable Concerning the european manufacturing trade balance of
one thousand industrial areas Italy positions itself at the
production systems. second place, following Germany. Considering the first 20
of these high technical manufacturing areas, in fact, 8 are
italian.
Italy is one of the most eco-efficient producers in Europe,
producing 101 tons of CO2 for every million euros produced
vs. 143 tons for Germany and 113 tons for the UK.
Source: Fondazione Symbola, Unioncamere e Fondazione Edison on Greenitaly report 2017
on data 2014
1 1st European producer of
Italy is the World’s 2nd most competitive pharmaceutical goods
producer of industrial machinery
(packaging, food, textiles, etc.) after Germany
(Trade Performance Index UNCTAD/WTO). 2nd overall European Manufacturer
Italy is the 3rd largest European chemical
producer with an annual turnover of over 52
billion euros.
11INVEST IN ITALY
THE RIGHT PLACE, THE RIGHT TIME FOR AN EXTRAORDINARY OPPORTUNITY
STRATEGIC
GATEWAY
Located at the centre of the
Mediterranean Sea and with 40 major
ports and 42 airports, Italy is a strategic
gateway for trade between Europe,
Thanks to the large number of maritime,
North Africa and the Middle East.
airport and logistic nodes as well as to
numerous air and maritime origin-destination
international links, Italy has a high degree of
openness to international markets.
4 Four out of nine European Core Network Corridors (TEN-T)
run across Italy.
60%
Capillary railway network, most of which (approximately 60%)
is part of strategic European corridors (TEN-T CNC).
14 maritime ports are listed within priority nodes at European
14 level (Core Network); no infrastructural capacity constraints
to limit maritime traffic flows (in particular for transshipment
container traffic).
10 10 airports are listed within priority hubs at European level
(Core Network).
12THE RIGHT PLACE
STRATEGIC GATEWAY
Thanks to highly attractive destinations
for tourists, more than a billion
passengers are served annually by the
Italian transport system.
PASSENGER FLOWS
67 mln (2016) 1
st
849 mln (2016)
Italy is first in Europe for the number passengers/year travelling on the national
of seaborne passengers embarked and rail network
disembarked
29% (2016) 1st
134 mln (2016)
of the cruise passengers in Europe embark
passengers/year travelling through Italian
and disembark in Italian ports, by far Italy is
airports
the first cruise market in EU
Source: Eurostat, ISTAT, Documento di economia e finanza 2017 (MEF), MIT
FREIGHT FLOWS
432 mln tonnes
of goods traded with foreign countries
(in value 54% related to the Euro area)
>10 mln
Source: Eurostat, ISTAT, Documento di economia e finanza 2015 (MEF)
TEUs* 2017
(*) TEU = Twenty-foot Equivalent Unit
Source: Assoporti 2018
13DOING BUSINESS IN ITALY
THE
investment guide 2018
RIGHT
TIME
PRO INVESTMENT INCENTIVES
INCREASING FDI
15INVEST IN ITALY
THE RIGHT PLACE, THE RIGHT TIME FOR AN EXTRAORDINARY OPPORTUNITY
PRO INVESTMENT
INCENTIVES
Together with reforms Italy has
introduced numerous financial
Tax Incentives
incentives aimed at increasing
the attractiveness of foreign direct
Employment
investments, encouraging research
Cut of labor costs for employers hiring people on
and development and fostering the a permanent basis, with increasing deductions
growth of new innovative enterprises. for women. Bonus for employers who hire young
workers (under 35 in 2018, under 30 from 2019)
equal to the 50% on tax relief on social security
contributions or to the 100% for the South of Italy.
Hyper and Super Depreciation Energy efficiency
Deductions for taxpayers who invest to improve
Hyper-depreciation: 250% efficiency of existing building up to the 75%.
over-valuation of investments Patent box regime
in newly purchased or leased Tax incentive on the income derived from licensing
tangible assets, devices and or direct exploitation of intangible assets (patents,
technologies enabling the Industry know-how, trademarks) consisting in a reduction of
the IRES and IRAP taxes up to 50%.
4.0 transformation.
Recapitalization of companies
Super depreciation: 130% over- Tax incentives for equity capital increase.
valuation of investments in newly
R&D
purchased or leased capital goods.
50% tax credit on R&D incremental expenses
Companies with access to incurred in the period 2017-2020 up to max €20
hyper-depreciation, may benefit mln/year calculated on a fixed basis given by the
from a 140% over-valuation for average of R&D expenses in the period 2012-2014
investments in intangible assets (highly qualified personnel, lab instrument and
equipment, know-how, patents, activities from
(software and IT systems). universities, public research or innovative start-ups).
16THE RIGHT TIME
PRO INVESTMENT INCENTIVES
Project Investment Incentives Start-up
New industrial projects Italy has been working on a legislation to
The Development Contract Program supports support an ecosystem of innovative start-ups
large and innovative investments in with high technological content.
manufacturing, tourism and environmental
protection for greenfield and expansion Innovative start-ups must have the following
projects of more than €20 mln (€7.5 for features:
Food processing). It consists of one or more • New business, or operational for less than 5
connected and functional projects (investment
years;
+ R&D), also presented in joint form. The
investment type and company size may affect • HQ or at least a production site branch in
the aid intensity (companies of any size can Italy;
benefit of higher incentives if they invest in • Yearly turnover under €5 mln;
Southern Italy). The incentives consist of grants • Not listed on a regulated market;
and soft loans for an amount up to 75% of the • Do not distribute profits;
total eligible expenses. The final amount will
• Are not the results of a company merger split
be the result of the negotiation process held
by Invitalia (managing authority). up and selling off;
• Make a clear character of technological
Projects presented by foreign companies, innovation.
providing a min €50 mln investment, gain
access to the “fast-track” procedure (time plus at least one of the following criteria:
Shortening valuation, ad hoc resources jump • 15% of annual costs in R&D;
of the queue). • 1/3 of the workforce are PHD or researchers;
More info at www.invitalia.it • Owner depositary or licensee of a patent.
Incentives for capital goods An example of benefits for start-ups:
• Smart&Start Italia (financial incentive by
Invitalia);
Government grants are available for SMEs
• Italia Startup Visa;
that want to buy new machinery, plant or
equipment in order to partly cover interest • Cuts on red tape and fees;
on bank loans relating to the investments • Flexible corporate management;
made. Companies can also access the public • Easier to clear systematic losses;
mechanism of loan guarantees for SMEs (the • Exemption from regulations on dummy
so-called “Nuova Sabatini”). companies;
• Tax options and work for equity schemes;
• Tax credit for highly-qualified staff;
• Fast track access to the public guarantee
fund for SMEs.
For further information please see Doing Business in Italy - Guide available at www.investinitaly.com
17INVEST IN ITALY
THE RIGHT PLACE, THE RIGHT TIME FOR AN EXTRAORDINARY OPPORTUNITY
INCREASING FDI
In 2014, Italy had the highest growth
rate among European countries of
inward greenfield FDI projects at
+31% (FDI Report, 2015), reflecting Growing investment trends
confidence in the pro-business, pro-
investment actions underway. In 2016 Italy registered a foreign direct investment
increase of about 50%, reaching $29 bln and climbing
. 5 positions in the world ranking, placing itself as 13th.
FDI CONFIDENCE INDEX FOR ITALY
(2016-2018, Foreign direct investment, Index)
Source: A.T.Kearney Moreover, two-thirds of capital raised from the market
(roughly €922 mln) was undertaken by foreign investors
while the rest represents national contributions.
2018 10th
Place
CAPITAL RAISED BY ORIGIN
(2012-2016, capital raised, %)
11%
26%
13th 2017
89%
74% 48%
Place
68% 52%
32% 37%
63%
2012 2013 2014 2015 2016
Italian International
2016
16th Source: AIFI
Place
18THE RIGHT TIME
INCREASING FDI
Global investors can find an effective support
A New Approach to FDI Governance
in each phase of the investment process.
High Level Governance
To support the governance and attraction of FDI,
a high level Interministerial Committee, chaired OUR SUPPORT TO
by the Ministry of Economic Development, FOREIGN INVESTORS
under the supervision of the Prime Minister
office, has been set up to define foreign
investment strategies, propose pro-business
reforms and support specific important projects. Pre-investment information
· Market and business environment
· Target sectors
One single front office · Aspects of the tax, legal system and labour market
· Incentive programme framework and financial
Thanks to the agreement between ITA (Italian scouting.
· Italy's competitive advantages
Trade Agency) and Invitalia a one stop shop for
foreign investors at the Italian Trade Agency
takes care of the full investment cycle: collecting
Business set-up
investor inquiries, preparing tenders and · Location scouting & site visit
managing after care for incentives, contacts · Authorisations
· Permits for foreign investors
with Administrations etc. Integrated CRM allows · Human Resources research
collaboration with regional FDI agencies to locally · Liaison Office with Public Administration
support investors.
A global network of offices After care
Contact offices are located in the world’s major · Networking through diplomatic networks
· Recruitment, skills and training support
financial centers to promote investment opportunities · Cultural mediation
in Italy among the local business community.
You can reach us through our 81 branches in 67
countries, there to ensure a worldwide coverage and
customized services.
FOREIGN DIRECT INVESTMENT UNIT
Through its FDI Desks, ITA facilitates the establishment and the development of foreign companies in Italy:
• promoting business opportunities
• helping foreign investors to establish or expand their operations
• supporting investors throughout the investment life cycle
• offering high-level tutoring services for existing strategic investments
19DOING BUSINESS IN ITALY
investment guide 2018
THE
OPPORTUNITIES
INNOVATION CAPACITY
INDUSTRIAL DISTRICTS
INFRASTRUCTURE: TRANSPORT & DIGITAL
PUBLIC UTILITIES
21INVEST IN ITALY
THE RIGHT PLACE, THE RIGHT TIME FOR AN EXTRAORDINARY OPPORTUNITY
INNOVATION
CAPACITY
Italy is an innovation and research
intensive nation, spending over €25
bln per year in R&D.
Italy offers a world class R&D environment. Our annual R&D R&D EXPENDITURE
expenditures of over €20 bln is amongst the highest in the (2016, R&D expenditure by sectors of performance, million euro, %)
world and, in absolute values, ranks Italy as 10th in the OECD
647
and 4th in Europe in R&D investments.
2,855
3%
13%
Italian researchers are the world’s
most productive. 21,611
100%
According to the International Comparative 5,519 12,590
Performance of the UK Research base, Italian
researchers rank in top position in the world index 26% 58%
for the number of published articles and citations per
researcher and R&D expenditure. Business Public Institutions
Universities Private Foundations
Source: Eurostat
22THE OPPORTUNITIES
INNOVATION CAPACITY
The Italian economic network is highly developed and Manufacturing has always been the driving force of the
suitable for innovation: there are several innovative Italian economy, including innovation. The utilization rates
incubators and science and technology parks, linked to of digital technologies in production processes reveal a
universities, local development agencies or acting as significant predisposition of manufacturing firms towards
private companies, some of which have recently been new technological paradigms.
listed on the capital market. The “Digital Renaissance” concept has been acknowledged
The Italian innovation system generates thousands of spin- by the manufacturing sector and by a large number of firms:
offs and startups that transfer knowledge and technology almost 40% of them use 3D printers, while 25% employ
to the market. Moreover, the innovative enterprises are robotic technologies.
supported by an extensive set of incentives.
GROWING WORLD CLASS HIGH TECH CLUSTERS
Aerospace Biotech
4th player in Europe 571 biotech companies
15 bln euro revenues 11.5 bln euro revenues
2.7 bln euro investments 1.5 bln euro investments
52,000 People 12,000 People
18.2% of employees in the manufacturing sector held Italy, with its 8,307 patents filed, is placed 11th worldwide,
technology-intensive activities (2nd after Germany with a while in Europe ranks 4th behind Germany, UK and France.
share of 19.1%).
HIGH TECHNOLOGY-INTENSIVE ACTIVITIES: EUROPEAN MANUFACTURING
(2017, % Employees holding technology-intensive activities)
25
19.1 18.2
20
17.1
15.4
15 12.3 12.7
9.1 5.7
10
4.4 4.4
5 2.7 3.9
1.5 1.4
0
UK France Germany Spain Italy Portugal Avg EU28
Agriculture Manufacturing
Source: Science, Technology and Innovation Database, Eurostat
23INVEST IN ITALY
THE RIGHT PLACE, THE RIGHT TIME FOR AN EXTRAORDINARY OPPORTUNITY
INDUSTRIAL
DISTRICTS
Over 140 Industrial Districts with more than
1 million firms represent nearly a third of
the entire Italian manufacturing system.
The 141 industrial districts in Italy bring small and
large companies together in interdependent and Industrial Districts are high value-added
cooperative production systems. They are one of
Italy’s unique industrial strengths - spontaneous players in Italy’s production system.
aggregations of companies competing and cooperating
to foster specialization and excellence. Not only do
these districts contribute to the high performance and The vast majority of industrial districts represent
innovation in Italian manufacturing, but they also the backbone and productive centers behind world
employ nearly 5 mln people. renowned Made in Italy products and brands, from
mechanical machinery to clothing and foot-wear.
Italian Industrial districts are very
dynamic: their export trends
outspace those of the overall Italian
manufacturing sector.
24THE OPPORTUNITIES
INDUSTRIAL DISTRICTS
SECTOR BREAKDOWN OF INDUSTRIAL DISTRICTS Companies in Industrial Districts boast a better
(2016, %) performance vs. traditional companies. In 2016,
companies in Industrial Districts had higher ROI
6% compared to traditional ones (5.9% vs. 5.8%).
17%
PERFORMANCE (AVERAGE ROI)
25% (2011-2016, ROI, %)
6.1
6
5.8 5.9
14% 4.4 4.4
38%
Food products Mechanical machinery
Clothing and shoes Other
2012 2014 2016
Home furnishings
Industrial district Traditional companies
Source: Banca Intesa San Paolo Source: Banca Intesa San Paolo
25INVEST IN ITALY
THE RIGHT PLACE, THE RIGHT TIME FOR AN EXTRAORDINARY OPPORTUNITY
INFRASTRUCTURE:
TRANSPORT
432 millions tons of goods and 1 billion
people move in, out and around Italy
each year.
The key competitive factors of Italy’s Central position in the Mediterranean
transport system.
Progressive speeding up of transport system
• High speed railways 20% world maritime traffic
• Barrier free motorways
• Airport-Rail links to urban nodes 30% fuel traffic
Strategic position & openness to international trade 25% container line services
• Railway interoperability with Europe Source: Confitarma 2018
• Relevant positioning in core European corridors
• High number of incoming-outgoing logistic
nodes and international relationships
Image: The European Ten-T Network
26THE OPPORTUNITIES
INFRASTUCTURE: TRANSPORT
MARITIME 1st in Europe for number of cruise
passengers
3,7 mln cruise passengers
The Italian maritime infrastructure includes more than 40 embarked and disembarked in Italy
major trade ports located along 8,122 km of coastline, 21
of which offer international line services (14 are part of the 1st in Europe as home port with a
European strategic network). 29% market share
This way, Italy is able to offer both gateway services for
in Europe for overall number of
the Mediterrean Sea trade flows as well as transshipment 1st
functions for international container traffic. passengers
Italy is the leading European country in Roll-on/Roll-off
traffic for number of ship owners (157) and number of
3rd in Europe for total tonnage handled
ships (2,700).
AVIATION
By 2030, passenger air traffic is
forecasted to nearly double to 300 mln
With 170 mln passengers expected in 2018, Italy passengers.
confirmed its 4th place in Europe for traffic volumes and
is one of the few countries among the major European
markets that recovered the level of passenger traffic
recorded before the global financial crisis. €9 bln invested in the strengthening
With a total of 42 airports, 10 of which are included in and upgrading of Commercial Airport
the European core network, the Italian airport network hubs.
offers 1 airport every 1.27 mln residents and every 6,400
square km.
ROAD RAIL
With 6,600 km of motorways and 21,500 km of national Every year, 852 mln passengers (4th place in Europe)
roads, Italy represents 10% of the European roads network. and nearly 92 mln tons of goods (5th place in Europe)
We are third in Europe for motorway density (22.1 km of travel on the Italian railway system (2014).
motorway line per 1000 square km), ranking above the
The Italian railway system is an advanced and capillary
European average and countries like France and the UK.
infrastructure system which is superior to the European
Road transport recorded was equal to 58.7 bln vehicles-km. average in terms of percentage of electrified lines
and equipment systems harmonized with European
interoperability standards.
27INVEST IN ITALY
THE RIGHT PLACE, THE RIGHT TIME FOR AN EXTRAORDINARY OPPORTUNITY
INFRASTRUCTURE:
DIGITAL
Italy precedes the other European
countries in adopting the most
advanced mobile network technology
Over the past few years, all the
Italian telephone service providers
Italy was the first European country to start the 5G have relaunched LTE investments.
experimentation, anticipating other European countries The main three operators reached a
on the European Action Plan that invited the Member LTE coverage between 54% and 90%
States to identify by 2018 at least one city in which to of population each.
tackle the 5G experimentation.
The objective of the National Strategy
in relation to the Ultra Broadband is
to guarantee, by 2020, a coverage
utilizing ultra-fast networks of over
100 Mbps for at least 85% of the
Italian population, and a coverage
of at least 30 Mbps for the entire
The first Italian cities will be covered by 5G technology Italian population. Moreover, its
as early as 2019 and by 2022 the dissemination project task is to guarantee a coverage over
will be completed throughout Italy. 100 Mbps to all public offices and
buildings, industrial centres, areas of
economic interest and demographic
concentration, as well as to the main
tourist locations and logistics hubs.
28THE OPPORTUNITIES
INFRASTRUCTURE: DIGITAL
Italy is above European average regarding fixed
Accelerating to become 100% Digital broadband coverage (99% vs. 97%) and above the
european average regarding the fast broadband
coverage, NGA (87% vs. 80%).
Italy has aligned with other European countries in the (*Next Generation Access)
development of digital government services and increased
transparency. To push the Digital Agenda further and reach
Horizon 2020 objectives, Italy is investing €4.5 bln over FAST BROADBAND COVERAGE, NGA
2014-2020 to continue to improve infrastructure, digital (2018)
services and citizen’s digital education and uptake. Italy 87%
Avg EU28 80%
Milan: one of Europe’s most wired city for
ultra band FIXED BROADBAND COVERAGE
(2018)
Italy 99%
Avg EU28 97%
Source: DESI Report 2018
29INVEST IN ITALY
THE RIGHT PLACE, THE RIGHT TIME FOR AN EXTRAORDINARY OPPORTUNITY
PUBLIC
UTILITIES
The Italian energy market is large,
liberalized and focused on renewable
energy sources.
Production, trade and retail activities in the Italian energy ELECTRICITY GROSS PRODUCTION IN EU
market are fully liberalized, while transmission and (2017, european share market producers, %)
distribution services are subject to concession schemes.
With incentives to encourage sector investments and
M&As, investments in 2013 grew to €5.7 bln Germany
from €4.2 bln in 2012 (+6.8%) and represented nearly Others
1.7% of national total investments. 20%
Source: Top Utility Analysis report
36%
France
17%
Electricity and production
Poland
Italy is one of the principal electricity producers in the
Eurozone. 5% Italy
Current national production fulfills 87% of national Sweden
Spain 9%
demand - 37 mln customers. 5% 8%
Second only to Germany and France, Source: Elaborations Rie-Ricerche Industriali ed Energetiche on data BP Statistical Review 2018
Italy is one of the main electricity
producers in the euro area.
30THE OPPORTUNITIES
PUBLIC UTILITIES
Natural Gas
2nd Producer of solar energy in Europe Annual natural gas consumption is about 61,9 bln (m³)
and represents 15 % of the European demand for natural
gas.
In renewable energy generation
2nd among G7 countries
Producer of electrical power Renewable resources
3rd in Eurozone 43% of Italy’s net energy production is due to
renewable energies; together with natural gas, they
Producer of geothermal energy,
3rd represent 76% of total national production.
bioenergy and other renewable energy
4th Country for energy demand in Europe Among the G7 countries, Italy is second only to Canada
in renewable energy generation.
Producer of hydroelectric energy
4th in Europe The national energy strategy is a boost for the
realization of important investments, increasing the
In Europe for fresh water resources trend scenario with additional total investments of
5th €175 bln to 2030, as follows:
• €30 bln for gas and electric networks and
Water infrastructures,
• €35 bln for renewable sources,
Italy is ranked 5th in Europe for freshwater resources
and 16th in the world. • €110 bln for energy efficiency.
Average water availability per capita is equal to 297 Over 80% of investments are therefore aimed at
litres/day. increasing the sustainability of the energy system:
these are sectors with high employment impact and
technological innovation.
31Foreign Direct Investment Department
via Liszt, 21 00144 Roma
t +39 06 5992 1
f +39 06 8928 0313
www.ice.it
fdi@ice.it
attrazione.investimenti@ice.it
investinitaly.com
investinitalyrealestate.com
Follow us on Twitter! @ITAtradeagency
Follow us on Twitter! @ITAinvestItaly
ITA - Italian Trade Agency
ITA - Invest in Italy
Figures at May 2018
Published July 2018
The contents of this guide are the exclusive property of the ITA- Italian Trade Agency
© copyright - ITALIAN TRADE AGENCYYou can also read