INVESTMENT STRATEGY BRIEF: Outlook 2021: Reflections and A Way Forward - Stifel
←
→
Page content transcription
If your browser does not render page correctly, please read the page content below
January 19, 2021

                                          Insights from Stifel’s CIO Office

                                         INVESTMENT STRATEGY BRIEF:
                                         Outlook 2021: Reflections and A Way Forward

   Michael O’Keeffe, CFA      Nik Eftimov, CFA                 David Motsonelidze, CFA
   Chief Investment Officer   Senior Investment Strategist     Director of Macro Strategy
   Jared Brent                Brian Moody                      Sneha Jose
   Investment Strategist      Investment Strategist            Director of Behavioral Finance
INVESTMENT STRATEGY BRIEF                                                                       1
Table of Contents
                         Outlook 2021
                            page 3
                      The 2020 Election
                           page 11
                       COVID-19 Update
                           page 13
                      Macro Environment
                           page 17
                           Markets
                           page 28
                      Dynamic Leanings
                          page 32
                       Finding Our Guidance
INVESTMENT STRATEGY BRIEF     page 36                             2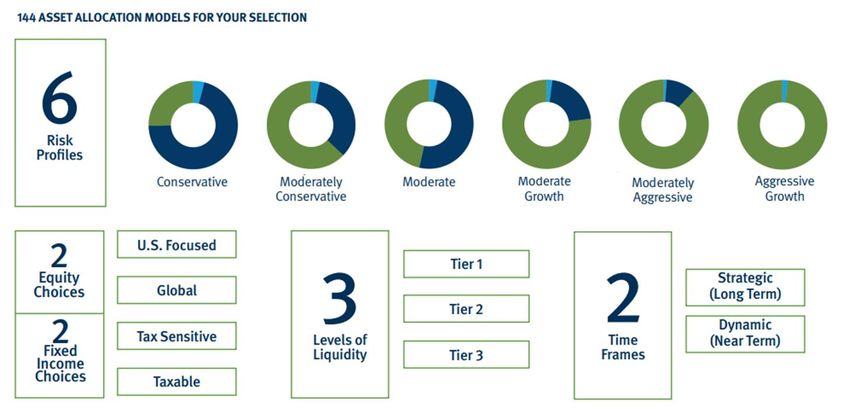
Outlook 2021:
               Reflections and A Way Forward

INVESTMENT STRATEGY BRIEF                      3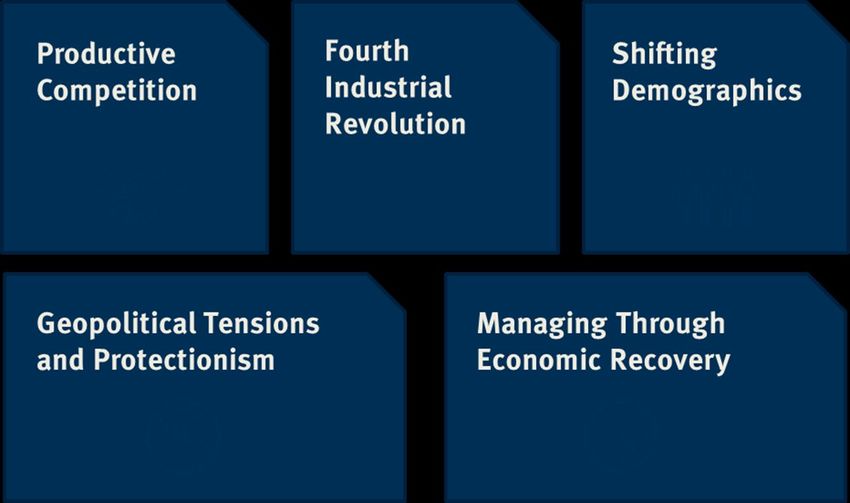
Stifel Outlook 2021 Report
Content: Stifel Outlook 2021, the video, and the replay of our
 recent client webinar
 • 2020 Year in Review
 • 2021 Outlook
 • Allocation Insights
 • 2020 Elections: Investment Implications for 2021
 • The Coronavirus: Impact on Our Major Investment Themes
 • Navigating the Geopolitical Landscape
 • Handling Uncertainty and Unknowns With Behavioral Finance
 • Tenets of an Investment Strategy

INVESTMENT STRATEGY BRIEF                                         4

Coronavirus/Major Investment Themes

                      VIEW REPORT   VIEW VIDEO
INVESTMENT STRATEGY BRIEF                        5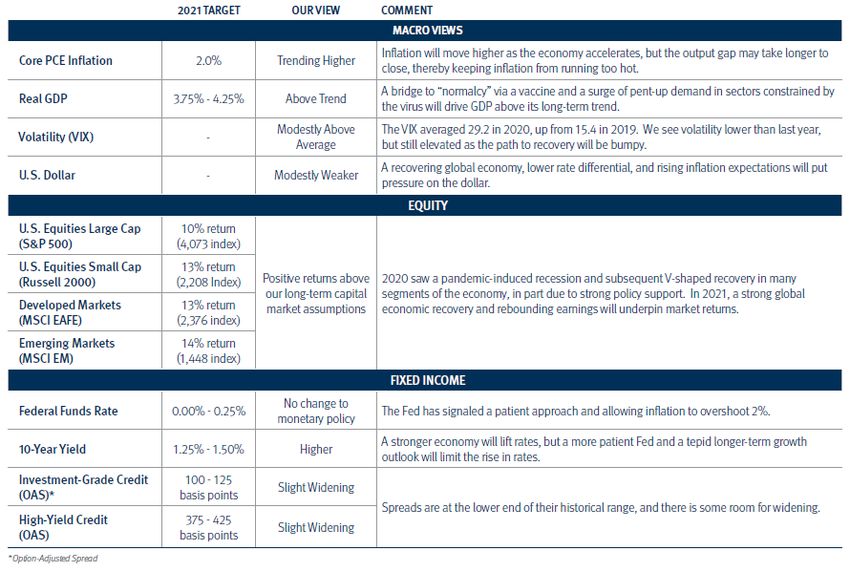
Geopolitical Landscape

                      VIEW REPORT   VIEW VIDEO
INVESTMENT STRATEGY BRIEF                        6
Handling Uncertainty: Behavioral Finance
VIEW REPORT VIEW VIDEO
INVESTMENT STRATEGY BRIEF 7Tenets of an Investment Strategy
VIEW REPORT VIEW VIDEO
INVESTMENT STRATEGY BRIEF 8Stifel Outlook 2021 Report Our Outlook 2021 – Three Scenarios Base Case (70%) • Successful vaccination campaign in the U.S. and abroad • Federal government support of the economy continues • President-elect Biden prioritizes economic recovery • Geopolitical tensions and policy uncertainty decreases Bull Case (15%) • A faster timeline to herd immunity • Back closer to “normal” for Consumers • Even more business spending Bear Case (15%) • A meaningful delay in vaccination efforts • COVID-19 cases continue to surge • Business and economic headwinds remain • “Animal Spirits” impacted INVESTMENT STRATEGY BRIEF 9
Our Outlook 2021 – The Numbers

INVESTMENT STRATEGY BRIEF                                    10
The 2020 Election

INVESTMENT STRATEGY BRIEF                  11
2020 Election
WHITE HOUSE CONGRESS
Joe Biden – 306 Electoral College Votes ■ HOUSE OF REPRESENTATIVES
Donald Trump – 232 Electoral Votes
222 211
Seats Seats
FDR tradition to focus on first 100 days
o “honeymoon” period for new
presidents…use political capital to progress 233 197
Previously
important items Previously
Biden focus: pandemic and vaccinations 2 seats haven’t been called yet by the
Associated Press
Other plans include:
■ SENATE
o $1.9 trillion economic relief package
Includes $1,400 stimulus checks and
raising the minimum wage to $15/hour
o Executive actions related to reopening
50
Seats*
50
50 Seats
Seats
schools and business
o Rejoining the Paris climate change
agreement and World Health Organization
47
Previously*
53
Previously
o Reversing President Trump’s Travel Ban * Includes Independents who caucus with Democrats
INVESTMENT STRATEGY BRIEF 12COVID-19 Update INVESTMENT STRATEGY BRIEF 13
Coronavirus Monitor

Source: Stifel Investment Strategy via Institute for Health Metrics   Source: Stifel Investment Strategy CDC, as of January 15, 2021
and Evaluation (IHME), as of December 23, 2020

INVESTMENT STRATEGY BRIEF                                                                                                     14
Coronavirus Monitor

Source: Stifel Investment Strategy via Bloomberg, Fundstart and CDC, as of January 19, 2021; U.S. state and national level data shown in the
dots above. *Estimated infection rate equals detected infections times 4. (Source: Fundstart)
INVESTMENT STRATEGY BRIEF                                                                                                            15
Medical Research
  • Genome sequencing - in less than 10 days mapped the COVID-19 DNA
  • Currently 219 companies pursuing vaccines
Coronavirus Vaccine Tracker
                                                                                               LIMITED
  PRECLINICAL              PHASE 1                PHASE II              PHASE III                                    APPROVED
                                                                                              APPROVAL

      120+                      41                     22                     20                      8                      2
 Vaccines not yet in    Vaccines testing         Vaccines in          Vaccines in large-    Vaccine approved for   Vaccine received
    human trials       safety and dosage       expanded safety       scale efficacy tests   limited use in China E.U.A. in the U.S. and
                                                    trials                                       and Russia      UK, fully approved in
  • A typical timeline to develop and approve a vaccine is 10-15 years                                                    UAE
  • 6 companies in operation Warp Speed have agreements to deliver 500 million complete vaccines to the U.S.
    government
  • Pfizer and Moderna have received Emergency Use Authorization (EUA) from the Food and Drug Administration
    (FDA) for their vaccines
        • White House and CDC now allow all individuals aged 65 and older to be vaccinated
        • 12,279,180 doses administered as of January 15, 3.74% of U.S. Population
        • Total U.S. infections of 24,087,970
        • Herd Immunity is estimated to be 60% - 70%, current vaccinated and infected is roughly 10.8%
  • 319 companies are pursuing treatments: purpose specific vs. designed for other diseases
       • 41 trials are in Phase III
       • Gilead Sciences’ antiviral drug Remdesivir was approved by the FDA on October 3rd
              • Eli Lilly’s antibody therapy Bamlanivimab received EUA for treatment of mild-moderate COVID-19 cases
 Source: Stifel Investment Strategy data via Milken Institute, New York Times, CDC, and History of Vaccines as of January 19, 2020
 INVESTMENT STRATEGY BRIEF                                                                                                            16
Macro Environment INVESTMENT STRATEGY BRIEF 17
Macro, Markets, and Themes
MACRO                                          MARKETS                                    THEMES
U.S. Economy                                   Market Environment                         Themes
• Q3 2020 GDP at 33.4%                         • Increased volatility                     • Productive Competition
• Peaking jobless claims                       • Modestly higher returns forward          • Fourth Industrial Revolution
• Declining unemployment rate                  • Exited bear market                          …and Globalism
• Non-farm Payrolls 283,000 (rolling 3-                                                   • Shifting Demographics
  month total)                                 Equity Market
                                                                                             …and Millennials
• Wage growth, 5.1%                            • Earnings growth recovering, valuations
                                                                                          • Geopolitical Tensions
• Inflation higher, 1.6% (Core CPI)              picking up
                                                                                             …and Protectionism
• V-shaped recovery                            • Longer-term driven by fundamentals
                                                                                          • Managing Through Economic Recovery
• $1.9 trillion stimulus package               • Market is up 71.3% since its low

Central Bank Activity                          Bond Market
• Carefully rebuilt the tools                  • Rates rose, curve steepened              Potential Headwinds
• Dovish global central banks                  • Household credit rising but remains      • Coronavirus pandemic
• Global M2 increasing                           modest relative to GDP                   • Inflation and price pressures picking
• Federal Reserve (Fed) – unprecedented        • Stretched corporate credit no longer       up faster than expected
  measures                                       under pressure                           • Slower U.S. GDP growth
• Expanding balance sheet                      Foreign Exchange & Commodities             • Trade and tariff tensions
                                               • Dollar (DXY) up 0.9% YTD on rate         • Heightened geopolitical risks (UK,
Global Economy                                                                              Europe, Iran)
• Global manufacturing above pre-COVID           differentials
  levels                                       • Gold down 3.6% YTD to $1,829             Existing Tailwinds
• Supportive Global Fiscal Policy              • Oil (WTI) up 8.0% YTD on supply curbs    • Massive monetary support
• Asia ex Japan GDP, 5.3% in 2019                and positive vaccine news                • Historic fiscal support
• Japan Real GDP, 0.7% in 2019                                                            • Started crisis with a strong economy
• Europe core stronger than periphery                                                     • Moderna’s and Pfizer’s vaccines are
                                                                                            approved
Geopolitical Events                                                                       • May have hit a pandemic peak in
• Protectionism and trade                                                                   some hot spots
• 2020 Presidential Election
• Gulf tensions
• China, Russia, Middle East, North Korea
Source: Stifel Investment Strategy data via Bloomberg, as of January 15, 2021
INVESTMENT STRATEGY BRIEF                                                                                                      18
Unprecedented Policy Response
Monetary Policy
• $2.3 trillion program to support the economy
• Federal Reserve (Fed) has been expanding its balance sheet by buying:
Investment Grade Collateralized Loan Obligations (CLOs), Commercial Mortgage-Backed
Securities (CMBS), Investment Grade and High Yield Corporate Bonds, Treasury Securities
• The Fed is signaling continued monetary policy support as they expect the recovery to come in 2021
Fiscal Policy
• $2.3 trillion Coronavirus Aid, Relief, and Economic Security Act Program (CARES)
• $484 billion Stimulus Package
• $950 billion package approved by Congress (December 2020)
• $1.9 trillion coronavirus package proposed
-Direct payments of $1,400, on top of the $600 approved in December
-$400 per week in supplementary unemployment benefits through September
-$350 billion for state and local governments
President’s Executive Orders
• Defer payroll taxes for those earning less than $100,000 a year
• Defer student loan payments and discourage evictions
• Extend enhanced unemployment benefits - $400 per week
$300 a week to be supplied by the Federal Government
$100 a week provided by state (optional)
Source: Stifel Investment Strategy via Bloomberg, as of January 15, 2021
INVESTMENT STRATEGY BRIEF 19Macro Environment: The Consumer
The Consumer
Redbook Ret. Sales 2.1 Personal Income (%) (1.1) Pers. Spending (%) (0.4)
long term 1 year long term 1 year long term 1 year
Year-over-year change Based on a 3-month moving average Based on a 3-month moving average Very Positive
Retail Sales (YoY) 2.9 Avg. Hrly. Earnings 5.1 Unemploym. Rate (%) 6.7
Neutral
long term 1 year long term 1 year long term 1 year
Based on a 3-month moving average Year-over-year change
Consumer Confidence 88.6 Nonfarm Payrolls ('000) (140) Consumer Credit 4.4
Very Negative
long term 1 year long term 1 year long term 1 year
Annual rate
Source: Stifel Investment Strategy via Bloomberg, as of January 19, 2021
INVESTMENT STRATEGY BRIEF 20Macro Environment: Housing
Housing
NAHB Home Builder's 86.0 Mortg. Apps (%) 16.7 Pend. Home Sales (%) (2.6)
long term 1 year long term 1 year long term 1 year Very Positive
Based on 26-week moving average Based on a 3-month moving average
CS Home Prices (%) 8.4 Exist. Home Sales (%) (2.5) New Home Sales (%) (11.0)
Neutral
long term 1 year long term 1 year long term 1 year
Based on 3-month moving average Based on 6-month moving average
Housing Starts ('000) 1547.0 Building Permits ('000) 1635.0
Very Negative
long term 1 year long term 1 year
Source: Stifel Investment Strategy via Bloomberg, as of January 19, 2021
INVESTMENT STRATEGY BRIEF 21Macro Environment: Business
Business
NFIB Small Bus. Opt. 95.9 Bus. Inventories (YoY) (3.2) Truck Ship. (YoY %) 8.7
long term 1 year long term 1 year long term 1 year
Based on a 3-month moving average
Markit Comp. PMI 55.3 Markit Manufac. PMI 57.1 Markit Services PMI 54.8
Very Positive
long term 1 year long term 1 year long term 1 year
ISM Manuf. 60.7 ISM Nonmanufact. 57.2 Chicago PMI 59.5
Neutral
long term 1 year long term 1 year long term 1 year
Durable Goods Orders 1.0 Core Capex Orders 0.5 Constr. Spending (%) 0.9
Very Negative
long term 1 year long term 1 year long term 1 year
Based on a 3-month moving average Based on a 3-month moving average Based on a 3-month moving average
Factory Orders 1.0 Wholesale Inventories 0.0 Nonres. Spending 22.9
long term 1 year long term 1 year long term 8 quarters
Based on a 3-month moving average Based on a 3-month moving average
Source: Stifel Investment Strategy via Bloomberg, as of January 19, 2021
INVESTMENT STRATEGY BRIEF 22Macro Environment: Inflation
Inflation
Core Inflation (CPI) 1.6 Inflation (CPI) 1.4 Inflation (PCE) 1.1
long term 1 year long term 1 year long term 1 year
Very Positive
Core Inflation (PPI) 1.2 Inflation (PPI) 0.8 Core Inflation (PCE) 1.4
Neutral
long term 1 year long term 1 year long term 1 year
Trimmed Inflation 0.5
Very Negative
long term 1 year
All Inflation numbers reflect percent year-over-year changes.
Source: Stifel Investment Strategy via Bloomberg, as of January 19, 2021
INVESTMENT STRATEGY BRIEF 23Coronavirus Dashboard
Last 6mths
Last 12mths
Indicator Pre-Outbreak Average Before Current Description
Worst Reading
Outbreak
Timely measure representing about 9,000 stores that gives us an
Redbook Retail Sales (%) 5.0 5.4 -9.7 2.1 indication of consumer spending
Timely measure that tracks the number of individuals who have filed for
Jobless Claims (thousands) 216.3 215.8 6867.0 965.0 jobless claims for the first time
A composite economic indicator consisting of key metrics that lead the
Leading Economic Indicators YoY (%) 0.9 0.4 -13.0 -2.2 economic cycle
A measure of how well economic data is faring relative to consensus
Global Economic Surprise Index 5.8 -2.1 -79.1 79.3 expectations
Macro
Bloomberg Consensus 2020 World Real GDP (%) 3.1 3.1 -3.9 -3.8 Economist survey estimate of global real GDP
IMF 2020 World Real GDP (%) 3.4 N/A -4.9 -4.4 IMF estimate of global real GDP
Bloomberg Consensus 2020 U.S. Real GDP (%) 1.9 1.8 -5.7 -3.5 Economist survey estimate of U.S. real GDP
ISM New Orders - Manufacturing 52.0 48.9 27.1 67.9 One of the key leading economic indicators
Global Money Supply ($ trillions) 80.9 79.4 79.2 95.5 A measure of global liquidity showing the state of monetary policy
Global central banks and governments have taken unprecedented
Monetary/Fiscal support
stimulative measures to support the global economy
Federal Reserve Bank of New York Weekly
Economic Index (WEI)
2.0 1.6 -11.5 -2.5 An index designed to provide a signal on the state of the U.S. economy
Forward-looking consumer view of both present and expected economic
U. of Michigan Consumer Confidence 99.8 97.6 71.8 79.2 conditions
Forward-looking consumer view of both present and expected economic
Conference Board Consumer Confidence 130.4 128.4 85.7 88.6 conditions
NAHB Housing Market Index 75.0 72.5 30.0 86.0 Homebuilders' confidence - a good proxy of future housing activity
Survey Data
U.S. Empire State Manufacturing Index 4.8 4.8 -78.2 3.5 How businesses feel about the economy in the state of New York
Dallas Fed Manufacturing Index -0.2 -1.8 -74.0 9.7 How businesses feel about the economy in the state of Texas
How businesses feel about the economy in the states of Pennsylvania,
Philadelphia Fed Manufacturing Index 17.0 13.9 -56.6 9.1 New Jersey, and Delaware
Timely survey (bi-monthly) which gives a real-time view of the
Markit Manufacturing PMI 51.9 51.7 36.1 57.1 manufacturing sector, covering all-sized U.S. companies
Timely monthly survey which gives a real-time view of the
ISM Manufacturing PMI 50.9 51.7 41.5 60.7 manufacturing sector, covering large-sized U.S. companies.
Markit Services PMI 53.4 51.5 26.7 54.8 A timely measure to gauge service sector activity
ISM Services PMI 55.5 54.9 41.8 57.2 A timely measure to gauge service sector activity
Source: Stifel Investment Strategy via Bloomberg, Goldman Sachs, the COVID Tracking Project, OpenTable, Flightradar24, as of January 19, 2021
implies current reading close to or greater than
INVESTMENT STRATEGY BRIEF pre-outbreak level 24Coronavirus Dashboard
Last 6mths
Last 12mths
Indicator Pre-Outbreak Average Before Current Description
Worst Reading
Outbreak
A measure of global demand and economic activity.Macro Environment: The Consumer
The Consumer
88.6 2.9%
Conference Board Retail Sales
Consumer Confidence (as of December 31, 2020)
(as of December 31, 2020)
965,000 Over 6.7%
44
Jobless Claims Unemployment Rate
(as of January 8, 2021) million*
(as of December 31, 2020)
Jobless Claims
Source: Stifel Investment Strategy data via Bloomberg, as of January 19, 2021
INVESTMENT STRATEGY BRIEF 26Macro Environment: GDP Survey
U.S. GDP Q1 20 Q2 20 Q3 20 Q4 20 Q1 21 Q2 21 Q3 21 Q4 21 2020* 2021*
Consensus Estimates -5.0 -31.4 33.4 4.3 2.3 4.0 4.6 3.8 -3.5 4.1
Stifel** -2.6 -28.4 18.0 3.8 -1.5 3.4 4.5 2.2 0.2 2.2
IHS Markit 3.0 -35.5 33.2 2.9 2.2 3.5 5.5 2.2 -3.6 4.0
Goldman Sachs -9.0 -33.0 35.0 5.0 5.0 9.0 7.5 6.1 -3.4 6.4
Pantheon Macro -6.0 -30.0 35.0 6.0 2.0 7.0 14.0 5.0 -3.4 6.0
Capital Economics -3.5 -30.0 30.0 4.5 5.8 10.9 4.2 4.2 -3.5 6.5
Strategas 0.0 -33.0 25.0 8.5 3.0 8.0 5.5 4.0 -3.2 6.0
Julius Baer -4.0 -25.0 29.5 2.0 2.5 3.5 3.5 3.2 -3.7 3.5
UBS -5.1 -31.7 29.7 4.5 3.5 7.1 3.5 4.5 -3.5 5.0
Wells Fargo -1.2 -36.8 28.6 4.0 1.3 4.0 9.1 6.6 -3.5 4.6
Bloomberg Economics
Barclays
3.1%
3.0 -37.0 28.0
-1.5 -31.7 30.0
2.5 -0.5
5.0
6.5
2.5 11.0
4.5
9.5
3.5 -3.6 3.5
5.0 -3.4 6.3
Hourly Earnings
JPMorgan Chase -10.0 -32.9YoY
34.5 5.0 2.3 9.0 7.8 2.5 -3.4 5.5
Bank of America ML -7.0 -35.0 33.0 5.0 1.0 7.0 5.0 5.0 -3.5 4.6
Federal Reserve -2.4 4.2
*Annualized percent change from prior quarter and year-over-year change are shown for quarterly and yearly periods, respectively.
**Based on Stifel sell-side Economics department estimates.
Source: Stifel Investment Strategy data via Bloomberg, as of January 19, 2021
INVESTMENT STRATEGY BRIEF 27Markets INVESTMENT STRATEGY BRIEF 28
Market Monitor: U.S. Fixed Income
Rates and Spreads

OAS Spread is the measurement of the spread of a fixed-income security rate and the risk-free rate of return, which is
adjusted to take into account an embedded option

 Source: Stifel Investment Strategy data via Bloomberg, as of January 19, 2020
INVESTMENT STRATEGY BRIEF                                                                                                29
Equity Performance
Performance
                                                              2019

                                                              2020

Source: Stifel Investment Strategy data via Bloomberg, as of December 31, 2020
INVESTMENT STRATEGY BRIEF                                                                      30
Market Monitor: Equities
Earnings Season Update
S&P 500 Earnings Growth
Source: Stifel Investment Strategy via FactSet, as of January 19, 2021; Current fourth Quarter 2020 earnings growth is the blended rate
(combines actual results for companies that have reported and estimated results for companies that have yet to report). Earnings growth
estimates for the rest represent consensus forecasts.
INVESTMENT STRATEGY BRIEF 31Dynamic Leanings INVESTMENT STRATEGY BRIEF 32
Asset Allocation

INVESTMENT STRATEGY BRIEF                      33
Allocation Insights

INVESTMENT STRATEGY BRIEF                         34
Allocation Insights

INVESTMENT STRATEGY BRIEF                         35
Finding Our Guidance

INVESTMENT STRATEGY BRIEF                   36
Stifel Guidance
The following summarizes how we deliver our economic and market analysis and corresponding
investment guidance, along with some helpful links.

    • Each day we broadcast Stifel Investor Insights on iHeartRadio.
    • Sight|Lines is a weekly note for clients, along with a video summary and a podcast on
      Spotify, Apple, Omny, and Google.
    • Market Pulse is shared when the S&P 500 Index moves up or down 2%.
    • The monthly Investment Strategy Brief video series shares our update on the current
      economic and market environment. The podcast: Spotify, Apple, Omny, and Google.
    • In Conversations Podcast, Stifel’s Chief Investment Officer, Michael O’Keeffe, sits down with
      leaders at Stifel and in the finance industry to have thought provoking conversations related
      to the finance industry. Episodes are released monthly.
    • The weekly, monthly, and quarterly Market Perspectives provide a recap of the most recent
      period’s global market results.
    • The monthly Favorite 15 shares our favorite 15 slides for the month.
    • Stifel’s Allocation Insights provides our dynamic asset allocation leanings quarterly.
    • The Stifel 2021 Outlook Report and Video: provide our annual outlook and related articles.
    • Stifel's Approach to Asset Allocation summarizes our asset allocation approach and
      provides a catalogue of various recommended asset mix models.
    • The Stifel Financial ID video series provides an overview of our work in behavioral finance
      and the related Stifel Financial ID model.
INVESTMENT STRATEGY BRIEF                                                                       37
Appendix: Disclosures Indices are unmanaged, do not reflect fees and expenses, and are not available for direct investment. Past performance does not guarantee future results. Investing involves risk, including the possible loss of principal. Asset allocation and diversification do not ensure a profit or protection against loss. Alternative Investments or Non-Traditional Assets – Alternative investments may include, but are not limited to: Real Estate Investment Trusts (REITs), Commodities, Futures, Hedge Funds, Venture Capital, Limited Partnerships, etc. Real Estate – When investing in real estate companies, property values can fall due to environmental, economic, or other reasons, and changes in interest rates can negatively impact the performance. Commodities and Futures – The risk of loss in trading commodities and futures can be substantial. You should therefore carefully consider whether such trading is suitable for you in light of your financial condition. The high degree of leverage that is often obtainable in commodity trading can work against you as well as for you. The use of leverage can lead to large losses as well as gains. Hedge Funds – Investors should be aware that hedge funds often engage in leverage, short-selling, arbitrage, hedging, derivatives, and other speculative investment practices that may increase investment loss. Hedge funds can be highly illiquid, are not required to provide periodic pricing or valuation information to investors, and often charge high fees that can erode performance. Additionally, they may involve complex tax structures and delays in distributing tax information. While hedge funds may appear similar to mutual funds, they are not necessarily subject to the same regulatory requirements as mutual funds. Venture Capital – Venture capital investments involve substantial risks. The risks associated with investing in companies in the start-up or expansion stages of development are greater than those of companies in later stages, because the companies’ business concepts generally are unproven and the companies have little or no track record. Limited Partnerships – Generally, limited partnership investments are suitable only for a narrow class of relatively sophisticated investors. Limited partnership investments may be speculative in nature and be subject to resale restrictions or illiquidity. An investment is appropriate only for investors who have the capacity to absorb a loss of some or all of their investment. Bonds – When investing in bonds, it is important to note that as interest rates rise, bond prices will fall. High-yield bonds have greater credit risk than higher quality bonds. Duration – Duration is a measure of the sensitivity of the price -- the value of principal -- of a fixed-income investment to a change in interest rates. Duration is expressed as a number of years. Standard Deviation – Standard deviation is a measure of the dispersion of a set of data from its mean. It is calculated as the square root of variance by determining the variation between each data point relative to the mean. If the data points are further from the mean, there is higher deviation within the data set. International and Emerging Markets – There are special considerations associated with international investing, including the risk of currency fluctuations and political and economic events. Investing in emerging markets may involve greater risk and volatility than investing in more developed countries. Private Equity – Private equity funds are not appropriate for all investors. Investors should be aware that private equity funds may contain speculative investment practices that can lead to a loss of the entire investment. Private equity funds may invest in entities in which no secondary market exists and, as such, may be highly illiquid. The funds are not required to provide periodic pricing or valuation information to investors and often charge high fees that can erode performance. Additionally, they may involve complex tax structures and delays in distributing tax information. Short Positions – The investor should note that when a short position moves in an unfavorable way, the losses are theoretically unlimited. The broker will demand more collateral and the manager might have to close out that short position at an inopportune time to limit any further losses. Small Company Securities – Small company securities are typically more volatile and carry additional risks, since smaller companies generally are not as well established as larger companies. INVESTMENT STRATEGY BRIEF 38
Appendix: Index Descriptions

Bloomberg Barclays U.S. Treasury Bills 1-3 Months Index includes all publicly issued zero-coupon U.S. Treasury Bills that have a remaining maturity of less than three months and
more than one month, are rated investment grade, and have $250 million or more of outstanding face value.
Bloomberg Barclays U.S. Corporate IG Index is an unmanaged index considered representative of fixed-rate investment-grade taxable bond debt.
Bloomberg Barclays U.S. Aggregate Corporate Index is an unmanaged index considered representative of fixed-rate investment-grade taxable bond debt.
Bloomberg Barclays U.S. Corporate High Yield is an unmanaged index considered representative of fixed-rate, noninvestment-grade debt.
Bloomberg Barclays U.S. Government Bond Index is an unmanaged index considered representative of fixed-rate, investment-grade US Government debt.
Bloomberg Barclays Global Aggregate This index provides a broad-based measure of the global investment-grade, fixed-rate debt market.
DXY Index is a measure of the value of the U.S. dollar relative to the value of a basket of currencies of the majority of the U.S.'s most significant trading partners.
S&P 500 Index is a capitalization-weighted index of 500 stocks. The index is designed to measure performance of the broad domestic economy through changes in the aggregate
market value of 500 stocks representing all major industries.
Russell 1000 Index represents approximately 1,000 of the largest companies in the U.S. equity markets, the Russell 1000 is a subset of the Russell 3000 Index. The Russell 1000
(maintained by the Russell Investment Group) comprises over 90% of the total market capitalization of all listed U.S. stocks and is considered a bellwether index for large
cap investing.
Russell 2000 Index measures the performance of the 2,000 smallest companies in the Russell 3000 index.
MSCI EAFE Index captures large and mid cap representation across Developed Markets countries around the world, excluding the U.S. and Canada. With 914 constituents, the
index covers approximately 85% of the free float-adjusted market capitalization in each country.
MSCI Emerging Markets (EM) Index captures large and mid cap representation across 23 Emerging Markets (EM) countries. With 837 constituents, the index covers approximately
85% of the free float-adjusted market capitalization in each country.
Morgan Stanley Market implied pace of hikes index (MSPOKE) is the number of Fed rate hikes in the 12 months following the first rate hike implied by the Eurodollar interest rate
futures market.
The MSCI World Index is a free float-adjusted market capitalization-weighted index that is designed to measure the equity market performance of developed markets.
Wilshire 5000 Index is a market-capitalization-weighted index of the market value of all stocks actively traded in the United States.
VIX Index shows the market's expectation of 30-day volatility. It is constructed using the implied volatilities of a wide range of S&P 500 index options.

INVESTMENT STRATEGY BRIEF                                                                                                                                                           39
Appendix: Index Descriptions

EURO STOXX 50 is a stock index of Eurozone stocks designed by STOXX, an index provider owned by Deutsche Börse Group. According to STOXX, its goal is "to provide a blue-chip
representation of Supersector leaders in the Eurozone
Cash & Cash Eq. is represented by the Bloomberg Barclays U.S. Treasury 3-6 months Bill Index, comprised of treasury bills issued by the U.S. government with less than one year to
maturity.
U.S. Gov’t Bonds is represented by the Bloomberg Barclays U.S. Government Bond Index, comprised of the U.S. Treasury and U.S. Agency indexes.
U.S. Corp IG Bonds is represented by the Bloomberg Barclays U.S. Corporate Bond Index, comprised of the investment grade, fixed –rate, taxable corporate bond market.
High-Yield Bonds is represented by the Bloomberg Barclays U.S. Corporate High Yield Bond Index, comprised of U.S. Dollar denominated, high-yield, fixed- rate corporate bond
market securities.
U.S. LC (Large Cap) equities is represented by Russell 1000 Index, comprised of 1,000 of the largest U.S. securities based on a combination of their market cap and current index
membership.
U.S. SC (Small Cap) equities is represented by the Russell 2000 Index, comprised of 2,000 of the smallest U.S. securities based on a combination of their market cap and current
index membership.
Dev Int’l Equities is represented by the MSCI EAFE Index, comprised of equity securities that belong to markets outside of the U.S. and Canada.
EM Equities is represented by the MSCI EM Index, comprised of equity securities that belong to emerging markets.
Moderate Bench stands for moderate benchmark portfolio return which is a blended portfolio of stocks (60% weight, represented by MSCI AC World Index) and bonds (40%
weight, represented by Bloomberg Barclays U.S. Agg Gov/Credit).
MSCI AC World Index is comprised of equity securities belonging to 23 developed markets and 24 emerging markets countries.
Bloomberg Barclays U.S. Government/Credit Bond Index is comprised investment grade, dollar-denominated, fixed-rate Treasuries, government-related and corporate securities.

Stifel, Nicolaus & Company, Incorporated │Member SIPC & NYSE │www.stifel.com
3 Bryant Park │1095 Avenue of the Americas │ New York, New York 10036                                                                                              0121.3412548.1

INVESTMENT STRATEGY BRIEF                                                                                                                                                            40
You can also read