NIAGARA COLLEGE 2019 Conservation Demand Management Plan - Sustainability
←
→
Page content transcription
If your browser does not render page correctly, please read the page content below
NIAGARA COLLEGE 2019 Conservation Demand Management Plan
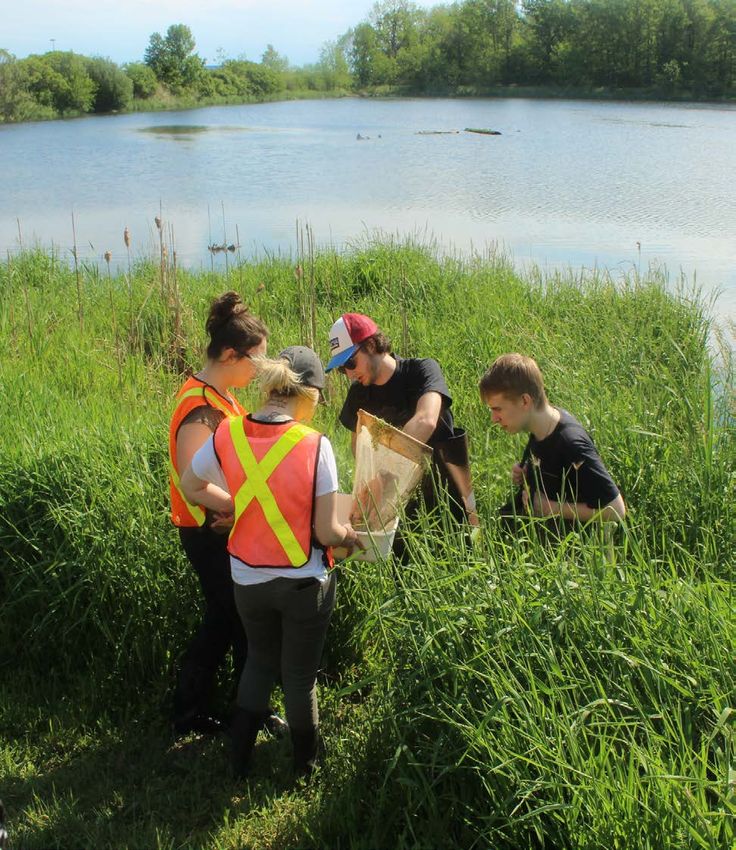
Table of Contents
1.0 About Niagara College............................................................................................................................. 3
   1.1 Utility Delivery and Facilities Location – Niagara-on-the-Lake ............................................................. 3
   1.2 Utilities Delivery and Facilities Location – Welland .............................................................................. 3
   1.3 Utilities Delivery and Facilities Location – Niagara Falls ...................................................................... 3
2.0 Sustainability at Niagara College ............................................................................................................. 4
   2.1 Student Involvement and Sustainability Initiatives ............................................................................... 4
     2.1.1 Solar Panels ................................................................................................................................. 4
     2.1.2 Butterfly Pollinator Garden ............................................................................................................ 4
     2.1.3 Waste Audits................................................................................................................................. 4
     2.1.4 Water Stations .............................................................................................................................. 5
   2.2 Niagara College Sustainability Plan ..................................................................................................... 5
     2.2.1 Sustainability Goals and Targets .................................................................................................. 6
     2.2.2 Sustainability Plan Action Items .................................................................................................... 7
   2.6 Energy Programs & Funded Projects .................................................................................................. 8
     2.6.1 Marrotta Family Innovation Complex ............................................................................................ 8
     2.6.2 Green Automotive Lab .................................................................................................................. 8
   2.7 Sustainability Awards........................................................................................................................... 9
   2.8 AASHE STARS Program ................................................................................................................... 10
3.0 Legislative & Reporting Requirements................................................................................................... 10
   3.1 Ontario Regulation 507/18 ................................................................................................................. 10
4.0 Review of Energy Consumption in Ontario ............................................................................................ 11
   4.1 Long-term Energy Plans for Ontario .................................................................................................. 11
5.0 Energy Consumption & Greenhouse Gas Emissions Data .................................................................... 12
   5.1 Energy Consumption Data................................................................................................................. 12
   5.2 Absolute Greenhouse Gas Emissions Data ....................................................................................... 14
6.0 Projects and Proposed Cost and Savings ............................................................................................. 15
   6.1 Historic GHG Reduction Project Projections (2013-2018) ................................................................. 15
   6.2 Future GHG Reduction Project Projections ....................................................................................... 16
7.0 Continuous Improvement and Community Engagement ....................................................................... 16
8.0 References ............................................................................................................................................ 17
Appendices .................................................................................................................................................. 18
   Appendix A: Historic and Future Project Projections ............................................................................... 18
   Appendix B: Niagara College Campus Maps........................................................................................... 22

List of Tables
Table 1: Summary of the Goals and Targets in the 2019-2021 Niagara College Sustainability Plan............. 6
Table 2: Sustainability Plan Action Items ....................................................................................................... 8
Table 3: Summary of Electricity and Natural Gas from 2011-2018 .............................................................. 12
Table 4: Niagara College Annual Absolute Greenhouse Gas Emissions by Scope ..................................... 14
Table 5: Historic GHG Project Projections (2013-2018) .............................................................................. 18
Table 6: Future GHG Reduction Project Projections (2018-2030) ............................................................... 19
Table 7: Future GHG Reduction Project Projections (2030-2050) ............................................................... 21

                                                                                                                                                              1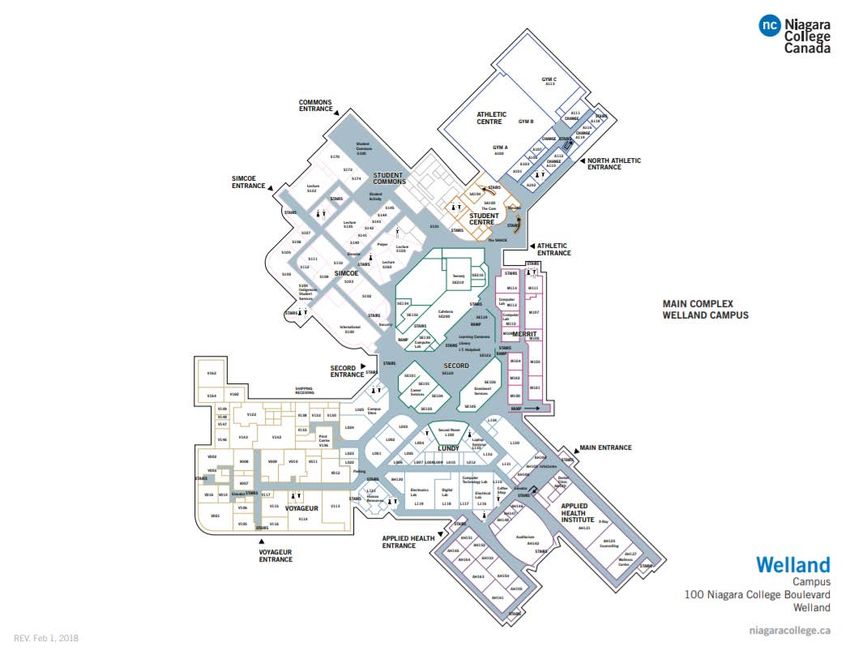
List of Figures
Figure 1: Timeline of Sustainability Initiatives ................................................................................................ 5
Figure 2: Electricity Consumption per Campus from 2011-2018.................................................................. 13
Figure 3: Natural Gas Consumption per campus from 2011-2018............................................................... 13
Figure 4: Niagara College Annual Absolute Greenhouse Gas Emissions Broken Down by Scope ............. 15

                                                                                                                                                 2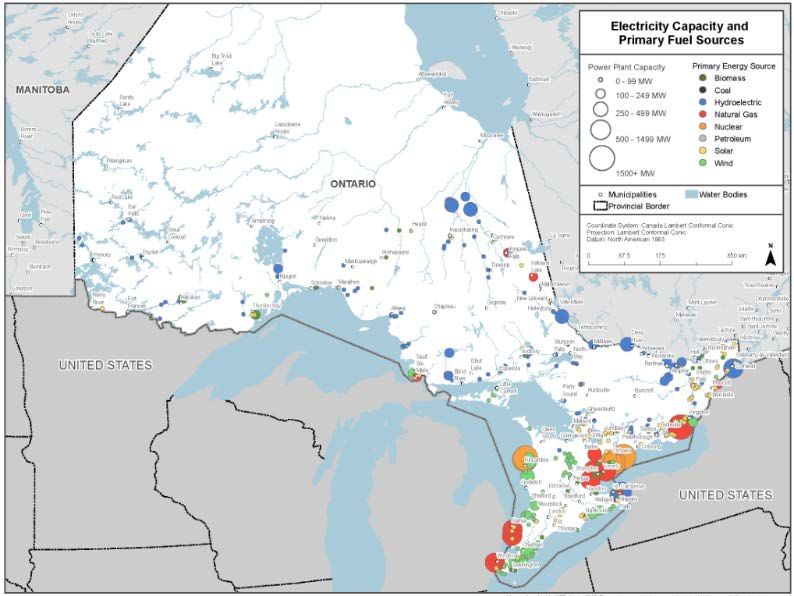
1.0         About Niagara College
Niagara College is located in Southern Ontario
with two main campuses in Welland and Niagara-
on-the-Lake. Opening in 1967, it now has over
100 diploma, graduate certificate, apprenticeship,
and Bachelor Degree programs, as well as over
600 general interest, vocational, and credit
programs. There are more than 10,000 full-time
students and over 15,000 part-time students
attending Niagara College. Niagara College has
three strategic priorities which include, an
unparalleled student experience and satisfaction,
leading innovation and applied research, and
operational excellence. Niagara College is
committed to providing an innovative learning
environment as evident by the learning enterprises
that focus on providing students hands on skill
building opportunities in their field of study that are
open to the public. Learning enterprises include
the Benchmark Restaurant, NC Teaching Winery, NC Teaching Brewery, NC Teaching Distillery, NC
Greenhouse and Nursery, Niagara Waters Spa and Hair Salon, and the NC Dental Clinic. 1

1.1 Utility Delivery and Facilities Location – Niagara-on-the-Lake
There are seven buildings located at the Niagara-on-the-Lake campus. The buildings include the Main
college building, Canadian Food & Wine Institute, Greenhouse Nursery, Teaching Brewery, Teaching
Distillery, Wine Visitor and Education Centre, and Cannabis Bunker. The main building is three floors and is
separated into four different wings. Illustrations of the building layouts for the Niagara-on-the-Lake Campus
can be viewed in Appendix B: Niagara College Campus Maps. The buildings are supplied electricity by
Niagara-on-the-Lake Hydro and natural gas through Enbridge. 2

1.2 Utilities Delivery and Facilities Location – Welland
The Welland campus has four distinct buildings on site. These buildings include the Main Building, the
Rankin Technology Building, which includes the Green Automotive Centre, and the Walker Advanced
Manufacturing Innovation Centre, as well as the Black Walnut building, and Pavilion building. Illustrations of
the building layouts for the Welland Campus can be viewed in Appendix B: Niagara College Campus Maps.
Electricity on this campus is supplied by Welland Hydo and Enbridge is the natural gas supplier.

1.3 Utilities Delivery and Facilities Location – Niagara Falls
The Niagara Falls campus has one main building and is serviced by Niagara Peninsula Energy for
electricity and Enbridge for natural gas. The campus was sold in April 2018.

1   Niagara College (2019). About NC. Retrieved from: https://www.niagaracollege.ca/about/
2   Niagara College (2019). Visit. Retrieved from: https://www.niagaracollege.ca/visit/

                                                                                                             3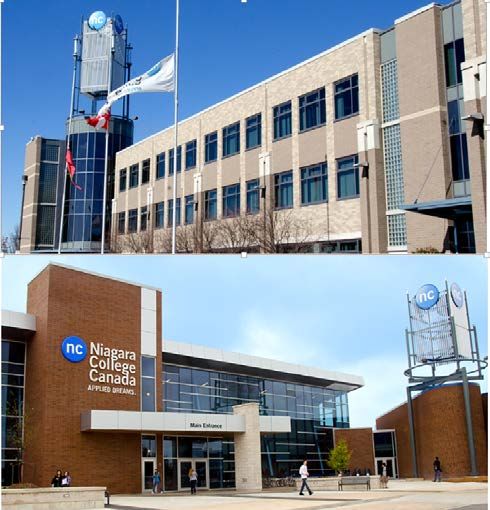
2.0 Sustainability at Niagara College
Sustainability at Niagara College means providing high-quality applied education and training that meets
the needs of students, employees, and the communities in which we operate today while protecting and
enhancing future human and natural resources. Our definition builds on the Bruntland definition of
sustainability which was adopted by the United Nations World Commission on Environment and
Development in 1987. It was adopted to further focus on the importance of transformative education and
hands-on learning to build a sustainable present and future. In 2009, Niagara College made environmental
sustainability a key strategic priority and later formed the Sustainability Committee in 2011. The office of
sustainability was formally launched in 2015 and sustainability is further developing by building a strong
record of accomplishment and commitment to reducing greenhouse gas emissions. Niagara College
intends to continue to support and enhance sustainability on campus through objectives such as:
− Engaging and educating the Niagara College Community in sustainability on campus
− Determining key priority areas, respective measurable targets, and associated action items to meet
targets set through the planning process
− Providing direction for the Sustainability Committee, Office of Sustainability, and other departments
in the College to continue building sustainability programs and initiatives over the next three years
− Providing a platform to capture sustainability in action more effectively on campus and in the
community 3
2.1 Student Involvement and Sustainability Initiatives
There are a number of notable initiatives and projects that Niagara College has implemented to achieve the
established sustainability goals and provide students with hands on skill building opportutniteis. The
following sections outline some of those notable projects and Figure 1 illustrates a timeline of some of the
projects and initiatives.
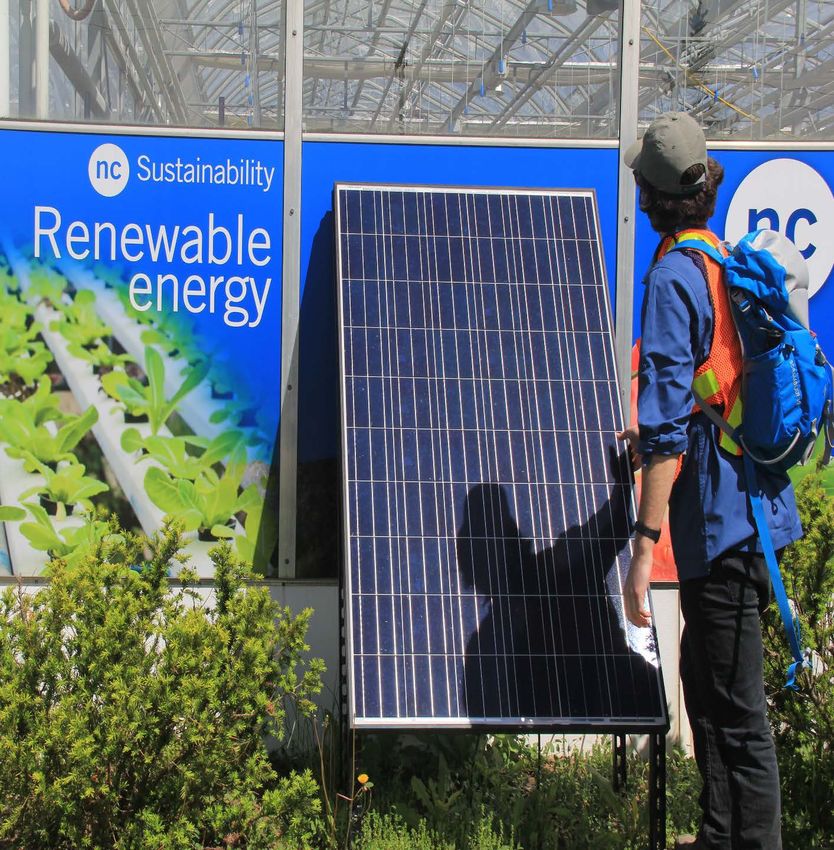
2.1.1 Solar Panels
The Welland campus contains almost 500 rooftop panels. The roof mounted photovoltaic system is 95kW
and can produce a maximum of 115MWh of power annually. They have been tied to the Ontario power grid
as part of the Feed-In-Tariff program. All financial gains through this program are used to fund other energy
and sustainability projects and initiatives at Niagara College. 4
2.1.2 Butterfly Pollinator Garden
The Butterfly Pollinator Garden was built by students at the Niagara-on-the-Lake campus. It contains local
flowers that provide pollen for a wide range of pollinating insects. It is one of many ways Niagara College is
committed to protecting and conserving biodiversity.
2.1.3 Waste Audits
Every year, students collect information about the waste created on campus. There are four stream waste
bins around campuses which allows the college to collect and track, organics, landfill, recyclables, and
coffee cups produced.
3 Niagara College. (2019). Sustainability Plan 2019-2021. Retrieved from:
https://sustainability.niagaracollege.ca/about/sustainability-plan-2019-2021/.
4 Niagara College Sustainability. (2019). Solar Panels. Retrieved from: https://sustainability.niagaracollege.ca/project/solar-
panels/.
4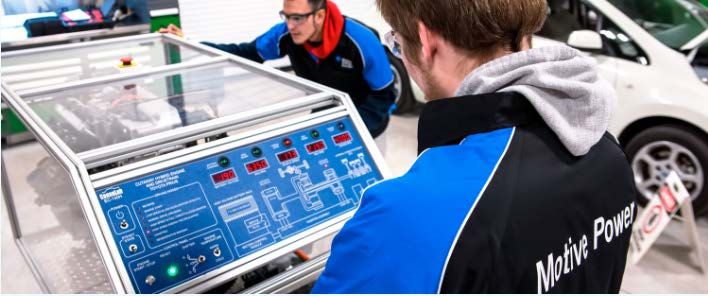
2.1.4 Water Stations
Niagara College officially banned the sale of water bottles on campus. This was done to reduce waste from
the disposal of plastic water bottles and to support the notion that everyone has the right to clean drinking
water. Due to the banning of water bottle sales on campuses, refill stations were put onto campuses and
students and faculty were encouraged to bring their own water bottles.

Figure 1: Timeline of Sustainability Initiatives

      Green Automotive Lab                                                                         Sustainability Student
          Opens (2018)                                                                              Initative Fund (2018)
            Join WWF Living
            Planet @ Campus                                                             Audubon International
                   Pilot                                                                Cooperative Sanctuary
                                                                                         Certification at NOTL
   STARS Silver                                                                            Campus (2017)
   Rating (2016)
                   Inaugural BioBlitz                               Host Biodiversity
                        (2015)                                       Summit - Youth
               Inaugural GM GREEN                                  Parallel Event (2014)
                  program (2014)                                                 STARS Bronze Rating
                                                                                       (2013)

    Bottled Water Ban
   Implemented (2012)                                                       Sustainability
                                                                          Committee Formed
                 Geothermal Heat Pump                                          (2011)
                    Installed (2011)
                                                                                                  Solar Array installed
                          Strategic Plan                                                                 (2011)
                            Integrates
                        Sustainability (2009)

2.2 Niagara College Sustainability Plan
The Niagara College approved its first sustainability plan in December 2018. Its vision: a culture of
sustainability that goes beyond operations, to create living laboratories to facilitate experiential learning for
students, employees and the community. The 2019-2021 Niagara College Sustainability Plan will assist
Niagara College to lead by example and demonstrate the commitment to reducing negative impacts on the
natural environment and increasing the social wellbeing of the college community while ensuring fiscal
responsibility, and building sustainability literacy through programs for our students, employees and the
broader Niagara community. Led by the Office of Sustainability, the plan is the product of extensive
planning and engagement with the College community, which engaged more than 2,000 students and
employees through the Sustainability Plan Survey, student-led focus groups, and meetings with key
stakeholders from various departments groups and committees. The United Nations Sustainable
Development Goals, and the Association for the Advancement of Sustainability in Higher Education
(AASHE) Sustainability Tracking, Assessment and Rating System (STARS) also influenced the plan.

                                                                                                                    5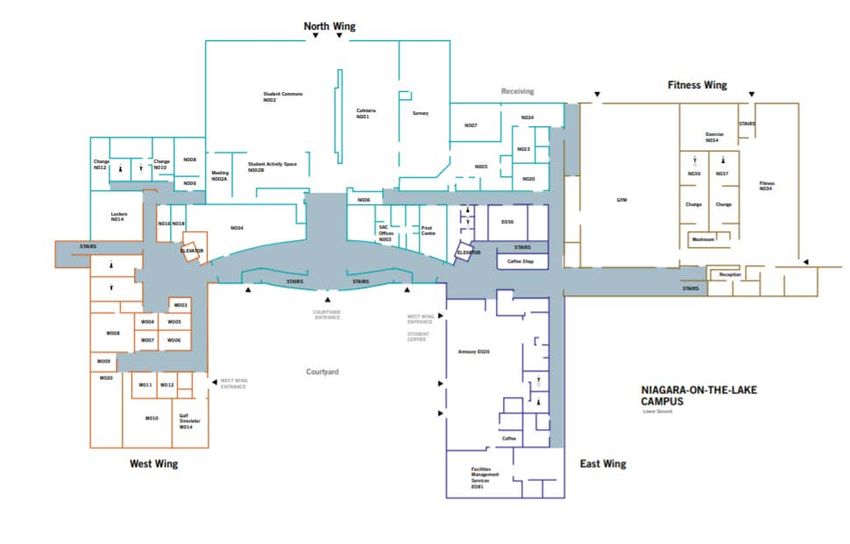
2.2.1 Sustainability Goals and Targets
        The plan outlines three strategic directions for the college including traditional knowledge, innovation and
        technology, and global awareness. Along with the three directions, the plan focuses on five priority areas
        which include, learning, the natural and built environment, resource conservation, climate action and
        community building. The goals and targets of the five priority areas can be seen in Table 1: Summary of the
        Goals and Targets in the 2019-2021 Niagara College Sustainability Plan. 5

        Table 1: Summary of the Goals and Targets in the 2019-2021 Niagara College Sustainability Plan
                                              SUMMARY OF THE FIVE PRIORITIES
 Priority Area                     Objective                                       Goals                                      Targets
1-Learning         1A Academic: To provide students with          Incorporate relevant learning outcomes       Increase the number of sustainability-
                   relevant skill sets for the job market by      into courses to increase sustainability      related volunteer hours by 10%
                   embedding sustainability into academic         literacy
                   courses through learning outcomes and                                                       100% of applied research projects with
                   work-integrated learning opportunities         Increase partnerships with academic          Research and Innovation consider at
                                                                  courses for work-integrated learning         least one sustainability priority
                                                                  opportunities
                   1B Co-Curricular: To provide experiential      Increase sustainability-focused
                   learning opportunities for students,           experiential learning opportunities
                   employees, and community members to            through volunteering
                   learn about sustainability in a practical
                   hands-on setting
                   1C Research and Innovation: Prioritize         Ensure all future applied research
                   sustainability to create new opportunities     projects consider at least one
                   and partnerships, while continuing to grow     sustainability priority
                   a culture of creativity, innovation, and
                   entrepreneurship
2-Built and        2A Biodiversity: Promote the value of          Enhance natural habitats on campus to        Increase the number of species verified
Natural            biodiversity and ecological services on        prevent net loss of biodiversity             on the biodiversity inventory by 10%
                   campus and within the broader community
Environment        to promote no net loss                         Implement strategies to recognize            Increase the number of habitat
                                                                  ecosystem services and traditional           structures on campus by 10%
                                                                  ecological knowledge when decision-
                                                                  making
                   2B Grounds: Support the natural and            Strengthen engagement and
                   manicured environments to further the          communication for the natural resource
                   protection of the natural capital on campus    monitoring protocols and programs
                   grounds from the effects of climate change     Achieve Audubon International
                   through education and social experience        Cooperative Sanctuary Program
                                                                  certification at the Welland Campus
                   2C Buildings: Integrate sustainability into    Incorporate sustainable building
                   spaces on campus through design and            practices into all future new construction
                   construction for new and renovated             and renovation projects
                   buildings
3- Resource        3A Waste: Reduce waste generation and          Reduce absolute waste sent to landfill       Reduce waste sent to landfill by 10%
Conservation       increase efficiencies in services and                                                       from 2012
                   operations                                     Increase waste diversion rate
                                                                                                               Achieve a diversion rate of 65%
                                                                  Increase food waste capture rate

        5Niagara College. (2019). Sustainability Plan 2019-2021. Retrieved from:
        https://sustainability.niagaracollege.ca/about/sustainability-plan-2019-2021/.

                                                                                                                                          6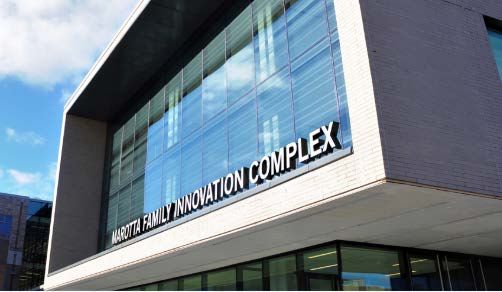
3B Water: Address the impacts                  Reduce absolute water consumption         Achieve an organics capture rate of
                   associated with water quality and                                                        70%
                   consumption                                    Implement initiatives to maintain and
                                                                  improve surface water quality on          Reduce absolute water consumption by
                                                                  campus                                    10% from 2011*
                   3C Energy: Address the environmental           Reduce absolute and intensity-based
                   impacts of energy consumption and              electricity consumption                   Reduce absolute and intensity-based
                   generation through increased efficiencies                                                (per square foot and per cooling degree
                                                                  Reduce absolute and intensity-based       day) electricity consumption by 10%
                                                                  natural gas consumption                   from 2011*

                                                                                                            Reduce absolute and intensity-based
                                                                                                            (per square foot and heating degree
                                                                                                            day) natural gas consumption by 10%
                                                                                                            from 2011*
4-Climate          4A Greenhouse Gas Emissions: Support           No net increase of greenhouse gas         No net increase of greenhouse gas
Action             Canada’s commitment to the Paris               emissions from 2011 baseline levels       emissions from 2011 baseline levels*
                   Agreement to limit temperature increases
                   to less than 2 degrees Celsius above pre-
                   industrial levels
5-Community        5A Social Inclusion: Respect and               Create programs and opportunities that    Increase local food purchasing by 5%
Building           encourage an inclusive environment by          are accessible to all members of the      across all food-service outlets from
                   supporting all members of the college          college community                         2017 baseline levels
                   community
                   5B Health and Wellness: Support mental,        Increase the number of programs and
                   physical, and spiritual health by              events that support health and wellness
                   connecting people with the natural             on Campus
                   environment
                                                                  Assist in increasing awareness and
                                                                  engagement of health and wellness
                                                                  initiatives on campus
                   5C Food: Support programs that increase        Incorporate sustainable and local food
                   access to sustainable healthy food that are    practices into campus food-service
                   socially, culturally, and physically           operations
                   significant
                                                                  Support Programs to increase student
                                                                  food security
                   5D Transportation: Encourage                   Increase support for sustainable and
                   sustainable transportation behaviours          alternative transportation methods
                   through the support of improved public
                   transit and alternative transportation
                   methods
        * Energy-related targets

        2.2.2 Sustainability Plan Action Items
        The Niagara College Sustainability Plan has a number of action items in order to achieve the goals and
        targets outlined in the plan. To meet energy targets Niagara College will conduct a comprehensive energy
        audit at both campuses in order to pinpoint peak energy usage and how to further conserve energy. Other
        actions of implementation can be summarized in the chart below. 6

        6Niagara College. (2019). Sustainability Plan 2019-2021. Retrieved from:
        https://sustainability.niagaracollege.ca/about/sustainability-plan-2019-2021/.

                                                                                                                                      7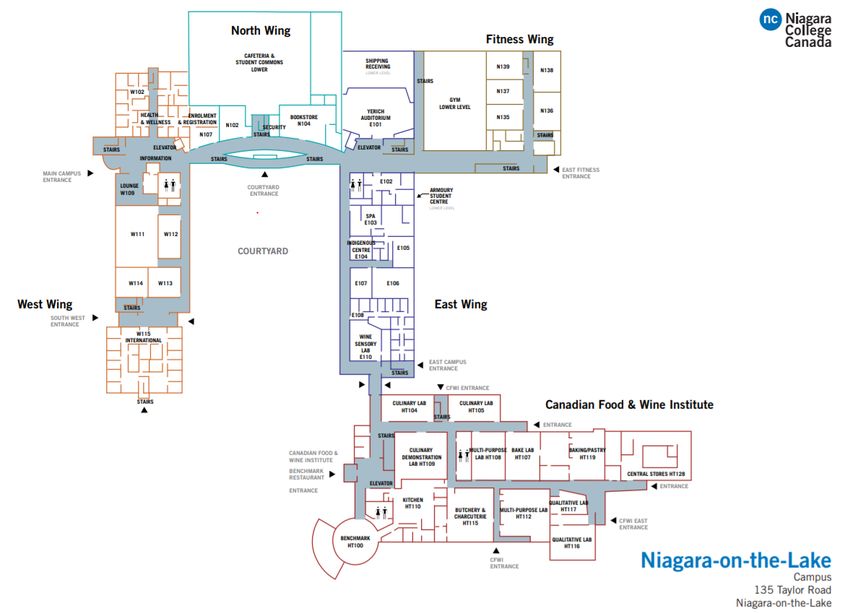
Table 2: Sustainability Plan Action Items
                        Action                                                   Accountability
 Increase of sustainability in procurement                  Office of Sustainability & Financial Services
 processes to incorporate more lifecycle costing
 analysis
 Promote the use of alternative energies and the            Office of Sustainability & Facilities Management
 benefits they provide on campus                            Services
 Review fuel efficiency when purchasing new fleet           Office of Sustainability & Financial Services
 vehicles
 Create a business case template in order to                Office of Sustainability & Financial Services
 facilitate more economically and environmentally
 balanced decisions
 Conduct a comprehensive transit survey to                  Office of Sustainability &Student Administrative Council
 determine commuting greenhouse gas emissions

2.6 Energy Programs & Funded Projects
Niagara College has many funded projects that aim to improve efficiencies with respect to energy. Some of
these efficiencies are being included in the construction of building additions to the college along with
sustainable features and technologies for students to use. Two major funded projects that incorporated
energy efficiencies were the Marrotta Family Innovation Complex and the Green Automotive Lab.
2.6.1 Marrotta Family Innovation Complex
In 2017, the construction of the Marotta Family
Innovation Complex began and it was fully
complete in late 2018. The construction was a
four-storey expansion and includes a fitness
centre, research labs, and classrooms. The
building and its construction incorporated
sustainable technologies such as electric vehicle
charging stations, a green roof water retention
system, and a rainwater collection and irrigation
system 7. The central plant was also upgraded
with a high efficiency cooling system, which
supplies cooling to the entire main building as well as the Canadian Food and Wine Institute. These
projects were funded by the Government of Canada’s Post-Secondary Institutions Strategic Investment
Fund (SIF) and the Ontario Government.
2.6.2 Green Automotive Lab
In 2016, the college received $1.4 million of provincial funding, through Ontario’s Apprenticeship
Enhancement Fund program, for the construction of the Green Automotive Lab on the Welland campus. It
was officially opened in the spring of 2018. It is a 3,600 square foot addition to the Rankin Technology
Centre, with classroom space, and includes sustainable features such as electric vehicle charging stations,
hybrid and electric motor diagnostic and simulation tools and also houses donated hybrid and fully electric
vehicles that allow students access to technology that will dominate the future. With the electric vehicle

7Niagara College. (2019). Campus Redevelopment. Retrieved from:
https://www.niagaracollege.ca/campusredevelopment/projects/.

                                                                                                                8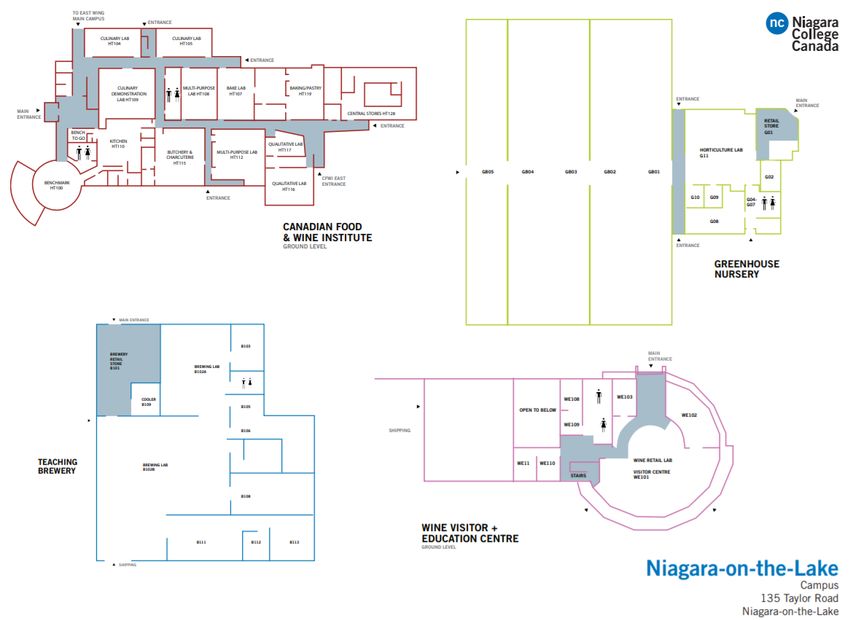
charging stations and batteries there is a micro-grid system connected. The lab is also known to have tools
and equipment to help students to explore the future of ethanol, propane, diesel and other alternative fuel
technologies.

2.7 Sustainability Awards
Niagara College has been recognized for its sustainability, energy, and greenhouse gas conservation
efforts. In 2012 Niagara Sustainability Initiative recognized the College with the Greatest Progress award
for achieving the highest greenhouse gas reductions among its members. In 2014, Niagara College was
recognized by the Ontario Power Authority for achieving the greatest percentage load saved among all
embedded energy managers in Ontario with the Energy Manager Excellence Award. The Outstanding
Post-Secondary Institution award was also received for Niagara College’s advancement of environmental
learning in 2014 from the Canadian Network for Environmental Education and Communication (EECOM).
The college was also recognized in 2014 as the one of the top organizations in Canada that demonstrates
environmental leadership by employing certified Environmental Professionals. In 2014, Niagara College
was also the recipient of the Green Business Award with the support of organizations including the Niagara
Sustainability Initiative, Welland Hydro, Walker Industries and the Niagara Restoration Council due to
initiatives that were aimed at reducing its carbon footprint, conserving energy, improving ecosystems and
environmental education. In 2015, Niagara College received the Greatest Greenhouse Gas Reduction
award at the Niagara Sustainability Initiative’s fourth annual Evening of Recognition. In 2016 and 2017,
Niagara College received the Most Engaged Member award from Niagara Sustainability Initiative. In 2017,
Niagara College was ranked 10th overall among associate college institutions by Association for the
Advancement of Sustainability in Higher Education (AASHE) in the 2017 Sustainable Campus Index, and in
2018 Niagara College was ranked 5th in Wellbeing & Work and 10th overall among associate college
institutions by AASHE in the 2018 Sustainable Campus Index. 8

8 Niagara College. (2019). Awards and Recognition. Retrieved from: https://sustainability.niagaracollege.ca/about/awards-
recognition/.

                                                                                                                            9
2.8 AASHE STARS Program
In 2011, Niagara College joined the Association for the Advancement of Sustainability in Higher Education
(AASHE). AASHE inspires higher education faculty, administrators, staff and students to be change agents
and drive sustainability innovation. AASHE is
known for designing activities to make sustainable
practices the norm within higher education
institutions. This program was originally launched
in 2006, and was the first professional higher
education association for the campus sustainability
community. Niagara College was rated a silver
institution in 2016, which was an improvement from
the 2013 rating of bronze. 9
3.0 Legislative & Reporting Requirements
3.1 Ontario Regulation 507/18
The Electricity Act, 1998 was introduced in order to endure the adequacy, safety, sustainability and
reliability of electricity supply in Ontario and to encourage electricity conservation and the efficient use of
electricity. It aims to promote the use of cleaner energy sources and technologies, including alternative
energy sources and renewable energy sources. It also aims to establish a mechanism for energy planning.
Ontario Regulation 507/18 (O. Reg. 507/18) requires public agencies to prepare, publish, make available to
the public and implement energy conservation and demand management plans or joint plans in accordance
with section 25.3.2 of the Electricity Act.
The energy conservation and demand management plans consists of two major parts. The first part
summarizes the public agency’s annual energy consumption and greenhouse gas emissions for its
operations. The second part is a description of previous, current, and proposed measures for conserving
and reducing the energy consumed by the public agency’s operations. It requires a description of the
managing of the public agency’s demand for energy with a forecast of the expected results of current and
future measures.
As a post-secondary institution, Niagara College is required to report under O. Reg. 507/18. The college
was previously required to report under Ontario Regulation 397/11 (O. Reg. 397/11) under the Green
Energy Act, 2009, but this Act and regulation were spent as of January 1, 2019. The sections pertaining to
the Green Energy Act were amalgamated into the Electricity Act. 10
9 Niagara College. (2019). Association for the Advancement of Sustainability in Higher Education. Retrieved from:
https://sustainability.niagaracollege.ca/reporting/aashe/.
10 Ontario. (2019). Ontario Regulation 507/18: Broader Public Sector: Energy Reporting and Conservation and Demand
Management Plans. Retrieved from: https://www.ontario.ca/laws/regulation/180507.
104.0 Review of Energy Consumption in Ontario
Due to changes in climate, energy production and usage in Ontario has been varying due to efforts to
reduce energy usage and the associated environmental impacts. Ontario’s government took on the task of
eliminating coal-fired power generation and became a leader in mitigating climate change. However, this
also led to the increase in electricity costs as there is a continuous balance to be maintained with pollution
prevention and financial matters. In 2016, Ontario’s end use demand was 3000 petajoules. The largest
energy demand was for the industrial sector at 38% of total demand, followed by transportation at 29%,
residential at 18% and
commercial at 15%. Ontario’s total
energy demand was the
9th largest on a per capita basis
and 2nd largest in Canada.
However, Ontario ranked 11th in
Canada per capita
electricity consumption and
consumed 33% than the national
average. Per capita, Ontario’s
annual electricity consumption
was 10.0 megawatt hours (MW.h)
in 2016. In terms of electricity, the
commercial sector consumed the
largest amount of electricity in
2016 at 46.2 TW.h. Since 2005,
Ontario’s electricity demand has
grown 3% (National Energy Board, 2019). 11
4.1 Long-term Energy Plans for Ontario
Ontario implemented long-term energy plans in 2017 to build on the years of investment Ontarians have
made to renew and clean up the province’s electricity system. The end goal is to be able to deliver fairness
and choice to Ontarians in terms of energy demands and conservation. There are several aspects in the
long-term energy plan and they include, ensuring affordable and accessible energy, ensuring a flexible
energy system, innovation to meet future demands and goals, an improved value and performance for
customers, a stronger commitment to energy conservation and efficiency, responding to climate change,
supporting First Nation and Métis capacity and leadership as well as regional solutions and infrastructure.
Ontario’s Fair Hydro Plan resulted in a 25% reduction on average in electricity bills for residential
consumers. Ontario’s long-term goals and current investments reflect the conservation and management of
energy usage (Government of Ontario, 2019). 12
11 National Energy Board. (2019). Provincial and Territorial Energy Profiles-Ontario. Retrieved from: https://www.neb-
one.gc.ca/nrg/ntgrtd/mrkt/nrgsstmprfls/on-eng.html#s3.
12 Government of Ontario. (2019). 2017 Long-term Energy Plan: Delivering fairness and choice. Retrieved
from: https://www.ontario.ca/document/2017-long-term-energy-plan.
115.0 Energy Consumption & Greenhouse Gas Emissions Data
The annual electricity and natural gas consumption between 2011 and 2018 can be found in section 5.1
Energy Consumption Data and the annual greenhouse gas emissions between the same time period can
be found in section 5.2 Absolute Greenhouse Gas Emissions. The established baseline year for Niagara
College is 2011 as it is the year that Niagara College has the most confidence in the quality of the data
available.
5.1 Energy Consumption Data
From 2014 to 2018 electricity consumption and natural gas consumption can be seen fluctuating every
year. While there is a decrease some years, increased consumption can also be seen. Overall
consumption is increasing however, it is important to note that these numbers vary due to the addition of
new buildings. In 2018, the Maid of the Mist Campus in Niagara Falls was sold and therefore consumption
values for that campus are not reflected past the selling date. The annual electricity, and natural gas can be
seen in Table 3: Summary of Electricity and Natural Gas from 2011-2018. A visual representation of the
electricity data can be found in Figure 2 and the natural gas can be found in Figure 3.
Table 3: Summary of Electricity and Natural Gas from 2011-2018
Electricity Consumption (kWh)
Campus 2011 2012 2013 2014 2015 2016 2017 2018
NOTL 7,792,800 7,785251 7,871,159 7,795,958 7,799,040 7,853,417 8,007,828 8,132,127
Welland 9,190,148 10,794,563 10,564,397 10,113,013 10,277,450 10,448,174 9,924,858 10,100,449
Niagara Falls 661,953 629,434 658,641 678,687 655,594 655,873 541,976 94,541
Natural Gas Consumption (m )
3
Campus 2011 2012 2013 2014 2015 2016 2017 2018
NOTL 931,595 750,529 953,152 1,134,135 1,144,285 1,164,502 1,194,440 1,285,901
Welland 826,454 707,011 749,992 769,917 741,112 698,173 696,230 479,668
Niagara Falls 40,831 37,692 42,494 40,004 32,080 49,897 67,149 18,863
12Figure 2: Electricity Consumption per Campus from 2011-2018
25,000,000
20,000,000
15,000,000
Clonsumption (kWh)
10,000,000
5,000,000
0
2011 2012 2013 2014 2015 2016 2017 2018
Year
Welland Niagara-on-the-Lake Campus Niagara Falls Campus
Figure 3: Natural Gas Consumption per campus from 2011-2018
2,500,000
2,000,000
1,500,000
Consumption (m3)
1,000,000
500,000
0
2011 2012 2013 2014 2015 2016 2017 2018
Year
Welland Campus Niagara-on-the-Lake Campus Niagara Falls Campus
135.2 Absolute Greenhouse Gas Emissions Data
Since 2011 was the baseline year, the goal is to reduce greenhouse gas emissions from that year. Over the
2012-2017 span, a reduction in greenhouse gas emissions was seen overall. There were some fluctuations
but generally greenhouse gas emissions were reduced since 2011. The greatest increases in greenhouse
gas emissions was seen in 2016 and 2017. However, with campus expansions, increases in electricity
were also seen in that year along with square footage. The total annual greenhouse gas emissions broken
down by scope for Niagara College can be seen in Table 4: Niagara College Annual Absolute Greenhouse
Gas Emissions and is visually illustrated in Figure 4: Niagara College Annual Absolute Greenhouse Gas
Emissions Broken Down by Scope.
Table 4: Niagara College Annual Absolute Greenhouse Gas Emissions by Scope
Annual GHG Emission Summary
Scope Activity 2011 2012 2013 2014 2015 2016 2017 2018
Fleet
42.96 33.77 49.15 42.10 88.12 100.00 91.90 94.36
Vehicles
Scope 1
Stationary
3,323.82 2,756.23 3,234.88 3,616.47 3,581.04 3,537.88 3,591.05 3,902.55
Consumption
Electricity
Scope 2
Consumption 1,940.94 2,113.02 1,527.54 929.38 805.48 758.30 369.49 366.54
Business
Scope 3 Travel 406.97 747.06 442.32 222.24 360.10 796.90 756.22 320.00
Water 7.59 7.97 5.00 3.03 2.59 2.61 1.17 1.31
Total 5,722.28 5,658.04 5,258.89 4,813.22 4,837.32 5,195.68 4,809.83 4,684.77
14Figure 4: Niagara College Annual Absolute Greenhouse Gas Emissions Broken Down by Scope
6,000
5,000
Annual GHG Emissions (tCO2e)
4,000
3,000
2,000
1,000
0
2011 2012 2013 2014 2015 2016 2017 2018
Year
Fleet Vehicles Stationary Consumption Electricity Consumption Business Travel Water
6.0 Projects and Proposed Cost and Savings
Niagara College has completed many energy savings projects to make significant reductions in energy
consumption despite an increase in square footage and student population. Niagara College has also
outlined a number of projects that will continue to reduce energy consumption on campus. The following
sections will outline both the historic projects completed, and future projects to reduce energy consumption.
6.1 Historic GHG Reduction Project Projections (2013-2018)
There have been many projects that were implemented to reduce greenhouse gases. Some of these
projects included LED retrofits, lighting control system adjustments, HVAC schedule and setpoint
optimization, boiler replacements, and central cooling plant upgrades. A full list of historic projects can be
seen in Table 5: Historic GHG Project Projections (2013-2018).
156.2 Future GHG Reduction Project Projections
A list of projects have been announced in order to achieve greenhouse gas reduction plans of 37% by 2030
and 80% by 2050. For a full view of projects please review Section 13.2 of the Appendix. The projects will
contribute the goals identified in the Climate Change Adaptation Plan and other greenhouse gas reduction
objectives. Figure 3 below shows the future projects that will be implemented over the years with expected
targets, and greenhouse gas projections. These projects will gradually decrease greenhouse gas emissions
over time and meet the 2030 and 2050 goals. All of the projects that have been outlined in Table 6 and
Table 7 are funding dependent.
7.0 Continuous Improvement and Community Engagement
Niagara College is committed to continuously improving on targets set in the past and future. This
commitment is to be followed through a few proposed mechanisms. The following list outlines the
mechanisms to ensure improvement and accountability:
− Host Sustainability Committee meetings three times per year
− Establish working groups needed to accomplish action items
− Develop an inventory of sustainability projects and initiatives, and maintain the updated inventory s
progress towards targets is achieved
− Annual meetings with all departments to review action items, and establish and maintain
accountability mechanisms and progress
To ensure success, communication and engagement is required. Sustainability plans and associated
actions will be communicated throughout the college community. This will be done through annual progress
reports and the incorporation of experiential learning opportunities for students, employees, and community
members. The Board of Governors will also be provided with annual updates. The STARS rating will be
updated and events that target sustainability plan will be made, and an engagement campaign will be
developed by working alongside with the Niagara College Marketing Department. 13
13 Niagara College. (2019). Sustainability Plan 2019-2021. Retrieved from:
https://sustainability.niagaracollege.ca/about/sustainability-plan-2019-2021/.
168.0 References
Government of Ontario (2019). 2017 Long-term Energy Plan: Delivering fairness and choice. Retrieved
from: https://www.ontario.ca/document/2017-long-term-energy-plan.
National Energy Board (2019). Provincial and Territorial Energy Profiles-Ontario. Retrieved from: https://www.neb-
one.gc.ca/nrg/ntgrtd/mrkt/nrgsstmprfls/on-eng.html#s3.
Niagara College (2019). Campus Redevelopment: Projects. Retrieved from:
https://www.niagaracollege.ca/campusredevelopment/projects/.
Niagara College (2018). Niagara College’s Green Automotive Technology Lab Officially Opens. Retrieved from:
https://www.niagaracollege.ca/blog/2018/04/04/niagara-colleges-green-automotive-technology-lab-officially-opens/.
Niagara College (2019). Partnerships. Retrieved from: https://sustainability.niagaracollege.ca/about/partnerships/.
17Appendices
Appendix A: Historic and Future Project Projections
A list of the historic energy conservation and efficiency projects, as well as the energy savings and greenhouse gas emission can be found in Table
5: Historic GHG Project Projections (2013-2018). A list of future projects have also been identified to help Niagara College achieve the energy and
greenhouse gas targets set out in the Niagara College Sustainability Plan. Table 7Table 6 summarizes the projects identified to be completed
between 2019 and 2030 and Figure 6 summarizes the projects identified to be completed between 2030 and 2050.
Table 5: Historic GHG Project Projections (2013-2018)
Historic GHG Reduction Project Projections (2013 – 2018)
Annual Cumulative Projected Savings Cumulative Projected Savings
NC Simple
Annual Annual Utility Reduction 2030 2050
Cost Support Total Payback Total Total
Year Campus Wing Project Rebate Savings
($) Funds Carbon Period Natural Carbon Carbon
($) Natural Electricity Cost Electricity Natural Gas
($) Reduction (years) Gas Reduction Cost Reduction
kWh Gas (tCO 2 e) Savings Savings (tCO 2 e) Savings Savings (tCO 2 e)
Savings Savings ($)
(m3) (kWh) ($) (kWh) (m3)
(m3)
Feb-13 W R TC14a Induction Lighting
4,118 0 1,136 1 8,736 0 0 0 0 0 0 4 147,784 0 22,214 6
LED retrofit
Jun-13 W LC Lutron adjustment
0 0 14,632 16 112,555 0 0 5 0 0 5 0 1,866,532 0 281,543 80
Jun-13 W Ath Lutron adjustment
0 0 1,235 1 9,499 0 0 0 0 0 0 0 157,524 0 23,761 7
Jun-13 W R Lutron adjustment
0 0 1,719 2 13,226 0 0 1 0 0 1 0 219,336 0 33,084 9
Jun-13 W AHI Lutron adjustment
0 0 7,254 7 55,803 0 0 2 0 0 2 0 925,404 0 139,586 40
Jun-13 NOTL Main President's Office PAR38
506 0 737 1 5,670 0 0 0 0 0 0 1 94,022 0 14,182 4
LED
Jul-13 W All Demand Response 0 0 1,170 300 9,000 0 0 0 0 0 0 0 148,500 0 22,419 6
Jul-13 NOTL All Demand Response 0 0 1,034 265 7,950 0 0 0 0 0 0 0 131,175 0 19,804 6
Jul-13 W A Lighting retrofit 0 0 8,008 22 61,601 0 0 3 0 0 3 0 1,016,421 0 153,451 44
Aug-13 NOTL Res Shower head retrofit 715 660 517 0 0 1,667 382 0 3 0 3 0 0 27,368 0 52
Aug-13 W Res Shower head retrofit
777 720 2,374 0 0 7,659 1,756 0 15 0 15 0 0 125,729 0 240
Aug-13 W Main Hamilton Room
27,799 7,722 15,574 9 119,803 0 0 5 0 0 5 1 1,966,772 0 297,195 85
Lights/VAV
Aug-13 NOTL B Boiler (Electric to Gas) 0 0 -3,499 34 36,071 -26,413 0 2 -50 0 -49 0 592,166 -433,613 89,481 -798
Aug-13 W V Radioroom LED retrofit
711 368 1,232 1 9,474 0 0 0 0 0 0 0 155,535 0 23,503 7
Aug-13 W All Chiller Set point - 6°C up
0 0 56,872 182 437,479 0 0 19 0 0 19 0 7,181,949 0 1,085,250 309
to 10°C
Aug-13 W All Chiller- Adjust Chiller
0 0 4,833 0 37,180 0 0 2 0 0 2 0 610,366 0 92,231 26
Operating Hours
18Aug-13 W All AHU Operating Hours
0 0 65,280 0 354,121 62,078 0 15 118 0 133 0 5,813,479 1,019,120 879,157 2,186
reduction
Sep-13 W S 2nd Floor Light retrofit
0 0 2,035 2 15,655 0 0 1 0 0 1 0 255,697 0 38,697 11
Mar-14 W Main Chiller winter shutoff
7,900 0 46,862 0 360,477 0 0 16 0 0 16 0 5,707,553 0 867,833 245
Apr-14 W Lib AHU Operating Hours
0 0 636 0 4,893 0 0 0 0 0 0 0 77,067 0 11,727 3
Apr-14 W All LED MR16 PAR30 3,344 1,672 7,121 6 54,775 0 0 2 0 0 2 0 862,702 0 131,279 37
Phase 1
Apr-14 W L LED retrofit 0 0 2,035 2 15,655 0 0 1 0 0 1 0 246,565 0 37,520 11
Apr-14 W R Decorative Track Lighting 0 0 2,505 2 19,272 0 0 1 0 0 1 0 303,534 0 46,189 13
removal
May-14 W Lib Library LED PAR38 415 207 693 1 5,329 0 0 0 0 0 0 0 83,487 0 12,715 4
May-14 W All Hot water heater setpoint 0 0 0 0 0 0 0 0 0 0 0 0 0 0 0 0
adjustment
Jun-14 W All Chiller Increase set point 0 0 5,429 0 41,760 0 0 2 0 0 2 0 650,764 0 99,190 28
Jun-14 W R Outdoor 8 fixtures LED 2,234 103 268 0 2,059 0 0 0 0 0 0 8 32,083 0 4,890 1
retrofit
Jun-14 NOTL Main President's Office Lobby 518 259 1,150 1 8,850 0 0 0 0 0 0 0 137,906 0 21,020 6
Jun-14 NOTL Main Chiller 2 overnight 0 0 2,860 0 22,000 0 0 1 0 0 1 0 342,833 0 52,255 15
setpoint adjustment
Table 6: Future GHG Reduction Project Projections (2018-2030)
Future GHG Reduction Project Projections (2019 – 2030)
Annual Cumulative Projected Savings Cumulative Projected Savings
NC Simple
Annual Annual Utility Reduction 2030 2050
Cost Support Total Payback Total Total
Year Campus Wing Project Rebate Savings
($) Funds Carbon Period Natural Carbon Carbon
($) Natural Electricity Cost Electricity Natural Gas
($) Reduction (years) Gas Reduction Cost Reduction
kWh Gas (tCO 2 e) Savings Savings (tCO 2 e) Savings Savings (tCO 2 e)
Savings Savings ($)
(m3) (kWh) ($) (kWh) (m3)
(m3)
2019 NOTL Main NOTL Boilers 1,100,000 1,100,000 3,700 11,470 0 37,000 70 96 0 407,000 126,170 773 0 1,147,000 355,570 2,179
replacement
2019 NOTL Ex West Parking Lot LED 120,000 120,000 3,973 10,330 79,465 0 3 11 874,115 0 113,635 38 2,463,415 0 320,244 106
2020 NOTL CFWI Benchmark Lobby LED 2,387 0 770 2,002 15,399 0 1 1 153,994 0 20,019 7 461,982 0 60,058 20
Fixture retrofit
2020 NOTL Main Replace HRU (3 Units) 500,000 0 28,724 75,087 287,244 121,760 244 6 2,872,444 1,217,595 750,872 2,436 8,617,333 3,652,786 2,252,617 7,308
2020 NOTL Main 200 ton Geothermal 1,500,000 0 0 509 -789,200 332,598 598 2,944 -7,892,000 3,325,983 5,095 5,978 -23,676,000 9,977,950 15,284 17,934
System - Phase 1
2020 NOTL Main Office motion sensors 30,000 0 14,250 37,050 285,000 0 12 0 2,850,000 0 370,500 123 8,550,000 0 1,111,500 368
2021 NOTL CL Computer upgrade 100,000 0 14,144 18,387 141,440 0 6 5 1,272,960 0 165,485 55 4,101,760 0 533,229 176
W
192021 W All Hallway motion sensors 80,000 50,000 30,000 78,000 600,000 0 26 1 5,400,000 0 702,000 232 17,400,000 0 2,262,000 748
2021 W Main Office motion sensors 45,000 30,000 21,375 55,575 427,500 0 18 0 3,847,500 0 500,175 165 12,397,500 0 1,611,675 533
2022 W Main 200 ton Geothermal 1,500,000 0 0 509 -789,200 332,598 598 2,944 -6,313,600 2,660,787 4,076 4,782 -22,097,600 9,312,753 14,266 16,738
System - Phase 1
2022 W Ex Parking Lot LED Lighting 360,000 0 11,920 30,991 238,395 0 10 11 1,907,160 0 247,931 82 6,675,060 0 867,758 287
(Lot B,C,D,G)
2023 W V Lighting upgrades 382,900 0 5,691 14,795 113,811 0 5 25 796,677 0 103,568 34 3,072,897 0 399,477 132
2025 NOTL Main Solar Car Port 8,767,336 0 244,449 317,784 2,444,494 0 105 27 12,222,470 0 1,588,921 526 61,112,350 0 7,944,606 2,628
2025 W V. Rooftop Solar PV 687,500 0 54,624 71,011 546,239 0 23 9 2,731,195 0 355,055 117 13,655,975 0 1,775,277 587
2025 W L HVAC Ventilation 1,573,200 0 6,500 10,000 65,000 5,000 12 157 325,000 25,000 50,000 61 1,625,000 125,000 250,000 307
upgrades
2025 W V Voyageur HVAC 1,969,200 0 15,555 26,711 155,545 20,936 46 73 777,725 104,680 133,555 232 3,888,625 523,400 667,775 1,161
Ventilation upgrades
2025 W V Rooftop Solar PV 687,500 0 54,624 71,011 546,239 0 23 9 2,731,195 0 355,055 117 13,655,975 0 1,775,277 587
2026 W L Lighting upgrades 517,300 0 5,136 13,353 102,712 0 4 38 410,848 0 53,410 18 2,465,088 0 320,461 106
2027 W L, V, Building Envelop upgrade 4,187,250 0 0 15,639 0 50,447 96 268 0 151,341 46,916 287 0 1,160,281 359,687 2,204
M
2028 W S Building Envelop upgrade 2,093,625 0 0 7,819 0 25,224 48 268 0 50,447 15,639 96 0 554,917 172,024 1,054
2029 NOTL Main Building Envelop upgrade 8,374,500 0 0 31,277 0 100,894 192 268 0 100,894 31,277 192 0 2,118,774 656,820 4,024
20Table 7: Future GHG Reduction Project Projections (2030-2050)
Future GHG Reduction Project Projections (2030 – 2050)
Annual Cumulative Projected Savings Cumulative Projected Savings
NC Simple
Annual Annual Utility Reduction 2030 2050
Cost Support Total Payback Total Total
Year Campus Wing Project Rebate Savings
($) Funds Carbon Period Natural Carbon Carbon
($) Natural Electricity Cost Electricity Natural Gas
($) Reduction (years) Gas Reduction Cost Reduction
kWh Gas (tCO 2 e) Savings Savings (tCO 2 e) Savings Savings (tCO 2 e)
Savings Savings ($)
(m3) (kWh) ($) (kWh) (m3)
(m3)
2031 W V Facade Solar PV 429,000 0 3,277 4,260 32,773 0 1 100 N/A N/A N/A N/A 622,687 0 80,949 27
2033 NOTL Main Facade Solar PV 858,000 0 6,555 8,521 65,546 0 3 100 N/A N/A N/A N/A 1,114,282 0 144,857 48
2035 NOTL Main 200 ton Geothermal 1,500,000 0 509 -789,200 332,598 598 2,944 N/A N/A N/A N/A -11,838,000 4,988,975 7,642 8,967
System - Phase 2
2035 W L Lundy Solar Tracking 37,500 0 307 798 6,141 0 0 47 N/A N/A N/A N/A 92,115 0 11,975 4
Skylights
2035 W M Merritt Solar Tracking 37,500 0 177 460 3,535 0 0 81 N/A N/A N/A N/A 53,025 0 6,893 2
Skylights
2037 W Main Solar Car Port 8,767,336 0 244,449 317,784 2,444,494 0 105 27 N/A N/A N/A N/A 31,778,422 0 4,131,195 1,366
2040 W Main 200 ton Geothermal 1,500,000 0 509 -789,200 332,598 598 2,944 N/A N/A N/A N/A -7,892,000 3,325,983 5,095 5,978
System - Phase 2
2042 W Main Solar Car Port 8,767,336 0 244,449 317,784 2,444,494 0 105 27 N/A N/A N/A N/A 19,555,952 0 2,542,274 841
2044 W Main 200 ton Geothermal 1,500,000 0 509 -789,200 332,598 598 2,944 N/A N/A N/A N/A -4,735,200 1,995,590 3,057 3,587
System - Phase 3
2046 NOTL Main 200 ton Geothermal 1,500,000 0 509 -789,200 332,598 598 2,944 N/A N/A N/A N/A -3,156,800 1,330,393 2,038 2,391
System - Phase 3
1,550,958 6,310,267 2,356,850 4,748 N/A 24,967,683 8,043,727 5,739,354 16,352 139,963,843 40,213,803 30,743,977 82,399
TOTAL 59,474,369 1,300,000 1,014,649
21Appendix B: Niagara College Campus Maps
Campus maps for the Niagara-on-the-Lake and Welland can be found in this section. Figure 7, Figure 8, Figure 9, and Figure 10 illustrate the
building layouts at the Niagara-on-the-Lake campus. Figure 11, Figure 12, and Figure 13 illustrate the building layouts at the Welland Campus.
Figure 7: Niagara-on-the-Lake Main Building Layout - Ground Floor
22Figure 8: Niagara-on-the-Lake Main Building Layout - Floor 1
23Figure 9: Niagara-on-the-Lake Main Building Layout - Floor 2
24Figure 10: Niagara-on-the-Lake-Canadian Food & Wine Institute, Greenhouse Nursery, Teaching Brewery, Wine Visitor and Education Centre
Building Layout
25Figure 11: Welland Campus Main Building Layout - Floor 1
26Figure 12: Welland Campus Main Building Layout - Floor 2 & 3
27Figure 13: Welland Campus Green Automotive Technology, Walker Advanced Manufacturing Innovation Centre, Ranking Technology, Black Walnut
Building, and Pavillion Building Layout
28You can also read


