Separating individual contributions of major Siberian rivers in the Transpolar Drift of the Arctic Ocean
←
→
Page content transcription
If your browser does not render page correctly, please read the page content below
www.nature.com/scientificreports
OPEN Separating individual contributions
of major Siberian rivers
in the Transpolar Drift of the Arctic
Ocean
Ronja Paffrath1*, Georgi Laukert2, Dorothea Bauch2,3, Michiel Rutgers van der Loeff4 &
Katharina Pahnke1
The Siberian rivers supply large amounts of freshwater and terrestrial derived material to the Arctic
Ocean. Although riverine freshwater and constituents have been identified in the central Arctic
Ocean, the individual contributions of the Siberian rivers to and their spatiotemporal distributions
in the Transpolar Drift (TPD), the major wind-driven current in the Eurasian sector of the Arctic
Ocean, are unknown. Determining the influence of individual Siberian rivers downstream the TPD,
however, is critical to forecast responses in polar and sub-polar hydrography and biogeochemistry to
the anticipated individual changes in river discharge and freshwater composition. Here, we identify
the contributions from the largest Siberian river systems, the Lena and Yenisei/Ob, in the TPD using
dissolved neodymium isotopes and rare earth element concentrations. We further demonstrate
their vertical and lateral separation that is likely due to distinct temporal emplacements of Lena and
Yenisei/Ob waters in the TPD as well as prior mixing of Yenisei/Ob water with ambient waters.
The Arctic Ocean is unique with respect to its high freshwater input from the Siberian and North American rivers
(11% of global river discharge), which not only influences circulation, stratification and deep water formation in
the high northern latitudes1 but also affects water column biogeochemistry and ecosystem functioning through
addition of large amounts of river-borne macro- and micronutrients, as well as lithogenic elements to the open
ocean2–11. The Siberian river influence, in particular, extends at least to the central Arctic Ocean, which is evident
from elevated freshwater fractions and enhanced concentrations of river-borne nutrients and trace metals in the
Transpolar Drift (TPD)7,8,11, a wind-driven sea ice and surface water current (1 to 5 km/day11,12) extending from
the Siberian Shelf to the Fram Strait (see Fig. 1). The exact contributions of the individual Siberian rivers to the
TPD and their spatiotemporal distribution within the TPD, however, have not been determined until now. The
Siberian rivers extend over large areas and drain different regions influenced by highly distinct geologic, biologic
and climatic conditions. Notably, the catchment areas of the Yenisei, Ob and Lena rivers, the largest Siberian
river systems, are subject to no or continuous permafrost and entirely continuous permafrost, r espectively13,14.
This suggests that they will react differently to further warming, including irregular changes in river runoff and
associated changes in riverine trace element, carbon and nutrient fluxes15. Predicted warming and associated
changes in sea-ice extent, thickness and dynamics16 will also involve a significant reduction of sea-ice transport
via the TPD17. In turn, this will affect upper water column stratification and circulation18 with adjustments of
freshwater pathways and hence alterations in nutrient bioavailability and cycling, primary production and plank-
tonic food webs. For evaluation of future climate impacts on sea-ice cover, stratification and circulation, as well
as elemental fluxes and budgets and biological activity in the high northern latitudes, the spatial distribution and
temporal variability of individual riverine contributions to and in the TPD need to be known.
Salinity, stable oxygen isotopes (δ18O) and nutrient relationships (e.g. N/P and/or P O4* (initial phosphate
corrected for mineralization with oxygen, P O43− + O2/175 − 1.95 µmol/kg)) have been widely applied in the Arctic
Ocean to determine the fractions of Atlantic, Pacific, meteoric water and sea-ice m elt3,19–21. However, the distinc-
tion between Pacific and Atlantic water contributions based on nutrient relationships remains challenging and
1
Marine Isotope Geochemistry, Institute for Chemistry and Biology of the Marine Environment (ICBM),
University of Oldenburg, Carl‑von‑Ossietzky‑Str. 9‑11, 26129 Oldenburg, Germany. 2GEOMAR Helmholtz
Centre for Ocean Research Kiel, Wischhofstr. 1‑3, 24148 Kiel, Germany. 3Leibniz‑Labor, University of Kiel (CAU),
Max‑Eyth‑Str. 11‑13, 24118 Kiel, Germany. 4Alfred Wegener Institute, Helmholtz Centre for Polar and Marine
Research, Am Handelshafen 12, 27570 Bremerhaven, Germany. *email: ronja.paffrath@uni-oldenburg.de
Scientific Reports | (2021) 11:8216 | https://doi.org/10.1038/s41598-021-86948-y 1
Vol.:(0123456789)www.nature.com/scientificreports/
180˚W
65˚N
Kolyma
Bering [Nd] = 129 pmol/kg
Strait
100 m 70˚N εNd = -6.0
Ø = 103 km3/year
Chukchi
Sea
East Sibirian
75˚N Sea
500 m
Lena
[Nd] = 744 pmol/kg
εNd = -15.7
80˚N
Laptev Ø = 485 km3/year
Sea
n
si
1000 m
Ba
da
ge
id
na
n
-R
Ca
si
85˚N 125
ev
Ba
Yenisei
n
le
Vilkitsky
si
de
101
en
Ba
117 Strait [Nd] = 154 pmol/kg
en
ds
ov
M
ge
un
εNd = -5.2
a-
ar
id
Am
ph
-R
ak
ge
Ø = 579 km3/year
Al
el
M
96
90˚W
90˚E
id
k
ak
-R
69
n
G
ov
St. Anna
si
2000 m 58
81
os
Ba
Trough
on
en
TPD
m
ns
Lo
50
Na
Kara
40 Sea
3000 m
32
Fram
Strait Barents
Greenland Sea Ob
[Nd] = 2152 pmol/kg
4000 m
εNd = -6.1
Ø = 394 km3/year
5000 m
0˚
Figure 1. Map of the study region. Station locations along the GEOTRACES GN04 cruise transect in the
central Arctic Ocean as turquoise dots. Black squares mark the locations of stations sampled for R EEs6,24,27,28,31,32.
Green triangles mark the location of data for the Laptev Shelf (for the Lena plume in 2013 and 2014 and
the Vilkitsky Strait)26. Dark red arrows mark the areas of river input, the boxes provide river water Nd
concentrations, εNd composition26,27 and average annual river d ischarge62. Arrows show the schematic
circulation of surface water . TPD: Transpolar Drift. The map was produced using Ocean Data View64 (version
63
5.1.7, https://odv.awi.de/) and modified manually.
yields high uncertainties in the Pacific and Atlantic water f ractions3,22,23, which inhibits reliable assessments of
the water mass distribution in the upper water column of the open Arctic Ocean. Alternative assessments based
on dissolved lithogenic trace elements and their isotopes, such as rare earth elements (REEs) and neodymium
isotope ratios (143Nd/144Nd, expressed as εNd, see ‘Methods’), can help to disentangle contributing water masses
and thus provide a better understanding of recent and upcoming changes in water mass distribution and mix-
ing. Both REEs and εNd are essentially biologically inactive provenance tracers and are therefore ideally suited
to characterize the origin and transport pathways of waters contributing to the upper central Arctic Ocean
and the TPD, given the highly varying REE concentrations ([REE]) and the distinct εNd signatures of Atlantic
(εNd = − 11.76) and Pacific (εNd = − 5.524,25) inflows, as well as the major Siberian rivers including the Lena river
(εNd = − 15.726), and the Yenisei and Ob rivers (εNd = − 5.2 and εNd = − 6.1, respectively27). Previous studies based
on REEs and εNd have identified Atlantic water as the main contributing water mass to the Arctic Ocean and
suggested its recirculation and outflow through the Fram Strait after cooling and partial mixing with Pacific and
river water6,24,28. Strongly elevated [REE] and a wide range of Nd isotope compositions in Arctic surface waters
have been related to inputs from Siberian r ivers24,27–30, which are marked by variable but overall high [REE] and
characteristic εNd signatures (Fig. 1). Marginal Arctic regions such as the Laptev Sea, the Barents Sea and the
Canadian Shelf areas were thoroughly investigated in the recent past for Nd isotope and REE b ehavior26,31,32.
However, in the central Arctic Ocean, existing REE and Nd isotope d ata24,27,28 are sparse (Fig. 1 and Fig. S1) and
Scientific Reports | (2021) 11:8216 | https://doi.org/10.1038/s41598-021-86948-y 2
Vol:.(1234567890)www.nature.com/scientificreports/
Figure 2. Vertical distribution of Nd concentration and Nd isotope composition. Water column profiles of Nd
concentrations (left) and εNd (right) for all stations along the transect. Stations outside the TPD are shown in
brownish colors, stations within the TPD in blueish colors. Error bars are external errors for Nd concentrations
(1SD, error bars usually smaller than the symbols) and propagated errors for εNd (2SD).
their resolution in the upper water column is too poor to identify individual river water contributions. Here,
we present a comprehensive dataset comprising dissolved εNd and [REE] as well as δ18O from samples collected
along the GEOTRACES transect GN04 (Fig. 1). Based on these tracer distributions we show that individual
contributions of the major Siberian river systems, the Lena and Yenisei/Ob, are preserved along the TPD and
largely do not mix during transport.
Results
Hydrography and water components based on salinity, δ18O and nutrients. The uppermost
water column (0–200 m water depth) along the cruise track of PS94 (GEOTRACES transect GN04) comprises
Polar Water (PW, including the Surface Mixed Layer and the Arctic Halocline; σθ < 27.70) characterized by a
wide range of salinities (28–34.4), and underlying Atlantic and Arctic Atlantic Water (AW, AAW) with rather
constant salinities approaching ~ 34.9 at 500 m water depth (see Rabe et al.33 and Table S1 for hydrographic data).
The TPD in the central Arctic Ocean at the time of sampling was identified based on high CDOM (colored dis-
solved organic matter) fl uorescence8 and is marked by low salinities due to river input. Outside the TPD, the
PW is marked by higher salinities and lower nutrient and trace element c oncentrations11. Based on the CDOM
definition, station 69 (Fig. 1) is considered to be outside the TPD. However, elevated [REE], a relatively radio-
genic εNd signal and a meteoric fraction of 2.5 to 7.1% suggest river influence from the surface down to 100 m
water depth at station 69, which is in line with long-distance transport of Siberian river water via the TPD. We
therefore consider stations 69–125 to be under the influence of the TPD, and stations 32–58 to be outside TPD
influence.
The water mass analysis using salinity, δ18O and N/P ratios (see ‘Methods’ in the Supplementary Informa-
tion) indicates a dominance of Atlantic water outside the TPD (i.e. at stations 32 to 58) and at all stations below
100 m depth. Meteoric contributions are highest (up to 20%) in the TPD at the surface at stations 81, 96 and 101
in line with low salinities, and decrease with depth, reaching 2–4% at 100 m water depth. Given that net in situ
precipitation is expected to be small in volume and neglectable in REE content compared to riverine discharge11,
the calculated meteoric fraction is used for the REE and εNd interpretation as an equivalent to river water. Pacific
water appears to be present in larger quantities of up to 84% at stations 96 and 101 in the Makarov Basin. How-
ever, the Pacific and meteoric fractions are moderately correlated (R2 = 0.73, not shown), suggesting a strong
shelf or riverine component in our Pacific fraction calculated based on N/P ratios. Given the above observations
and the generally high uncertainty associated with the calculations of the Pacific fraction (see Supplementary
Information for details), we refrain from using the Pacific fraction and instead focus on the meteoric water frac-
tion, which is based on salinity and δ18O only and hence essentially consistent between the different methods.
Dissolved rare earth element and εNd distributions. In the low-salinity PW of the central Arctic Ocean
with elevated meteoric fraction that marks TPD influence, [REE] are markedly elevated at the surface with [Nd]
of up to 47.4 pmol/kg and [Er] of up to 13.5 pmol/kg (stations 69–125) and rapidly decrease towards ~ 300 m
water depth (Fig. 2). In the higher salinity PW in the Nansen Basin outside the TPD (stations 32–58), where
Scientific Reports | (2021) 11:8216 | https://doi.org/10.1038/s41598-021-86948-y 3
Vol.:(0123456789)www.nature.com/scientificreports/
Atlantic water dominates, [REE] are lower between 16.2–24.2 pmol/kg for Nd and 4.7–7.1 pmol/kg for Er and
rather constant with depth (Fig. 2, Table S1). The [REE] in these two areas converge below 200–300 m water
depth, where the Atlantic water fraction is near 100% at all stations, to values of 17.0 ± 1.2 (1SD) pmol/kg Nd and
4.9 ± 0.2 (1SD) pmol/kg Er at 500 m water depth. The high [REE] in the upper water column (< 200 m) within the
TPD correlate with the fraction of meteoric water (R2 = 0.49 and 0.65 for Nd and Er, respectively, p-value < 0.05
for both) and dissolved organic carbon (DOC11) (R2 = 0.78 and 0.88 for Nd and Er, respectively, p-value < 0.05
for both; Fig. S2), suggesting substantial terrestrial input of dissolved REEs via the Siberian rivers and transport
of their discharge via the TPD.
The PAAS-normalized REE patterns of all samples mirror the typical characteristics of seawater with a pro-
nounced Ce anomaly and an enrichment of heavy REEs (HREEs) over light REEs (LREEs) (Fig. S3), reflecting
the stronger particle reactivity of LREEs compared to HREEs34. The HREE/LREE ratios along the transect,
depicting scavenging-release behavior of the REEs, range between 3.1 and 4.7 (Fig. 3). Higher ratios (HREE/
LREE = 4.0–4.7) that do not correlate with [Nd] are only observed in surface samples with meteoric water contri-
bution (fmet > 2%, st. 69–125, Fig. S4). These high HREE/LREE ratios suggest REE scavenging in the Siberian river
estuaries26,35 and no additional change along the TPD transport pathway. In the Lena estuary, such scavenging
has been observed to cause higher LREE than HREE r emoval26, resulting in higher HREE/LREE ratios compared
to those in the Atlantic water. Lower ratios (3.1–4.4) that correlate with [Nd] but not with [Er], occur in samples
without meteoric contribution (stations 32–58 and samples from > 100 m depth) and support the presence of
pristine Atlantic water as these HREE/LREE ratios are identical to those reported for Atlantic inflow from Fram
Strait6. Enhanced [Nd] compared to the Atlantic inflow could be a result of some release of REEs from particles.
The distribution of dissolved εNd along the transect supports our allocation of the stations with respect to
TPD influence. Within the TPD, dissolved εNd exhibits a wide range of values (εNd = − 7.9 to − 12.2, Fig. 3b) and
significant and strong vertical and lateral gradients for such a small depth and distance range in the open ocean,
marking contributions from the Siberian rivers with their different characteristic εNd signatures (see Introduc-
tion). In contrast, dissolved εNd outside the TPD influence is in a narrow range (within εNd = − 9.8 to − 11.8, getting
more radiogenic along the flowpath of the waters), in line with a dominant Atlantic water influence (inflowing
Atlantic water εNd = − 11.7 at Fram Strait6) and no significant contributions from rivers or Pacific water (Fig. 2,
Table S1). A pronounced feature within the TPD is a radiogenic Nd isotope band with εNd = − 8.6 ± 0.2 (n = 5,
st. 69–125) at 100 m water depth that shoals towards station 69 (Fig. 3b). These positive εNd signatures suggest
strong influence of a radiogenic εNd source such as the Yenisei/Ob rivers or Pacific water.
Dissolved REE and εNd behavior in the central Arctic Ocean. The correlation of [REE] with the
meteoric fraction and DOC (Fig. S2) in the TPD suggests predominant dissolved input of REEs via the Siberian
rivers11, as DOC concentrations in Arctic rivers are high and mix conservatively in the e stuaries36. Part of the
scatter in the [REE]-meteoric water correlations may be linked to [REE] redistribution on the shelves due to sea-
ice formation and m elting26, which could also result in a decoupling of HREE/LREE ratios from the meteoric
water fraction. During ice production, REEs can be incorporated into the ice, transported with the ice, and then
released upon melting. These REE redistribution mechanisms are suggested to occur analogous to the redistri-
bution of salt37. The scatter at higher meteoric water fractions is likely due to varying relative contributions of
the Siberian rivers with their different [REE] and potential seasonal and interannual variations (Ob: 2152 pmol/
kg Nd, early summer high discharge27, Yenisei: 154 pmol/kg Nd, early summer high discharge27; Lena: 477–
824 pmol/kg Nd, early summer high discharge24,26,27,38; 744 pmol/kg Nd, winter discharge26).
The [Nd] in the TPD is further lower than discharge-weighted river contributions of [Nd]11 assuming 75%
REE removal in the estuaries26, suggesting a Nd deficit in TPD surface waters and hence providing no direct
evidence for REE contributions from particulate phases (either on the shelves or via Nd release from suspended
particles). This is in line with observations from the Lena river and Severnaya Dvina river estuaries and Kara Sea
freshwater, where the only documented process influencing dissolved [REE] is their removal in the low salinity
region26,35. However, REE removal in the low salinity zones of the Lena and Dvina estuaries is not as strong as
in other estuaries26,35, indicating fundamentally different riverine and estuarine settings that may also explain
the lack of significant net release of REEs. On the one hand, the total load of suspended matter in the fluvial
input to the Arctic Ocean is very low, about one order of magnitude lower than the global average river particle
load39, which limits the potential for REE release. On the other hand, the composition of nanoparticles and col-
loids has been shown to influence the release behavior of REEs, with reduced REE release in rivers with a high
ratio of organic to inorganic constituents40, such as in the Siberian rivers36, limiting REE release. The dominant
process supplying REEs to the TPD is therefore dissolved riverine input, with little influence of REE release from
particles or shelf sediments. This is in contrast with data from the Canada B asin32 and Chukchi S ea25, where shelf
REE contributions were invoked. Furthermore, even if we cannot rule out any contribution of the Mackenzie
river, it would be neglectable, given that most discharge of this river is distributed along the Canadian coast and
seems to be restricted to 200–400 km into the Beaufort S ea41,42. High terrestrial dissolved input and conservative
behavior in the TPD has previously been suggested for a number of other trace elements, DOC and silicic acid
from previous cruises including the European (this study) and the US GEOTRACES c ruises2–8,11. High terrestrial
REE input is supported by the wide range of εNd signatures in surface waters with high meteoric fractions and
low salinities, that deviate from the dominant marine source of AW in this area.
Outside the TPD, where purely marine conditions with nearly 100% Atlantic fraction prevail even at the sur-
face, the vertically constant [REE] distribution (Figs. 2, 3) is consistent with observations from the Canada B asin32
6
and the Fram Strait . Yet, the [REE] distribution is unlike typical open ocean REE profiles, which exhibit surface
REE depletions over deep water [REE] due to enhanced scavenging at the surface and REE release at d epth43–45.
This suggests little to no scavenging and export of REEs from the upper to the lower water column in the central
Scientific Reports | (2021) 11:8216 | https://doi.org/10.1038/s41598-021-86948-y 4
Vol:.(1234567890)www.nature.com/scientificreports/
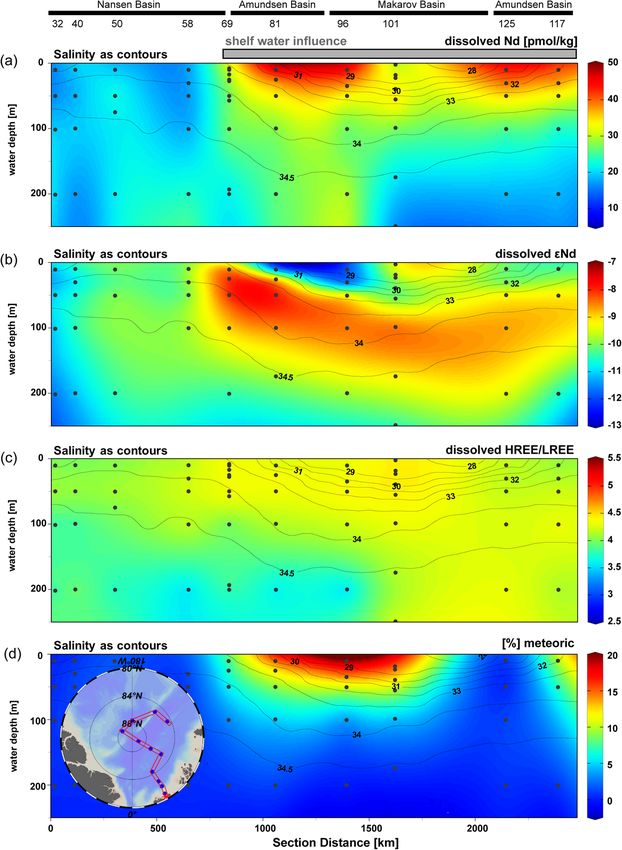
Figure 3. Distributions of REE concentrations, εNd and meteoric fraction along the cruise track with salinity
as contours. Transect from station 32 to 117 for the upper 200 m of dissolved (a) Nd concentrations, (b) εNd, (c)
PAAS-normalized HREE/LREE ratios and (d) the fraction of meteoric water in color and salinity (Rabe et al.,
201633) as contours. Station numbers and basins are given on top of the transects, the transect is shown in the
insert in panel (d). The figure was produced using Ocean Data View64 (version 5.1.7, https://odv.awi.de/) and
modified manually.
Scientific Reports | (2021) 11:8216 | https://doi.org/10.1038/s41598-021-86948-y 5
Vol.:(0123456789)www.nature.com/scientificreports/
Figure 4. Mixing plots of εNd vs. salinity. Data from samples from 10 to 200 m water depth with [Nd] in color
(upper panel) and the meteoric fraction in color (lower panel). Error bars show the propagated errors (2SD, εNd).
Grey lines represent mixing between the endmembers, grey squares show 10% mixing intervals, grey squares
at the end of the mixing lines show the endmember Atlantic and Pacific. The black arrows mark the shift in εNd
from the very unradiogenic (Lena dominance) to more radiogenic (Yenisei/Ob dominance) values with water
depths for selected stations. Grey triangles show samples from the Laptev Shelf close to Vilkitsky S trait26. The
‘radiogenic band’ comprises the samples at st. 69 10–100 m water depth, st. 81 50–100 m water depth and st.
96, 101 and 125 at 100 m water depth. Lena and Yenisei/Ob endmembers have a salinity of zero and thus are
not shown but arrows point in their direction. Endmember values can be found in Table S2. The figure was
produced using Origin (version 2019, https://www.originlab.com/) and modified manually.
Arctic Ocean. Evidence from Si isotopes and very low POC export fluxes in the Arctic indicate exceptionally
low biogenic particle concentrations and a lack of significant biogenic particle dissolution in the deeper water
column46,47. This can explain the uniquely constant REE profiles in areas and at depths not influenced by river
input and highlights the important role of organic particles for the vertical redistribution of R EEs48.
Based on this evidence, we consider the dissolved [REE] and εNd in the central Arctic Ocean upper water
column to behave largely conservatively, and their signals in the TPD to be predominantly supplied as dissolved
load by the Siberian rivers. Even if some particulate input from the riverbed sediments would occur, this would
not change the εNd signature significantly as the Siberian riverbed sediments show similar εNd signatures as the
dissolved fraction26,49. We therefore use dissolved [Nd] and εNd together with salinity and the meteoric fraction
estimates to distinguish between the different river contributions (Lena and Yenisei/Ob) within the TPD. The
dissolved εNd values along the cruise transect fall within the mixing envelopes of [Nd] versus εNd (Fig. S1) and
salinity versus εNd (Fig. 4) defined by Pacific, Atlantic, Lena and Yenisei/Ob endmembers, further supporting
largely conservative behavior of the measured [Nd] and εNd along the transect. The large range of εNd in the TPD
reflects the different εNd signatures of the potential endmembers of Atlantic water (εNd = − 11.76), modified Pacific
water emerging from the Chukchi Shelf (εNd = − 5.524,25), and the rivers Lena (εNd = − 15.726), Yenisei (εNd = − 5.227),
Scientific Reports | (2021) 11:8216 | https://doi.org/10.1038/s41598-021-86948-y 6
Vol:.(1234567890)www.nature.com/scientificreports/
and Ob (εNd = − 6.127). Yenisei and Ob are combined to one endmember due to their similar Nd isotope signatures
and discharge area in the Kara Sea resulting in a discharge-weighted combined εNd signal of − 6.0.
A mathematical approach and attempt to quantify the relative contributions of all water masses mentioned
above for the upper 500 m using salinity, oxygen isotopes, εNd and [Nd] as an alternative for the water mass
assessment based on salinity, oxygen isotopes and nutrient relationships is presented and discussed in the Sup-
plementary Information. This approach is, however, hampered by the similarity of the εNd signatures of Pacific
and Yenisei/Ob waters and by the similarity of the εNd signatures of Atlantic and Lena waters. Therefore, mixtures
of Pacific and Lena, or of Atlantic and Yenisei/Ob can both result in identical salinity, εNd, and [Nd] values. In the
northwestern Laptev Sea, for example, where Pacific water is inarguably not present, the Yenisei/Ob waters after
mixing with AW and advection via the Vilkitsky Strait50 have characteristics26 indistinguishable from those of
modified Pacific water emerging from the Chukchi S ea24. This demonstrates the unsuitability of this approach in
quantifying the exact water component fractions for the entire upper water column of the central Arctic Ocean
where waters from the Laptev and Chukchi seas could prevail. However, this method may prove useful if other
parameters become available that allow differentiation of Pacific and Yenisei/Ob water in the Arctic Ocean. For
example, a recent assessment of CDOM in the central Arctic O cean51 revealed that different organic components
can be distinguished by their fluorescence spectra, which could be helpful to tell Pacific and river water apart.
For details see Supplementary Information.
Instead, we apply salinity and δ18O to determine sea-ice melt and meteoric fractions to assess the relative
contributions of Lena and Yenisei/Ob to the TPD on the basis of Nd isotope signatures and [Nd]. We refrain from
a quantitative assessment of the rivers Lena and Yenisei/Ob as this would depend on calculated (nutrient-based)
Atlantic and Pacific fractions. The focus is on an independent qualitative and semi-quantitative assessment of the
different freshwater and marine contributions to the TPD that yet provides crucial insight into the trace element
sources and the TPD structure.
Discussion
Least radiogenic Nd isotope signatures reaching εNd = − 12.2, strongly elevated [Nd] and a high meteoric com-
ponent at the surface of stations 81 and 96 suggest strongest Lena influence (Figs. 3b and 4), underlain by more
radiogenic waters with εNd around − 8 at 25 and 50 m depth, respectively. This pattern is also seen at stations
117 and 125, but with slightly more radiogenic surface εNd of − 10.2 to − 10.5 and only a + 1 epsilon unit change
towards underlying water/subsurface depths (Fig. 4). This distribution hints at a greater influence of Lena water
at the very surface (down to maximum 30 m water depth) that is underlain by Yenisei/Ob water. At station 101
in the Makarov Basin, more radiogenic εNd values (εNd = − 9.7, average of the samples at 18–39 m water depth)
are found at the surface (Figs. 3b, 4). At this station, input from the Kolyma river (εNd = − 6.027) that is discharged
into the Canadian Basin (Makarov and Canada Basin), could be an alternative or additional radiogenic source
to enhanced contribution of Yenisei/Ob and/or Pacific water.
The differences in the amount of Lena water between stations 81/96 and 117/125 can be explained by vari-
ations in Laptev Shelf hydrography: in September 2013, Laukert et al.26 found a prominent Lena signal in the
central Laptev Sea that was then advected to the north and was incorporated in the T PD26. By September 2015,
at the sampling time for this study, these waters could have reached stations 81 and 96 according to the speed of
the TPD of 1–5 km/day11,12. In contrast, in September 2014, the Lena signal was weaker on the central Laptev
Shelf (lower [Nd] and more radiogenic εNd signal) and the Lena river water was more deflected to the east26,
in agreement with a contrasting wind situation compared to 2 01352. These shelf waters from 2014 could have
reached stations 117 and 125 by September 2015. Therefore, the annual variability and different paths of the Lena
river water found in 2013 and 2014 on the Laptev Shelf are consistent with the εNd distribution in our dataset
from the central Arctic Ocean in 2015.
The different depths of the Lena—Yenisei/Ob interface are likely the result of different density ranges of shelf
waters entering the Arctic Ocean from the Kara and Laptev S eas53. The release of shelf waters across the frontal
system along the continental shelf break occurs seasonally in pulses with large interannual variations54.Therefore,
the different εNd signals at our stations reflect different seasonal or annual contributions of river water which,
together with the spatial fluctuations of the TPD, could account for the observed differences in the location and
spatial extent of the Lena and Yenisei/Ob influence.
The radiogenic εNd band with values of − 8.3 to − 8.9 at 100 m water depth (stations 69–125) that outcrops at
station 69 (Figs. 3b, 4) suggests either enhanced Pacific and/or Yenisei/Ob contributions according to the mixing
plot (Fig. 4). The radiogenic εNd values are accompanied by elevated [Nd] of 24.3–35.9 pmol/kg and a salinity
range of 31.7–34.4. In fact, the Nd concentrations in the radiogenic band are slightly lower compared to those
in the Lena plume (on average 28 pmol/kg Nd in the radiogenic band compared to 42 pmol/kg Nd in the Lena
dominated samples). Such concentrations, at only slightly elevated meteoric fractions and εNd signatures around
− 8, can also be found in the western Laptev Sea26 and the eastern Barents Sea31. Despite relatively low estimated
meteoric fractions of 1–6% within this radiogenic band (Fig. 4), the river waters can still dominate the εNd signal
due to their very high [Nd] concentrations. Laukert et al.31, for example, clearly demonstrated for the eastern
Barents Sea that a freshwater contribution of up to 2% Ob or 3–4% Ob/Yenisei to Atlantic Water (εNd ~ − 12)
would be sufficient to cause a shift in the εNd signal to values around − 8, at Nd concentrations around 15 pmol/
kg as a result of scavenging31.
Previous studies have suggested that Pacific water is restricted to the Canadian Basin with the Pacific front
ranging from the Mendeleev Ridge to the Lomonosov Ridge and correlated with changes in atmospheric
circulation19,23,55–59. Studies based on samples from 2015 show the front of Pacific water in the halocline at the
Mendeleev Ridge23 or dominance of Pacific water up to the Lomonosov Ridge60 depending on the method.
These estimates are based on transects in the Canadian Basin, therefore no information is available for the
Scientific Reports | (2021) 11:8216 | https://doi.org/10.1038/s41598-021-86948-y 7
Vol.:(0123456789)www.nature.com/scientificreports/
Eurasian side of the Arctic Ocean. Based on the following discussion we suggest that the radiogenic signal is
rather caused by Yenisei/Ob water than Pacific water: even though Pacific water may have been present around
the North Pole in 2 01523,60, it is very unlikely that Pacific water is advected as far as station 69 in the Eurasian
Basin in high amounts . Contributions of Pacific water calculated based on salinity, δ18O and N/P are highest at
the surface at st. 96 and 101. Below the very surface and at the stations of the radiogenic band, the Pacific water
fractions range between 4 and 20%. These Pacific values are considered maximum values, given that the N/P
method ignores shelf processes altering the N to P towards lower N/P ratios and by doing so overestimates the
Pacific contribution3. But these relatively low Pacific contributions in the radiogenic band cannot account for the
corresponding εNd signatures, as most of the samples would require a dominance of Pacific water to explain the
very radiogenic signal. On the other hand, if there was a layer in the Eurasian Basin dominated by Pacific water,
we would expect its εNd signatures to approach − 6.4 to − 6.7, as seen in the Canadian Basin24. Furthermore, εNd,
[REE], salinity and δ18O characteristics similar to those in the radiogenic εNd band have been determined in the
northwestern Laptev S ea26, where the freshwater component is dominated by Yenisei/Ob freshwater26 advected
via the Vilkitsky S trait50, these samples are also shown in Fig. 4. This suggests that the northwestern Laptev Sea
is the main source region of waters within the radiogenic εNd band, supporting our hypothesis that this signal
reflects the advection of Yenisei/Ob waters. We therefore conclude that Yenisei/Ob contribution and mixing with
Atlantic water is mainly responsible for the consistently radiogenic εNd band at stations 69–125. The outcropping
of the signal at station 69 is probably a result of the absence of Lena river water overlying the band at the other
stations, a setting that is also observed in the northwestern Laptev Sea where these waters likely originate from26.
The observations described above show that the river signals can still be distinguished far along the flow
path of the TPD as the different river waters do not seem to mix entirely along the transport towards the Fram
Strait. This contrasts with the idea of strong mixing of freshwaters from all Siberian rivers before advection to
Fram Strait6,37, but is in line with limited mixing observed between Lena and Yenisei/Ob waters in the Laptev
Sea26. The vertical and lateral separation of the river water from Lena and Yenisei/Ob can be explained by the
river water flow paths before entering the TPD: water from the Yenisei and Ob originates in the Kara Sea, enters
the open Arctic Ocean directly and/or flows through Vilkitsky Strait and then along/on the Laptev Shelf before
entrainment into the TPD. Lena river water, on the other hand, enters from the Laptev Sea and is then directly
incorporated into the TPD or deflected towards the east. Direct advection of Yenisei/Ob water through the
Kara and Barents Seas to the Nansen and Amundsen Basins has not been o bserved3. Nevertheless, scavenging
of river-borne REEs in the Siberian Shelf seas is slow, thus direct advection of Kara Sea freshwater to the TPD
would result in concentrations reaching up to 50 pmol/kg Nd. Also, discharge-weighted mean Kara Sea fresh-
water [Nd] is 200 pmol/kg higher than Lena river summer [Nd]26. Therefore, our data suggest that direct input
of Kara Sea water to the TPD must be rather limited given the lower [REE] (< 18 pmol/kg for Nd) determined in
the western Barents Sea31 compared to the [REE] observed within the Yenisei/Ob-dominated parcel of the TPD
(> 25 pmol/kg for Nd). Yenisei and Ob waters therefore have a longer transit time (some months) before entering
the TPD, increasing the potential of mixing with seawater resulting in a higher salinity and density than Laptev
Shelf waters containing Lena freshwater.
Due to the high [REE] of the river water compared to seawater, even after estuarine REE removal, the river
endmember Nd isotope signatures are maintained upon mixing with seawater, whereas the salinity and density
change is more apparent. This can, for example, be seen in the northwestern Laptev Sea where waters close to the
Vilkitsky Strait with a salinity of 25.8–32.4 have a very positive Nd isotope signal of εNd = − 6.3 to − 7.8, represent-
ing Yenisei/Ob influence, whereas samples at the edge of the northern Laptev Sea with salinities of 20.6–29.7
represent Lena freshwater influence with Nd isotope compositions ranging between εNd = − 12.4 and − 15.626.
The shoaling of the positive εNd signal towards station 69 is then due to the absence or reduced presence of Lena
river water at the surface, leading to an outcropping of the Yenisei/Ob water.
Dissolved εNd and [REE] provide clear insight into the lateral and vertical relative distribution of the different
river waters, spatially and temporally varying input and transport of river water constituents into and across the
central Arctic Ocean. The different river waters show a vertical and lateral separation with Lena water overrid-
ing Yenisei/Ob water throughout the transport route of the TPD. Due to their different densities acquired prior
to incorporation into the TPD, there is little to no mixing between the freshwater contributions. The lateral
separation is likely a result of temporally varying river discharge and changing wind patterns over the shelves
differently affecting the river plumes. This knowledge of the contribution and distribution of the different rivers
in the central Arctic Ocean may be especially valuable in the future, as e.g. potentially changing processes in the
shelf areas may lead to changes in halocline properties. River input is expected to change in composition and
volume61 due to the impact of climate warming especially on permafrost areas in the hinterland of the Siberian
rivers. Notably, discharge of the Lena river, currently draining exclusively permanent permafrost h interland14,
may be expected to increase in response to climate-induced thawing of permafrost areas. With the direct incor-
poration of Lena water into the TPD and, as our results show, its dominant role in sustaining the salinity and
density stratification in the central Arctic Ocean, this has important implications not only for the macro- and
micronutrient and freshwater budgets, but also for the water column structure of the central Arctic Ocean and
downstream in the North Atlantic. This in turn affects nutrient bioavailability and cycling, primary production
and planktonic food webs downstream the TPD.
Materials and methods
All seawater samples presented in this study were collected during R/V Polarstern cruise PS94 (ARKXXIX/3,
GEOTRACES transect GN04, August to October 2015). Sample processing and spectrometric analysis of dis-
solved [REE] and εNd in the laboratories of the Marine Isotope Geochemistry group at the ICBM of the Univer-
sity of Oldenburg followed established methods (see Supplementary Information). Intercalibration with other
Scientific Reports | (2021) 11:8216 | https://doi.org/10.1038/s41598-021-86948-y 8
Vol:.(1234567890)www.nature.com/scientificreports/
laboratories for quality control was achieved previously and through analysis of samples from a crossover station
with another GEOTRACES cruise and replicate samples from a nearby station of a previous R/V Polarstern cruise
(see Supplementary Information for full details). All [REE] and εNd data are respectively reported with 1SD and
2SD uncertainties calculated based on repeat analyses of a seawater standard and certified reference material,
respectively. All data are provided in the Supplementary Information.
Received: 10 January 2021; Accepted: 22 March 2021
References
1. Jones, E. P., Anderson, L. G., Jutterström, S. & Swift, J. H. Sources and distribution of fresh water in the East Greenland Current.
Prog. Oceanogr. 78, 37–44 (2008).
2. Wheeler, P. A., Watkins, J. M. & Hansing, R. L. Nutrients, organic carbon and organic nitrogen in the upper water column of the
Arctic Ocean: Implications for the sources of dissolved organic carbon. Deep. Res. Part II Top. Stud. Oceanogr. 44, 1571–1592
(1997).
3. Bauch, D. et al. Origin of freshwater and polynya water in the Arctic Ocean halocline in summer 2007. Prog. Oceanogr. 91, 482–495
(2011).
4. Middag, R., de Baar, H. J. W., Laan, P. & Klunder, M. B. Fluvial and hydrothermal input of manganese into the Arctic Ocean.
Geochim. Cosmochim. Acta 75, 2393–2408 (2011).
5. Klunder, M. B., Laan, P., Middag, R., De Baar, H. J. W. & Bakker, K. Dissolved iron in the Arctic Ocean: Important role of hydro-
thermal sources, shelf input and scavenging removal. J. Geophys. Res. Ocean 117, 1–17 (2012).
6. Laukert, G. et al. Ocean circulation and freshwater pathways in the Arctic Mediterranean based on a combined Nd isotope, REE
and oxygen isotope section across Fram Strait. Geochim. Cosmochim. Acta 202, 285–309 (2017).
7. Rijkenberg, M. J. A., Slagter, H. A., Rutgers van der Loeff, M., van Ooijen, J. & Gerringa, L. J. A. Dissolved Fe in the deep and upper
Arctic Ocean with a focus on Fe limitation in the Nansen Basin. Front. Mar. Sci. 5, 1–14 (2018).
8. Slagter, H. A. et al. Organic Fe speciation in the Eurasian Basins of the Arctic Ocean and its relation to terrestrial DOM. Mar.
Chem. 197, 11–25 (2017).
9. Kipp, L. E., Charette, M. A., Moore, W. S., Henderson, P. B. & Rigor, I. G. Increased fluxes of shelf-derived materials to the central
arctic ocean. Sci. Adv. 4, 1–10 (2018).
10. Rutgers van der Loeff, M. et al. Radium isotopes across the Arctic Ocean show time scales of water mass ventilation and increasing
shelf inputs. J. Geophys. Res. Ocean 123, 4853–4873 (2018).
11. Charette, M. A. et al. The Transpolar Drift as a source of riverine and shelf-derived trace elements to the Central Arctic Ocean. J.
Geophys. Res. Ocean 125, e2019JC015920 (2020).
12. Coachman, L. K. & Aagaard, K. Physical oceanography of Arctic and Subarctic Seas. In Marine Geology and Oceanography of the
Arctic Seas (ed. Herman, Y.) 1–72 (Springer, 1974). https://doi.org/10.1007/978-3-642-87411-6_1.
13. Holmes, R. M. et al. Seasonal and annual fluxes of nutrients and organic matter from large rivers to the Arctic Ocean and sur-
rounding seas. Estuaries Coasts 35, 369–382 (2012).
14. Wild, B. et al. Rivers across the Siberian Arctic unearth the patterns of carbon release from thawing permafrost. Proc. Natl. Acad.
Sci. USA 116, 10280–10285 (2019).
15. Macdonald, R. W., Harner, T. & Fyfe, J. Recent climate change in the Arctic and its impact on contaminant pathways and inter-
pretation of temporal trend data. Sci. Total Environ. 342, 5–86 (2005).
16. Community, S. Arctic Sea Ice in CMIP6. Geophys. Res. Lett. https://doi.org/10.1029/2019GL086749 (2020).
17. Krumpen, T. et al. Arctic warming interrupts the Transpolar Drift and affects long-range transport of sea ice and ice-rafted matter.
Sci. Rep. 9, 1–9 (2019).
18. Polyakov, I. V. et al. Intensification of near-surface currents and shear in the eastern Arctic Ocean. Geophys. Res. Lett. 47, 1–9
(2020).
19. Jones, E. P., Anderson, L. G., Swift, J. H., Diego, S. & Jolla, L. Distribution of Atlantic and Pacific waters in the upper Arctic. Geophys.
Res. Lett. 25, 765–768 (1998).
20. Ekwurzel, B., Schlosser, P., Mortlock, R. A. & Fairbanks, R. G. River runoff, sea ice meltwater, and Pacific water distribution and
mean residence times in the Arctic Ocean. J. Geophys. Res. 106, 9075–9092 (2001).
21. Yamamoto-Kawai, M., McLaughlin, F. A., Carmack, E. C., Nishino, S. & Shimada, K. Freshwater budget of the Canada Basin, Arctic
Ocean, from salinity, δ18O, and nutrients. J. Geophys. Res. Ocean 113, 1–12 (2008).
22. Alkire, M. B., Morison, J. & Andersen, R. Variability in the meteoric water, sea-ice melt, and Pacific water contributions to the
central Arctic Ocean, 2000–2014. J. Geophys. Res. Ocean 120, 1573–1598 (2015).
23. Alkire, M. B., Rember, R. & Polyakov, I. Discrepancy in the identification of the Atlantic/Pacific front in the central Arctic Ocean:
NO versus nutrient relationships. Geophys. Res. Lett. 46, 3843–3852 (2019).
24. Porcelli, D. et al. The distribution of neodymium isotopes in Arctic Ocean basins. Geochim. Cosmochim. Acta 73, 2645–2659 (2009).
25. . Charette, M. A. et al. Coastal ocean and shelf-sea biogeochemical cycling of trace elements and isotopes: lessons learned from
GEOTRACES (2016).
26. Laukert, G. et al. Transport and transformation of riverine neodymium isotope and rare earth element signatures in high latitude
estuaries: A case study from the Laptev Sea. Earth Planet. Sci. Lett. 477, 205–217 (2017).
27. Zimmermann, B. et al. Hafnium isotopes in Arctic Ocean water. Geochim. Cosmochim. Acta 73, 3218–3233 (2009).
28. Andersson, P. S. et al. Neodymium isotopes in seawater from the Barents Sea and Fram Strait Arctic-Atlantic gateways. Geochim.
Cosmochim. Acta 72, 2854–2867 (2008).
29. Westerlund, S. & Öhman, P. Rare earth elements in the Arctic Ocean . Deep Sea Res. Part A Oceanogr. Res. Pap. 39, 1613–1626
(1992).
30. Dahlqvist, R., Andersson, P. S. & Ingri, J. The concentration and isotopic composition of diffusible Nd in fresh and marine waters.
Earth Planet. Sci. Lett. 233, 9–16 (2005).
31. Laukert, G. et al. Water mass transformation in the Barents Sea inferred from radiogenic neodymium isotopes, rare earth elements
and stable oxygen isotopes. Chem. Geol. 511, 416–430 (2019).
32. Yang, J. & Haley, B. A. The profile of the rare earth elements in the Canada Basin Arctic Ocean. Geochem. Geophys. Geosyst. 17,
3241–3253 (2016).
33. Rabe, B. et al. Physical oceanography during POLARSTERN cruise PS94 (ARK-XXIX/3) (2016). https://doi.org/10.1594/PANGA
EA.859558
34. Byrne, R. H. & Kim, K. H. Rare earth element scavenging in seawater. Geochim. Cosmochim. Acta 54, 2645–2656 (1990).
35. Pokrovsky, O. S. et al. Fate of colloids during estuarine mixing in the Arctic. Ocean Sci. 10, 107–125 (2014).
Scientific Reports | (2021) 11:8216 | https://doi.org/10.1038/s41598-021-86948-y 9
Vol.:(0123456789)www.nature.com/scientificreports/
36. Dittmar, T. & Kattner, G. The biogeochemistry of the river and shelf ecosystem of the Arctic Ocean: A review. Mar. Chem. 83,
103–120 (2003).
37. Laukert, G. et al. Pathways of Siberian freshwater and sea ice in the Arctic Ocean traced with radiogenic neodymium isotopes and
rare earth elements. Polarforschung 87, 3–13 (2017).
38. Persson, P. O., Andersson, P. S., Zhang, J. & Porcelli, D. Determination of Nd isotopes in water: A chemical separation technique
for extracting Nd from seawater using a chelating resin. Anal. Chem. 83, 1336–1341 (2011).
39. Gordeev, V. V. Fluvial sediment flux to the Arctic Ocean. Geomorphology 80, 94–104 (2006).
40. Tepe, N. & Bau, M. Behavior of rare earth elements and yttrium during simulation of arctic estuarine mixing between glacial-fed
river waters and seawater and the impact of inorganic (nano-)particles. Chem. Geol. 438, 134–145 (2016).
41. Mulligan, R. P. & Perrie, W. Circulation and structure of the Mackenzie River plume in the coastal Arctic Ocean. Cont. Shelf Res.
177, 59–68 (2019).
42. Macdonald, R. W., Carmack, E. C., McLaughlin, F. A., Falkner, K. K. & Swift, J. H. Connections among ice, runoff and atmospheric
forcing in the Beaufort Gyre. Geophys. Res. Lett. 26, 2223–2226 (1999).
43. Elderfield, H. The oceanic chemistry of rare-earth elements. Philos. Trans. R. Soc. London. Ser. A Math. Phys. Eng. Sci. 325, 105–126
(1988).
44. Elderfield, H. & Greaves, M. J. The rare earth elements in seawater. Nature 296, 214–219 (1982).
45. Behrens, M. K., Pahnke, K., Paffrath, R., Schnetger, B. & Brumsack, H. J. Rare earth element distributions in the West Pacific: Trace
element sources and conservative vs. non-conservative behavior. Earth Planet. Sci. Lett. 486, 166–177 (2018).
46. Liguori, B. T. P., Ehlert, C. & Pahnke, K. The influence of water mass mixing and particle dissolution on the Silicon cycle in the
central Arctic Ocean. Front. Mar. Sci. 7, 1–16 (2020).
47. Cai, P. et al. Low export flux of particulate organic carbon in the central Arctic Ocean as revealed by 234Th:238U disequilibrium.
J. Geophys. Res. Ocean. 115, 1–21 (2010).
48. Strady, E., Kim, I., Radakovitch, O. & Kim, G. Rare earth element distributions and fractionation in plankton from the northwestern
Mediterranean Sea. Chemosphere 119, 72–82 (2015).
49. Schmitt, W. Application of the Sm-Nd Isotope System to the Late Quaternary Paleoceanography of the Yermak Plateau (Arctic
Ocean). Ludwig-Maximilians-University Munich, Fac. Geosci. PhD (2007).
50. Janout, M. A. et al. Kara Sea freshwater transport through Vilkitsky Strait: Variability, forcing, and further pathways toward the
western Arctic Ocean from a model and observations. J. Geophys. Res. Ocean 120, 4654–4669 (2015).
51. Williford, T. et al. Insights into the origins, molecular characteristics and distribution of iron-binding ligands in the Arctic Ocean.
Mar. Chem. 231, 103936 (2021).
52. Janout, M. A. et al. On the variability of stratification in the freshwater-influenced Laptev Sea Region. Front. Mar. Sci. 7, 1–17
(2020).
53. Bauch, D. & Cherniavskaia, E. Water mass classification on a highly variable Arctic shelf region: Origin of Laptev Sea water masses
and implications for the nutrient budget. J. Geophys. Res. Ocean 123, 1896–1906 (2018).
54. Thibodeau, B., Bauch, D., Kassens, H. & Timokhov, L. A. Interannual variations in river water content and distribution over the
Laptev Sea between 2007 and 2011: The Arctic Dipole connection. Geophys. Res. Lett. 41, 7237–7244 (2014).
55. Steele, M. Circulation of summer Pacific halocline water in the Arctic Ocean. J. Geophys. Res. 109, C02027 (2004).
56. Jones, E. P., Anderson, L. G., Jutterström, S., Mintrop, L. & Swift, J. H. Pacific freshwater, river water and sea ice meltwater across
Arctic Ocean basins: Results from the 2005 Beringia Expedition. J. Geophys. Res. Ocean. 113, 1–10 (2008).
57. Anderson, L. G. et al. Source and formation of the upper halocline of the Arctic Ocean. J. Geophys. Res. Ocean 118, 410–421 (2013).
58. Aksenov, Y. et al. Arctic pathways of Pacific Water: Arctic Ocean Model Intercomparison experiments. J. Geophys. Res. 121, 27–59
(2016).
59. Carmack, E. C. et al. Freshwater and its role in the Arctic Marine System: Sources, disposition, storage, export, and physical and
biogeochemical consequences in the Arctic and global oceans. J. Geophys. Res. G Biogeosci. 121, 675–717 (2016).
60. Whitmore, L. M., Pasqualini, A., Newton, R. & Shiller, A. M. Gallium: A new tracer of Pacific Water in the Arctic Ocean. J. Geophys.
Res. Ocean 125, 1–17 (2020).
61. Jahn, A. & Laiho, R. Forced changes in the Arctic freshwater budget emerge in the early 21st century. Geophys. Res. Lett. 47, 1–10
(2020).
62. . R-Arctic NET. Available at: http://www.r-arcticnet.sr.unh.edu/ (accessed 28 September 2020).
63. Rudels, B. Arctic Ocean Circulation. In Encyclopedia of Ocean Sciences (ed. Steele, J. H.) 211–225 (Elsevier Ltd., 2009). https://doi.
org/10.1016/B978-012374473-9.00601-9.
64. . Schlitzer, R. Ocean Data View (2020).
Acknowledgements
We thank captain S. Schwarze, the chief scientist U. Schauer and the crew of R/V Polarstern cruise PS94
(ARKXXIX/3). We further thank O. Valk and S. Gdaniec for help onboard. Furthermore, we acknowledge P.
Böning and M. Schulz for laboratory assistance. This project was financially supported through the Institute for
Chemistry and Biology of the Marine Environment (ICBM) and the Max Planck Institute for Marine Microbiol-
ogy, Bremen. G. Laukert acknowledges financial support through the BMBF (grant 03F0831) and the Ministry of
Education and Science of the Russian Federation. D. Bauch was funded by DFG (BA1689/2-2). Five anonymous
reviewers are acknowledged for their constructive comments that significantly improved the manuscript.
Author contributions
R.P. collected samples, analyzed Nd isotopes and rare earth element concentrations, carried out the data analysis
and calculations and wrote the manuscript. D.B. collected samples for oxygen isotope analysis and contributed
to the discussions. K.P. designed the project, supervised the work and contributed to the discussions. G.L. and
M.R.v.d.L. contributed to the discussions.
Funding
Open Access funding enabled and organized by Projekt DEAL.
Competing interests
The authors declare no competing interests.
Scientific Reports | (2021) 11:8216 | https://doi.org/10.1038/s41598-021-86948-y 10
Vol:.(1234567890)www.nature.com/scientificreports/
Additional information
Supplementary Information The online version contains supplementary material available at https://doi.org/
10.1038/s41598-021-86948-y.
Correspondence and requests for materials should be addressed to R.P.
Reprints and permissions information is available at www.nature.com/reprints.
Publisher’s note Springer Nature remains neutral with regard to jurisdictional claims in published maps and
institutional affiliations.
Open Access This article is licensed under a Creative Commons Attribution 4.0 International
License, which permits use, sharing, adaptation, distribution and reproduction in any medium or
format, as long as you give appropriate credit to the original author(s) and the source, provide a link to the
Creative Commons licence, and indicate if changes were made. The images or other third party material in this
article are included in the article’s Creative Commons licence, unless indicated otherwise in a credit line to the
material. If material is not included in the article’s Creative Commons licence and your intended use is not
permitted by statutory regulation or exceeds the permitted use, you will need to obtain permission directly from
the copyright holder. To view a copy of this licence, visit http://creativecommons.org/licenses/by/4.0/.
© The Author(s) 2021
Scientific Reports | (2021) 11:8216 | https://doi.org/10.1038/s41598-021-86948-y 11
Vol.:(0123456789)You can also read