PURE INDUSTRIAL REAL ESTATE TRUST INVESTOR PRESENTATION - DECEMBER 12, 2017 - 100 Sandalwood Pkwy, GTA, Ontario Acquired August 17, 2017 - Pure ...
←
→
Page content transcription
If your browser does not render page correctly, please read the page content below
PURE INDUSTRIAL REAL ESTATE TRUST
INVESTOR PRESENTATION
DECEMBER 12, 2017

 100 Sandalwood Pkwy, GTA, Ontario
 Acquired August 17, 2017
NOTICE TO THE READER
ABOUT THIS PRESENTATION
This presentation has been prepared for informational purposes only. This presentation is personal to each recipient and does not constitute an offer to any person or to the public generally to subscribe for
or otherwise acquire any of the securities of PIRET.

FORWARD-LOOKING INFORMATION
Certain information included in this presentation contains forward-looking statements within the meaning of applicable securities laws including, among others, statements concerning PIRET’s business
operations, proposed acquisitions, projected costs, financial performance and condition, objectives and strategies to achieve those objectives, as well as statements with respect to management's beliefs,
plans, estimates, and intentions, and similar statements concerning anticipated future events, results, circumstances, performance or expectations that are not historical facts. These statements generally
can be identified by the use of forward-looking words such as “may”, “will”, “expect”, “intend”, “plan”, “estimate”, “anticipate”, “believe”, or “continue”, or the negative thereof, or similar variations.
Certain material factors, estimates or assumptions were applied in drawing a conclusion or making a forecast or projection as reflected in these statements and actual results could differ materially from
such conclusions, forecasts or projections.

Additional information on the material risks that could cause PIRET’s actual results to differ materially from the conclusions, forecast or projections in these statements and the material factors, estimates or
assumptions that were applied in drawing a conclusion or making a forecast or projection as reflected in the forward-looking information can be found in our most recent annual information form that is
available on PIRET’s website and at www.sedar.com.

The forward-looking statements contained herein are expressly qualified in their entirety by this cautionary statement. These forward-looking statements are made as of the date of this presentation and
PIRET does not undertake any obligation to publicly update such forward-looking statements to reflect new information, subsequent events or otherwise, except as expressly required by applicable
securities laws.

NON-IFRS MEASURES
PIRET’s consolidated financial statements are prepared in accordance with IFRS. Consistent with PIRET’s management framework, management uses certain financial measures to assess PIRET’s financial
performance, which are not IFRS measures.

There are a number of non-IFRS measures used in this presentation, including funds from operations (FFO), adjusted funds from operations (AFFO), adjusted net operating income (Adjusted NOI), AFFO
payout ratio (POR), Debt to EBITDA, Debt to Gross Book Value, earnings before interest, taxes, depreciation and amortization (EBITDA), enterprise value, going-in cap rate, gross book value (GBV), interest
coverage, net asset value (NAV) per unit, occupancy levels, weighted average effective interest rate and weighted average lease term (WALT) . PIRET believes that these non-IFRS measures are appropriate
measures of the operating performance of PIRET. These and other non-IFRS measures do not have any standardized meaning prescribed by IFRS. PIRET’s calculation of these measures may differ from the
methodology used by other issuers and, accordingly, may not be comparable to such other issuers. Refer to PIRET’s management discussion and analysis (MD&A) for further descriptions of the non-IFRS
measures, available on SEDAR at www.sedar.com.

Management believes that certain of these measures are appropriate measures of PIRET’s operating performance because they facilitate an understanding of PIRET’s operating performance without giving
effect to certain non-cash expenses. None of these measures are equivalent to net income or cash generated from operating activities determined in accordance with IFRS.

FFO and AFFO
Commencing January 1, 2017, management has chosen to fully adopt the definitions of FFO and AFFO as prescribed by REALpac in its whitepaper on FFO and AFFO for IFRS, dated February 2017. As a result,
FFO and AFFO for fiscal year 2016 has been restated to conform to the current year’s presentation.

                                                                                                                                                                                                                     1
WHO WE ARE

             16108 Blundell Road, Richmond, BC
             Acquired September 7, 2017

                                             2
WHO WE ARE

                                      Our mission:

                                  To be an industry-
                                 leading provider of
                                 modern distribution
                                and logistics facilities

PIRET is an internally managed, unincorporated, open-ended REIT that focuses exclusively on investing
in industrial properties in leading markets with the goal of generating stable and growing cash
distributions for investors.

                                                                                                        3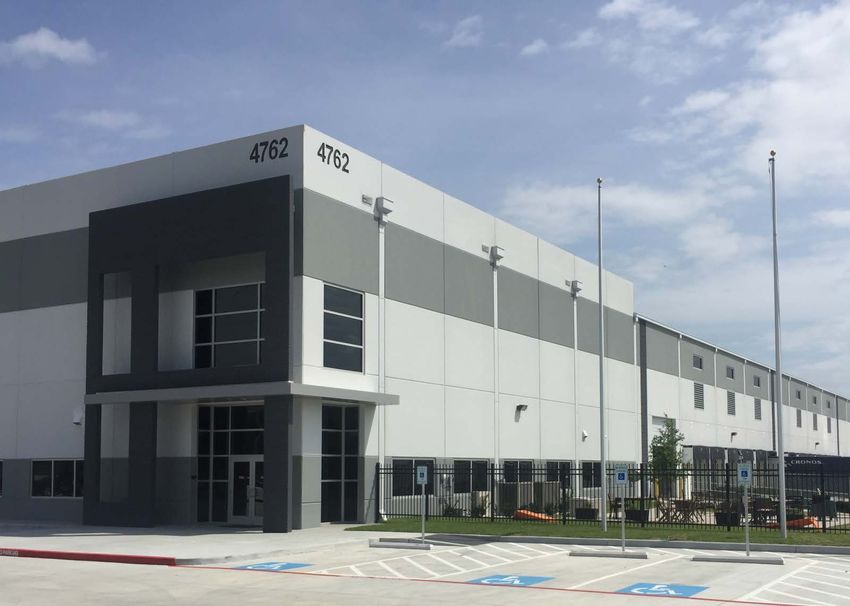
WHY CHOOSE AN
  INDUSTRIAL
  REIT?

4762,4830 Borusan Road, Houston, Texas
Acquired April 4, 2017

                                         4
WHY CHOOSE AN INDUSTRIAL REIT?

CASHFLOW
-   Historically stable, predictable
-   Driven by positive real estate
    fundamentals

YIELD
-   Historically attractive yields
-   10 year IPD property index total return
    8.4%

GROWTH
-   Fragmented market ripe for
    consolidation
-   E-commerce is positively driving
    demand for logistics space

                                              5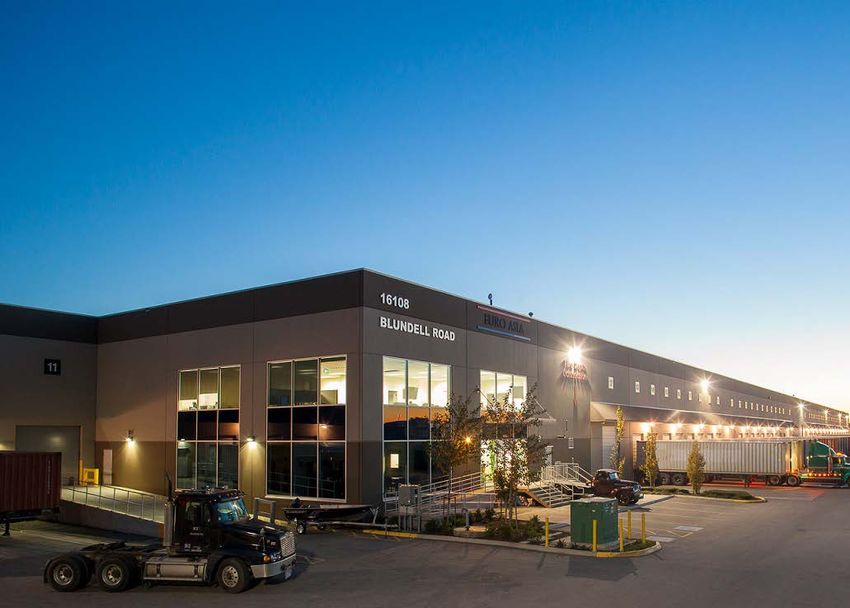
POSITIVE PROPERTY FUNDAMENTALS
INDUSTRIAL SUPPLY AND DEMAND
12.0%
80
10.0%
60
Millions
8.0%
40
6.0%
20
4.0%
0 2.0%
Q1 Q2 Q3 Q4 Q1 Q2 Q3 Q4 Q1 Q2 Q3 Q4 Q1 Q2
-20 0.0%
2014 2015 2016 2017
Availability Rate - Canada Availability Rate - USA
New Supply - Canada New Supply – USA
Source: CBRE Limited Q2 2017 Net Absorption - Canada Net Absorption - USA
Across Canada and USA, strong property fundamentals:
Demand continues to exceed supply (positive net absorption)
Low supply of industrial space, especially in Canada
Availability rate in both Canada and USA are at historical lows
E-commerce a significant demand driver
Property fundamentals drive stable and predictable cashflows and attractive yields in industrial REITs
6
POSITIVE PROPERTY FUNDAMENTALS
CANADA CAP RATES USA CAP RATES
10-year Canada Treasury Yield (%) Average Canadian Industrial Class A Cap Rate 10-year USA Treasury Yield (%) Average USA Industrial Class A (Tier I) Cap Rate
9.0% 9.0%
8.0% 8.0%
7.0% 7.0%
6.0% 5.56%
187 6.0%
bps
5.0% 5.0%
192 bp
4.0% spread 379
4.0%
3.0% differential bps 3.0%
2.0% 2.0%
1.0% 1.0%
0.0% 0.0%
Q4/06
Q2/07
Q4/07
Q2/08
Q4/08
Q2/09
Q4/09
Q2/10
Q4/10
Q2/11
Q4/11
Q2/12
Q4/12
Q2/13
Q4/13
Q2/14
Q4/14
Q2/15
Q4/15
Q2/16
Q4/16
Q2/17
Sources: CBRE Limited Q2 2017, FactSet Source: JLL Q1 2017
Across Canada and USA:
Steady cap rate compression
Spread over government bond has widened since the last market peak in both Canada and USA
7
NORTH AMERICAN INDUSTRIAL CLASS A CAP RATES
                                                          0.0%   1.0%   2.0%   3.0%   4.0%   5.0%   6.0%   7.0%   8.0%
                                                     Seatle
           N. Cal. (Oakland, San Fran, LA, Inland Empire
                                      NY: N. New Jersey
                                               Vancouver
                                                  Toronto
                                         N. Ca: San Jose                                                                    PIRET Target Markets
TIER I

                                             S. FL Miama
                                     Tier I USA Average                                                                     Tier market average
                                        Washington D.C
                                                   Chicago
                                        Dallas/Ft. Worth
                                                   Atlanta
                                              PA Corridor
                                                  Houston
                                            NY: Stamford
                                                  Portland
                                                Baltimore
                                             Philadelphia
                                                   Denver
TIER II

                                                   Calgary
                                          Tier II Average
                                                    Boston
                                             Indianapolis
                                               Edmonton
                                               Mineapolis
                                                  Pheonix
                                                 Montreal
                                                Columbus
                                                  Orlando
                                                San Diego
                                                     Austin
                                                Las Vegas
                                                 Charlotte
                                                Cincinnati
                                                 Nashville
                                             Sacramento
                                            Salt Lake City
                                             San Antonio
                                                  St. Louis
                                                Kansas Cit
                                                 Lousiville
TIER III

                                                    Tampa
                                         Tier III Average
                                              Jacksonville
                                                 Memphis
                                        Raleigh-Durham
                                                    Detroit
                                                Cleveland
                                                    El Paso
                                          Oklahoma City
                                            Albuquerque                                                                  Sources: CBRE Limited Q2 2017
                                               Pittsburgh

                                                                                                                                                         8
STRONGEST PROPERTY FUNDAMENTALS IN TARGET MARKETS

INDUSTRIAL SUPPLY AND DEMAND
2016 Net Absorption By Market                                                                                               2016 Construction Completions By Market
Million Sq.ft                                                                                                               Million Sq.ft

     10                                                                                                                 8                                                                                                                   2016       2015    5 year average

                                                                                                                        7
       8                                                                                                                                                                                                                                      PIRET Target Markets:
                                                                                                                                                                                                                                              Vancouver, Toronto,
                                                                                                                        6                                                                                                                     Calgary, Edmonton

       6
                                                                                                                        5
                                                                                                                                                                                                                                        Source: CBRE Limited
       4                                                                                                                4

                                                                                                                        3
       2

                                                                                                                        2
       0
                                                                                                                        1

      -2                                                                                                                0
                                                                                                                                            Calgary

                                                                                                                                                                 Winnipeg

                                                                                                                                                                                                                   Montreal

                                                                                                                                                                                                                              Halifax
                                                                                                                                                                                     Waterloo
                                                                                                                                                                                                Toronto

                                                                                                                                                                                                          Ottawa
                                                                                                                                                      Edmonton

                                                                                                                                                                            London
                                                                                                                              Vancouver
                            Calgary

                                                 Winnipeg
                Vancouver

                                                                                                   Montreal

                                                                                                              Halifax
                                                                     Waterloo
                                      Edmonton

                                                            London

                                                                                Toronto

                                                                                          Ottawa

      Fundamentals are strongest in our target markets

      Majority of Canadian supply and demand is in key markets of Toronto, Vancouver, Calgary and Edmonton

                                                                                                                                                                                                                                                                                9
E-COMMERCE HAS A LARGE IMPACT ON LOGISTICS REAL ESTATE
U.S E-COMMERCE RETAIL SALES IMPLIED DEMAND FOR LOGISTICS SPACE
120 9.0% 80 450
100 350
60
$ Billions
Millions SF
$ Billions
80 8.0%
250
60 40
150
40 7.0%
20 50
20
0 6.0% 0 -50
Q1-15 Q2-15 Q3-15 Q4-15 Q1-16 Q2-16 Q3-16 Q4-16 2011 2012 2013 2014 2015 2016E
U.S. E-commerce Sales Percent of Total Retail Sales E-commerce related Net Absorption E-commerce Sales ($Billions)
Sources: CBRE Research Q4 2016, US Census Bureau Sources CBRE Research Q4 2016, U.S Census Bureau
E-commerce in US is > $400 billion industry*
E-commerce growth outpacing retail sales growth
CBRE estimates that every $1.0 billion of e-commerce sales creates 1.25 million sf of logistics demand
E-commerce is a significant driver of demand for logistics warehouse space:
- Regional Distribution Centres
- Urban Distribution Centres
- Fulfillment and parcel delivery
- Reverse logistics
• E-commerce represents approximately 30% of PIRET’s portfolio
* Source: U.S. Census Bureau News February 17 2017
10WHY PIRET
11WHY CHOOSE PIRET?
QUALITY CONSERVATIVE EFFECTIVE
Conservative capital structure
INDUSTRIAL PORTFOLIO CAPITAL STRUCTURE OPERATING PLATFORM
POSITIONED FOR NAV & INCOME GROWTH
1295% OF PORTFOLIO CONCENTRATED IN MAJOR MARKETS1
Edmonton
$3.0 BILLION PORTFOLIO
2.2 million S.F.
Vancouver 25
174 PROPERTIES
2.8 million S.F.
12 16 Regina (4) 24.6 MILLION S.F. AUM
Calgary 0.2 million S.F. Greater Toronto Area
1.6 million S.F.
Winnipeg (8)
9.3 million S.F.
Montreal (6)
131.6 ACRES OF DEVELOPMENT LAND
80
0.7 million S.F. 0.6 million S.F.
Chicago, GEOGRAPHIC DIVERSITY (by Adj. NOI)
Davenport (2) Barrington & Dover
0.3 million S.F. New Jersey (2) BC 13%
0.4 million S.F.
Los Angeles (1) ALBERTA 19%
6
0.2 million S.F.
Houston, Dallas, Atlanta Area Charlotte, Greensboro ONTARIO 38%
Austin, San Antonio
1.7 million S.F. 5 & Winston-Salem
2.2 million S.F. 2.1 million S.F. USA 24%
5 Baton Rouge (1) OTHER 6%
0.2 million S.F. West Palm Beach (1)
0.1 million S.F.
* Circles are scaled by square feet owned in each region
1. Pro-forma information includes the following: events as disclosed in the Trust’s 2017 Q3 Financial Statements and Management Discussion and Analysis dated on November 8, 2017, the Richmond Development as
disclosed in the press release dated July 12 2017 and excludes assets held for sale.
13USA TARGET MARKETS
METROPOLITAN AREAS FASTEST GROWING CITIES IN THE U.S
Population > 1 million & strong job growth Census population growth 2000-2012
1. Raleigh, North Carolina 47.8%
2. Austin, Texas 44.9%
3. Las Vegas, Nevada 43.6%
4. Orlando, Florida 34.2%
5. Charlotte, North Carolina 32.8%
6. Riverside, California 32.7%
7. Phoenix, Arizona 32.1%
8. Houston, Texas 31.0%
9. San Antonio, Texas 29.9%
10. Dallas-Fort Worth, Texas 27.9%
Source: Forbes
CHARACTERISTICS
of USA Target Markets
- Population and job growth
- Well located distribution markets / connectivity
- Transportation infrastructure
Source: New York Times “Dear Amazon, We Picked Your New Headquarters for You“ September 9, 2017 - Labour conditions
- Panama canal widening / increasing port activity
in gulf and east coast
14STRATEGIC PORTFOLIO1
PROPERTY USE PROPERTY TYPE PROPERTY LOCATION
By NOI By NOI By Investment Property Value
Wtd Avg
Cap Rate
BC 13% 5.39%
Distribution / Single 75%
70%
E-Commerce tenant AB 17% 6.49%
Light Multi 25% ON 42% 5.16%
18%
Manufacturing tenant
USA 22% 6.33%
Flex 5%
Other 5% 6.80%
Transportation 7% Total/
/ Logistics 100% 5.76%
Avg
Distribution / Logistics Focus Single-tenant Advantage Concentrated in Major Markets
Highly liquid Enhances liquidity Over 95% of portfolio is concentrated
in major markets
Easier to re-lease than manufacturing Typically larger, more credit-
facilities worthy tenants Overall weighted average
capitalization rate: 5.76%
Superior growth prospects Operating efficiencies
Increasing focus on Platform scalability
e-commerce
1. Pro-forma information includes the following: events as disclosed in the Trust’s 2017 Q3 Financial Statements and Management Discussion and Analysis dated on November 8, 2017, the Richmond Development as
disclosed in the press release dated July 12 2017 and excludes assets held for sale.
15DIVERSIFIED BLUE CHIP TENANTS
TENANT INDUSTRY SECTOR TOP 10 TENANTS
By Revenue1 By Revenue1 Weighted Average
Lease Term Remaining
Transportation / Logistics 46.2% FedEx 20.6% 8.5 years
TFI International 8.8% 10.9 years
Manufacturer 19.4%
IKEA 4.7% 5.4 years
Wholesale Trade 11.9%
Containerworld 3.0% 6.8 years
Retail Trade 11.6% Kellogg’s 2.7% 5.3 years
Services 6.0% Best Buy 2.0% 0.4 years
Toys ‘R’ Us 1.8% 15.3 years
Mining, Oil and Gas 2.7%
Tervita 1.6% 15.0 years
Others 2.2%
K+N 1.5% 4.5 years
HBC 1.5% 5.3 years
Well diversified across industry sectors Top 10 tenants have long lease terms
Weighted towards growing sectors of logistics and e-commerce WALT of top 10 tenants is 8.3 years vs portfolio average of 6.4 years
Exposure to mining, oil and gas < 5%
1. Pro-forma information includes the following: events as disclosed in the Trust’s 2017 Q3 Financial Statements and Management Discussion and Analysis dated on November 8, 2017, the Richmond Development as
disclosed in the press release dated July 12 2017 and excludes assets held for sale.
16HEALTHY LEASE MATURITY PROFILE1
LEASE EXPIRY PROFILE
WEIGHTED AVERAGE LEASE TERM = 6.4 YEARS
OCCUPANCY PERCENTAGE = 97.1% 34% LEASES UP FOR RENEWAL POST 2023
18.7%
14.0%
12.2%
9.6% 10.4%
9.2% 8.6%
3.9% 4.4% 3.5%
2.6%
2017 2018 2019 2020 2021 2022 2023 2024 2025 2026 Thereafter
BC AB ON USA Other
Low re-leasing risk Contractual rent increases Well-staggered lease maturities
33% of leases expire after 2023 Provides organic NOI growth Provides a balance of stability and
rental growth
17CONSERVATIVE CAPITAL STRUCTURE
SELECT FINANCIAL INFORMATION
Unit price (December 12, 2017) $ 6.57
Units outstanding, float 305,880,218
Average daily volume (last 30 trading days) 1,222,679
(C$ Millions)
Market capitalization1 2 $ 2,060
Cash and available lines (current estimate) $ 230
Debt2 3 $ 1,159
Unencumbered pool of assets2 3 $785
Enterprise value1 2 $ 3,159
Gross book value2 $ 3,093
Debt to gross book value2 37.5%
Debt to EBITDA2 7.9
Interest Coverage2 3.84
Annual distribution per unit $ 0.312
Yield2 4.6%
Analyst Consensus Information:
Consensus Target Price4 $7.18
Consensus NAV per unit4 $6.40
Consensus AFFO payout ratio (no DRIP in place)4 2017E 81.9%
1. Market information as at December 12, 2017
2. PIRET’s financial results as at Sept 30, 2017 and as reported on 2017 Q3 Financial Statements dated November 8, 2017
.
3. Includes assets/liabilities held for sale
4. Based on consensus analyst estimates as of December 12, 2017 and does not represent PIRET and its management’s opinions, forecasts or predictions. The inclusion of this information in our presentation does not imply any
endorsement of, or concurrence with the analysts estimates
18MANAGEABLE MORTGAGE MATURITY
MORTGAGE MATURITY PROFILE1
WEIGHTED AVERAGE TERM = 4.9 YEARS
WA Effective Rate1 3.84%
10yr Loan Term Rate2 3.74- 4.44%
5yr Loan Term Rate2 3.31 - 3.81%
30.0% 6.00%
25.0% 5.00%
4.21% 4.47%
3.79%
4.08% 3.68%
3.88% 3.45% 3.55% 3.48% 4.10%
20.0% 3.72% 3.84% 3.74% 4.37% 4.00%
3.62% 3.40%
3.43% 3.40%
3.98%
3.87% 16.4% 17.1%
3.71%
3.53%
15.0% 3.00%
12.5%
11.0% 11.3%
9.0%
10.0% 2.00%
7.8%
6.5%
3.7%
5.0% 1.00%
3.5%
1.1%
0.0% 0.00%
2017 2018 2019 2020 2021 2022 2023 2024 2025 2026 Thereafter
Maturity Scheduled Principal Series 3 Effective Rate Nominal Rate
1. Pro-forma information includes the following: subsequent events as disclosed in the Trust’s 2017 Q3 Financial Statements and Management Discussion and Analysis dated on November 8, 2017 and excludes assets held for sale
2. Source: Avison Young Debt Market Monitor (September 2017) 19EFFICIENT AND EFFECTIVE OPERATING STRUCTURE Dedicated, internal investment, property and asset management teams Hands-on, proactive property and asset management across 5 offices No fees paid to external management G&A costs represent 2.8% of revenue1 Scalable platform going forward Positioned to achieve economies of scale with portfolio growth Completed over 3 million sf of renewals and new leases in 2016 1. G&A as at September 30, 2017 excluding the non-cash fair value component of remeasuring the Trust’s unit-based compensation liabilities 20
DEDICATED INTERNAL MANAGEMENT TEAM
Formerly led the Industrial business for Oxford Properties
Kevan Gorrie President & Chief
Over 18 years of real estate experience
P. Eng Executive Officer, Trustee
Over $2.5 billion in transactions completed to date
Senior financial executive with over 25 years of experience in
Teresa Neto Chief Financial Officer
corporate finance & accounting
CPA, CA Former CFO at a number of established REITs in Canada and
Real Property Association of Canada (REALpac)
Over 13 years of real estate and finance experience
Kantaro Goto Vice President Finance
Former Director, Finance at Build Toronto and controller at a
CPA, CMA and Corporate Controller
public REIT
Over 20 years of real estate experience in leasing, property
Vice President, Property
Allan Saito Management and Leasing
management and development
Former VP at Build Toronto and GE Capital Real Estate
Over 10 years of real estate experience including appraisal,
Vice President,
Charlie Deeks Investments
asset management and investment
Over $1.0 billion of transaction volume completed to date
21VALUE-ADD TRACK RECORD
Internal asset management team with development capabilities
GTA Future Redevelopment
Focused on select developments and expansions in PIRET’s Located in Scarborough, ON
established markets Project Size: Approx. 300,000 S.F.
Construction Start: Q1-2018 (forecast)
Currently 1 property under development and 131.6 acres of
developable land
Hino Expansion
Located in Woodstock, ON
Project Size: Approx. 44,000 S.F.
Alberta Completed: Q4-2016
13.9 Acres Manitoba
Land Held for Development
2.2 Acres
Land Held for Development
FedEx Ground Development
Ontario
14.8 Acres Located in Vaughan, ON
New development
Land Held for Development
East Richmond Development
Project Size: Approx. 422,000 S.F.
Located in Richmond, BC NOI Yield: 6.8%
Adjacent to existing portfolio Completed: Q2-2016
Project Size: 330,540 S.F. Dallas FedEx USA Expansion
Project Cost: Est $40 million
Completion: Q4-2017
84.0 Acres
Land Held for Development Located in Barrington, NJ
Container World Expansion
Project Size: 56,000 S.F
Located in Richmond, BC NOI Yield: 9.9%
Completed: Q2-2016
Project Size: Approx. 152,000 S.F.
NOI Yield: 7.9% San Antonio FedEx USA Parking Facility Expansion
Completed: Q3-2014 16.0 Acres
Land Held for Development Located in San Antonio, TX
Completed: Q4-2017
22SCALABLE PLATFORM WITH JOINT VENTURE EXPERTISE
Relationships with 2 institutional joint venture
partners
PIRET maintains 100% management interest of
the properties
Enables the Trust to maintain operational scale
while decreasing economic exposure
Speaks to the quality of internal management
team
Enhances returns through generation of fee
3 properties in Alberta, 1 property in Manitoba (October 2015)
income
8 properties in Ontario, 1 property in Quebec (October 2014)
Source of low-cost partner capital for further 4 properties in Alberta, 1 property in Ontario (March 2017)
growth
23POSITIONED FOR GROWTH 201 Greenwood Court, McDonough, Georgia, US Acquired February 1, 2017
GROWTH STRATEGY
FOCUSED ON
NAV AND INCOME GROWTH
Continue to upgrade the quality of the portfolio
Re-invest into strategic acquisitions in primary markets
Build scale in target markets
Maintain a distribution / logistics / e-commerce focus
Active, hands-on asset management
Selective value-add development activity
Joint venture partnerships to support growth
Prudent financial management and capital allocation
25TOTAL RETURN
YTD 2016 2 years 3 years Since IPO
PIRET 26.9% 36.0% 71.4% 83.6% 279.0%
S&P / TSX REIT Index 8.5% 17.6% 23.3% 20.9% 98.9%
S&P / TSX Composite Index 8.0% 21.1% 26.3% 20.0% 59.3%
AAR.UN
PRICE INDEX
REIT Index
S&P/TSX
Source: FactSet, November 8, 2017 26HISTORIC GROWTH & CAPITAL RECYCLING
20171
13 properties
~$590 million
MARKET CAP GROWTH Sold 14 properties
$112 million
2016
2014 17 properties
First USA ~$289 million
Acquisition Sold 8 properties
2015 $38.7 million
2014 8 properties
Acquired 24 ~$150 million
properties Sold 12 properties
2,000 $54.6 million
~$429 million
Sold 14
1,750 properties
2013 $101.1 million
Acquired 77
1,500 properties
2012 $596 million
$ billions
Acquired Sold 8 properties
1,250 2011 26 properties $33.1 million
Acquired $295 million
29 properties Sold 1 property
1,000 $219 million $6.1 million
2010
750
Acquired
18 properties
2007 - 2009 $131 million
500
Acquired Real Estate
17 properties
becomes it’s own
$70 million
250 GICS Sector
Aug 2016
0
1 2007
83 165 247- 2009 2010
329 411 493 575 657 2011
739 821 903 2012 2013 2014 2015 2016 2017
985 10671149123113131395147715591641172318051887196920512133221522972379246125432625
27DISCIPLINED USE OF FUNDS
• Following initial growth of the Trust, in HISTORIC ACQUISITIONS
2013 the acquisition strategy was YEAR # PROPERTIES GLA PURCHASE PRICE GOING-IN
refocused on high quality, modern (000s) ($ millions) CAP RATE
assets in key locations 2007 - 2009 17 820 $69.8 7.00%
2010 18 1,160 130.9 7.99%
• Diversified the portfolio in 2014 with a 2011 29 2,130 218.6 7.14%
portfolio investment in the USA 2012 26 2,870 294.7 6.87%
2013 77 6,035 595.5 6.37%
• Initial USA entry was an investment in
e-commerce related assets 2014
Canada: 14 1,884 206.1 7.03%
USA: 10 1,755 203.5 7.12%
• Since 2014, further investments in USA 2015
have built significant scale in key Canada: 4 614 161.0 6.90%
USA (USD): 3 1,326 56.0 8.00%
markets of Georgia and Texas
2016
Canada: 11 1,369 182.6 6.31%
• Deployed capital on select value add USA (USD): 6 1,570 81.0 6.90%
development projects 2017 YTD
Canada: 9 2,307 385.2 5.19%
• Future acquisitions are focused on USA (USD): 4 2,555 153.1 6.13%*
quality and location
* Going-in cap rate applicable to income producing properties only and excludes land purchases
28STRATEGIC PORTFOLIO REPOSITIONING
Initial portfolio was predominately HISTORIC DISPOSITIONS
older assets YEAR # GLA PURCHASE GROSS CAP AGE
PROPERTIES (000s) PRICE PROCEEDS RATES (yrs)
($m) ($m)
Disposition program has targeted sales
of non-core assets, typically older 2014
Canada: 14 1,047 69.7 101.1 4.85% 19
assets with less functionality for USA: - - - - -
modern logistics operators 2015
Canada: 12 430 246.4 254.6 5.59% 26
USA: - - - - -
Acquisition program has been focused
on high quality, modern assets in 2016
Canada: 8 280 27.1 38.7 4.57% 33
strategic locations USA: - - - - -
2017 YTD1
As a result the portfolio is now Canada: 14 980 83.5 112.1 5.73% 22
predominately institutional quality class USA: - - - - -
“A” and “B+” assets
Asset sales have been accretive
1. Pro-forma information includes the Trust’s 2017 Q3 Financial Statements and Management Discussion and Analysis dated on November 8, 2017 and excludes the sales of partial interests to joint venture partners and properties
sold vacant.
29STRATEGIC INCREASE IN EXPOSURE TO E-COMMERCE
E-commerce growth continues to create strong demand for logistics space
Approximately 30% of our portfolio’s tenant activity is e-commerce related
As demand continues to grow, e-commerce is expected to make up a larger part of the portfolio
E-COMMERCE TENANTS 3.5 MILLION SF E-COMMERCE RELATED TENANT ACTIVITY
FedEx Ground
TFI International TFI
TFI
IKEA
TFI
Hudson’s Bay
Company
Kuehne + Nagel
Purolator
MTE Logistix
Porter Warehouse &
Distribution
Landmark Global
All Canadian Courier
MWI Veterinary
Supply
Canada Post
Toys ‘R’ Us
1. Pro-forma information includes the following: events as disclosed in the Trust’s 2017 Q3 Financial Statements and Management Discussion and Analysis dated on November 8, 2017, the Richmond Development as
disclosed in the press release dated July 12 2017 and excludes assets held for sale.
30BALANCE SHEET IMPROVEMENTS
TRUST INDEBTEDNESS NAVPU GROWTH and AFFOPU GROWTH
75%
6.00 0.60
70%
65% 5.00 0.50
60%
55% 4.00
0.40
50%
3.00
45% 0.30
40% 2.00
35% 0.20
1.00
30%
Q1-08
Q3-08
Q1-09
Q3-09
Q1-10
Q3-10
Q1-11
Q3-11
Q1-12
Q3-12
Q1-13
Q3-13
Q1-14
Q3-14
Q1-15
Q3-15
Q1-16
Q3-16
Q1-17
Q3-17
0.00 0.10
2011 2012 2013 2014 2015 2016
70% Maximum Indebtedness Ratio Permitted in Trust Documents Historic NAVPU
Historic Indebtedness Ratio Historic AFFOPU
40-45% Medium Term Target Range
40% Long Term Target
Strategic de-gearing to manage risk
AFFO per unit growth despite significant de-leveraging
Continual NAV per unit growth
31INVESTMENT SUMMARY
SCALABLE PLATFORM
SUSTAINABLE GROWTH STRONG PROPERTY
PORTFOLIO QUALITY
FUNDAMENTALS
PRUDENT CAPITAL
STRUCTURE
32RESEARCH ANALYST COVERAGE
PIRET is covered by the analysts listed below. Please note that any opinions, estimates or forecasts regarding our performance made by
these analysts are theirs alone and do not represent opinions, forecasts or predictions of PIRET or its management. PIRET does not by its
reference or distribution imply any endorsement of or concurrence with such information, conclusions or recommendations.
Heather Kirk, BMO Capital Markets Jimmy Khing Shan, GMP Securities
heather.kirk@bmo.com jshan@gmpsecurities.com
Mark Rothschild, Canaccord Genuity Brad Sturges, IA Securities
mrothschild@canaccordgenuity.com bsturges@iagto.ca
Dean Wilkinson, CIBC Matt Kornack, National Bank Financial
dean.wilkinson@cibc.ca matt.kornack@nbc.ca
Michael Markidis, Desjardins Securities Inc. Ken Avalos, Raymond James
michael.markidis@vmd.desjardins.com ken.avalos@raymondjames.com
Frederic Blondeau, Eight Capital Neil Downey, RBC Capital Markets
fblondeau@viiicapital.com neil.downey@rbccm.com
Rob Sutherland, Echelon Wealth Partners Pammi Bir, Scotia Capital
rob.sutherland@echelonpartners.com pammi.bir@scotiabank.com
33CONTACT US
Sylvia Slaughter
Director, Investor Relations
Tel: 416-479-8590, ext. 267
sslaughter@piret.ca
TORONTO CONTACT VANCOUVER CONTACT STOCK EXCHANGE LISTING
2100 – 121 King Street West, 910 - 925 West Georgia Street, Toronto Stock Exchange – TSX
PO Box 112, Toronto, ON Vancouver, BC V6C 3L2 Ticker symbol: AAR.un
M5H 3T9 Tel: 604-398-2836
Tel: 416-479-8590 Toll: 888-681-5959
Fax: 416-598-0435 Fax: 604-681-5969
www.piret.caYou can also read