BANCO SANTANDER S.A. MORTGAGE COVERED BONDS INVESTORS PRESENTATION - "Cédulas hipotecarias (CH)"

Page created by Debra Robbins
 
CONTINUE READING
BANCO SANTANDER S.A. MORTGAGE COVERED BONDS INVESTORS PRESENTATION - "Cédulas hipotecarias (CH)"
9M 2019

BANCO SANTANDER S.A.
MORTGAGE COVERED BONDS
INVESTORS PRESENTATION
Here to help you prosper

“Cédulas hipotecarias (CH)”
Important information
Non-IFRS and alternative performance measures

In addition to the financial information prepared in accordance with International Financial Reporting Standards (“IFRS”) and derived from our financial statements, this presentation contains
certain financial measures that constitute alternative performance measures (“APMs”) as defined in the Guidelines on Alternative Performance Measures issued by the European Securities and
Markets Authority (ESMA) on 5 October 2015 (ESMA/2015/1415en) and other non-IFRS measures (“Non-IFRS Measures”). The financial measures contained in this presentation that qualify as
APMs and non-IFRS measures have been calculated using the financial information from Santander Group but are not defined or detailed in the applicable financial reporting framework and
have neither been audited nor reviewed by our auditors. We use these APMs and non-IFRS measures when planning, monitoring and evaluating our performance. We consider these APMs
and non-IFRS measures to be useful metrics for management and investors to facilitate operating performance comparisons from period to period. While we believe that these APMs and non-
IFRS measures are useful in evaluating our business, this information should be considered as supplemental in nature and is not meant as a substitute of IFRS measures. In addition, other
companies, including companies in our industry, may calculate or use such measures differently, which reduces their usefulness as comparative measures. For further details of the APMs and
Non-IFRS Measures used, including its definition or a reconciliation between any applicable management indicators and the financial data presented in the consolidated financial statements
prepared under IFRS, please see 2019 3Q Financial Report, published as Relevant Fact on 30 October 2019 and 2018 Annual Financial Report, filed with the Comisión Nacional del Mercado
de Valores of Spain (CNMV) on 28 February 2019. These documents are available on Santander’s website (www.santander.com).

The businesses included in each of our geographic segments and the accounting principles under which their results are presented here may differ from the included businesses and local
applicable accounting principles of our public subsidiaries in such geographies. Accordingly, the results of operations and trends shown for our geographic segments may differ materially from
those of such subsidiaries

Forward-looking statements

Santander cautions that this presentation contains statements that constitute “forward-looking statements” within the meaning of the U.S. Private Securities Litigation Reform Act of 1995.
Forward-looking statements may be identified by words such as “expect”, “project”, “anticipate”, “should”, “intend”, “probability”, “risk”, “VaR”, “RoRAC”, “RoRWA”, “TNAV”, “target”, “goal”,
“objective”, “estimate”, “future” and similar expressions. These forward-looking statements are found in various places throughout this presentation and include, without limitation, statements
concerning our future business development and economic performance and our shareholder remuneration policy. While these forward-looking statements represent our judgment and future
expectations concerning the development of our business, a number of risks, uncertainties and other important factors could cause actual developments and results to differ materially from our
expectations. The following important factors, in addition to those discussed elsewhere in this presentation, could affect our future results and could cause outcomes to differ materially from
those anticipated in any forward-looking statement: (1) general economic or industry conditions in areas in which we have significant business activities or investments, including a worsening of
the economic environment, increasing in the volatility of the capital markets, inflation or deflation, and changes in demographics, consumer spending, investment or saving habits; (2) exposure
to various types of market risks, principally including interest rate risk, foreign exchange rate risk, equity price risk and risks associated with the replacement of benchmark indices; (3) potential
losses associated with prepayment of our loan and investment portfolio, declines in the value of collateral securing our loan portfolio, and counterparty risk; (4) political stability in Spain, the UK,
other European countries, Latin America and the US (5) changes in laws, regulations or taxes, including changes in regulatory capital and liquidity requirements, including as a result of the UK
exiting the European Union and increased regulation in light of the global financial crisis; (6) our ability to integrate successfully our acquisitions and the challenges inherent in diverting
management’s focus and resources from other strategic opportunities and from operational matters while we integrate these acquisitions; and (7) changes in our ability to access liquidity and
funding on acceptable terms, including as a result of changes in our credit spreads or a downgrade in our credit ratings or those of our more significant subsidiaries. Numerous factors could
affect the future results of Santander and could result in those results deviating materially from those anticipated in the forward-looking statements. Other unknown or unpredictable factors
could cause actual results to differ materially from those in the forward-looking statements.

                                                                                                                                                                                              2
Important information

Forward-looking statements speak only as of the date of this presentation and are based on the knowledge, information available and views taken on such date; such knowledge, information
and views may change at any time. Santander does not undertake any obligation to update or revise any forward-looking statement, whether as a result of new information, future events or
otherwise.

No offer

The information contained in this presentation is subject to, and must be read in conjunction with, all other publicly available information, including, where relevant any fuller disclosure
document published by Santander. Any person at any time acquiring securities must do so only on the basis of such person’s own judgment as to the merits or the suitability of the securities for
its purpose and only on such information as is contained in such public information having taken all such professional or other advice as it considers necessary or appropriate in the
circumstances and not in reliance on the information contained in this presentation. No investment activity should be undertaken on the basis of the information contained in this presentation. In
making this presentation available Santander gives no advice and makes no recommendation to buy, sell or otherwise deal in shares in Santander or in any other securities or investments
whatsoever.

Neither this presentation nor any of the information contained therein constitutes an offer to sell or the solicitation of an offer to buy any securities. No offering of securities shall be made in the
United States except pursuant to registration under the U.S. Securities Act of 1933, as amended, or an exemption therefrom. Nothing contained in this presentation is intended to constitute an
invitation or inducement to engage in investment activity for the purposes of the prohibition on financial promotion in the U.K. Financial Services and Markets Act 2000.

Historical performance is not indicative of future results

Statements as to historical performance or financial accretion are not intended to mean that future performance, share price or future earnings (including earnings per share) for any period will
necessarily match or exceed those of any prior period. Nothing in this presentation should be construed as a profit forecast.

Third Party Information

In particular, regarding the data provided by third parties, neither Santander, nor any of its administrators, directors or employees, either explicitly or implicitly, guarantees that these contents
are exact, accurate, comprehensive or complete, nor are they obliged to keep them updated, nor to correct them in the case that any deficiency, error or omission were to be detected.
Moreover, in reproducing these contents in by any means, Santander may introduce any changes it deems suitable, may omit partially or completely any of the elements of this presentation,
and in case of any deviation between such a version and this one, Santander assumes no liability for any discrepancy.

                                                                                                                                                                                              3
CONTENT

1.   Spanish macroeconomic environment

2.   Santander Business Model & Strategy

3.   Santander Spain – Main figures

4.   Mortgage Covered Bonds – Sep 19

5.   Appendix

                                           4
Spanish
macroeconomic
environment

                01
Spanish macroeconomic environment

The expansionary cycle in the Spanish economy is expected to continue, but at
slower pace in a very low interest rate environment…
                 Annual GDP Growth (real, %)                                    Interest rates (official rate, %)

          2.9
                      2.4
                                     2.0
                                                    1.7        1.5

                                                                        0.00       0.00       0.0        0.00        0.00
         2017        2018         2019 (e)       2020 (e)    2021 (e)   2017       2018     2019 (e)    2020 (e)    2021 (e)

                   Annual inflation rate (%)                                      Unemployment rate1 (%)

                                                                         16.6
                                                                                    14.5       14.0
          2.0                                                                                              13.2        12.8
                      1.7
                                                               1.4
                                                    1.1
                                     0.7

          2017       2018          2019 (e)       2020 (e)   2021 (e)    2017       2018     2019 (e)    2020 (e)    2021 (e)

                    Source: Santander Research Department                                                                       6
                    (1) End of period
Spanish macroeconomic environment

…backed by job creation, higher consumption and real estate recovery
              Contribution to GDP growth (% YoY)                                                          Housing: sales and permits (k)
                                                                                                  600                      New building permits (RHS)             120
     6
                                                                                                  550                      Sales (LHS)                            110
     4                                                                                                                                                            100
                                                                                                  500
                                                                                                                                                                  90
     2                                                                                            450                                                             80
                                                                                                  400                                                             70
     0                                                                                                                                                            60
                                                                                                  350
                                                                                                                                                                  50
    -2                                                                                            300                                                             40
    -4                                                                                            250                                                             30
            2013      2014      2015     2016     2017     2018     2019(e) 2020(e) 2021(e)

                     Net external demand                    Domestic demand                                                                              *Rolling 12m sum

                                                                                                                         Indebtedness (% GDP)
                   Current account balance (% GDP)
                                                                                                               Public
                                            3.2
                                                                                                               Private
                                                     2.7                                       250%

               2.0                 2.0                                                         200%
                                                              1.9
                         1.7                                             1.8    1.7
                                                                                         1.5
                                                                                               150%

                                                                                               100%

     0.1
                                                                                               50%
     2012      2013      2014     2015     2016     2017     2018       2019    2020    2021
                                                                         (e)     (e)     (e)
                                                                                                0%
                     Source: Santander Research Department and Bloomberg                                1995     2000      2005   2010    2013    2016     2018         7
                     Current account balance and GDP have been recently restated
Spanish macroeconomic environment: Financial system loans and customer deposits

Deleveraging continues, reducing stock of loans

                        Total loans (EUR bn)
                                                                                       Demand for housing loans declined in Q3’19. The factors that
                                                                                             explain this decline are, mainly, less consumer confidence and
                                                                                             regulatory changes. Also, lower to a lesser extent, the worsening
          1,180     1,173        1,167         1,178         1,163                           outlook in the housing market, higher funding by own funds and
                                                                                             greater use of loans from other institutions.
 YoY
 (%)                              -2.1                        -1.2
          -3.2       -3.9                                                              Demand for consumer credit and others declined slightly due to a
                                                -4.4
                                                                                             decrease in consumer confidence, lower spending on consumer
                                                                                             durables and a higher use of loans from other entities. Demand for
         Sep-18    Dec-18        Mar-19        Jun-19       Aug-19                           funds from companies declined between July and September 2019,
                                                                                             in both SMEs and corporates.
                      Total deposits (EUR bn)

          1,040     1,061        1,079         1,104         1,090

                                   6.3           5.3          6.1                      In savings, slight decrease in volumes with varied performance by
 YoY                 4.2                                                                     product: migration from time to demand deposits, both in households &
 (%)       3.3
                                                                                             non-financial entities.

         Sep-18    Dec-18        Mar-19        Jun-19       Aug-19

                  Source: Bank of Spain. Comments from the Survey on banking loans (Encuesta sobre préstamos bancarios en España: Octubre 2019; Boletín Económico 4/2019)   8
                  Loans to Other Resident sectors
Spanish macroeconomic environment: Credit quality

Spanish NPL ratios in a downward trend and in line with EU average

                    Spain Mortgage NPL ratios (%)                                                           European Banks Total NPL ratio
                                                                                                                   by country (%)

  6.50

                                                                                                    12
  5.50

  4.50
                                                                                                     8
  3.50

  2.50
                                                                                                     4

  1.50

  0.50                                                                                               0
      2007   2008   2009   2010   2011   2012   2013    2014   2015    2016   2017    2018   2019        IT HU PL IE ES EU FR AT BE NL DK FI DE GB NO SE

                      Source: Bank of Spain (Jun-19) and EBA Q2 2019 Risk Dashboard                                                                 9
Spanish macroeconomic environment: Spanish housing market adjustment

 At an advanced stage: adjustment ended in flows and prices, started in stocks

                         Housing starts (thousand units)                                                                           Total housing sales (thousand units)
             * Accumulated 12 months                                     Dec-18 vs Dec-17:         Finished             * Accumulated 12 months
                                                                              +24,7%               houses:
                                                                                                                                                                                                  532      583   575
                                                                                                   2013: 44                491                                                              458
                                                                                                   2014: 31                                                                  402
                                                                              101     106                                           349      364                  366
        92       78                                                   81                           2015: 30                                            301
                           44                          50    64                                    2016: 25
                                    34      35
                                                                                                   2017: 36
                                                                                                   2018: 41
                                                                                                  Aug-19*: 48
                                                                                                   (thousands)            2010     2011      2012     2013       2014        2015       2016      2017    2018 Jun-19
       Source: Ministry of Development                                                                           Source: Ministry of Development and General Council of Notaries

                          Housing: Prices (price index per                                                                                 Price heterogeneity
                                 m2 in real terms)                                                                                        (%yoy in nominal terms)
110                                Base 100: Q3’07 “peak”                                                              10%
                                                 100                                                                                          Main Cities
                                                                            Q4’18 / Q4’17:
100                                                                                                                                           Total
                                                                                2,1%                                                          Other (ex. Touristic destinations)
                                                                             (real terms)                               5%
90

80                                                                                                                      0%
                                                                                            Q2’19: 67
70
                                                                                                                        -5%
60

50                                                                                                                     -10%
      Q4'01    Q4'03       Q4'05    Q4'07    Q4'09     Q4'11     Q4'13     Q4'15    Q4'17
          Source: Ministry of Development and Bank of Spain (appraisal methodology)
                                                                                                                       -15%
                                                                                                                          Mar-08    Sep-09   Mar-11     Sep-12      Mar-14         Sep-15    Mar-17   Sep-18       10
                                                                                                                    Source: Tinsa (appraisals)
Grupo Santander
Business Model &
Strategy

                   02
Grupo Santander: 9M 2019

Focus on increasing customer loyalty via unique personal banking relationships...

             Total customers                                Loyal customers                  Loyal / Active
              144 mn (+4%)                                   21.0 mn (+10%)                   customers

                                                   Individuals (mn)   Companies (k)

                                                      +10%                +5%           29.5%            30.2%
                                            144              19.2      1,676   1,762
            139 141 142                             17.5
        138
135 136                                                                                 Sep-18             Sep-19

                                                                                        Increased loyalty ratio in
Mar-18 Jun    Sep   Dec Mar-19 Jun           Sep   Sep-18   Sep-19    Sep-18   Sep-19     8 core countries

                    Note: Year-on-year changes                                                                       12
Grupo Santander: 9M 2019

… together with increased digitalisation

        Digital customers1                                                                   # Accesses2                                                                 # Transactions3
                                                                                               (online and mobile)                                                        (monetary and voluntary)

               36.2 mn (+20%)                                                 5,742 mn in 9M'19 (+27%)                                                        1,634 mn in 9M'19 (+25%)

                                                  36.2                                                                                                                                                   545 573
                                33.9 34.8                                                                                        2,016                                               498 517
                     32.0                                                                                        1,895
             30.1                                                                                    1,768 1,830                                                  443 456
27.5 28.4                                                                                  1,624
                                                                                 1,521                                                                  409
                                                                       1,381

Mar-18 Jun   Sep         Dec Mar-19 Jun             Sep                Q1'18       Q2        Q3        Q4     Q1'19       Q2        Q3                 Q1'18       Q2        Q3       Q4      Q1'19       Q2        Q3

                    Note: YoY changes.
                    1.    Data as of 30 September. Every natural or legal person that, being part of a commercial bank, has logged in to their personal area of internet banking or mobile phone (or both) in the
                          last 30 days. Digital customers in the last 90 days: 39.6 mn.
                                                                                                                                                                                                                    13
                    2.     Private accesses. Logins of bank’s customers on Santander internet banking or apps. ATM accesses by mobile are not included.
                    3.    Customer interaction through mobile or internet banking which resulted in a change of balance. ATM transactions are not included.
Grupo Santander: 9M 2019

9M'19 underlying P&L YoY performance

                                                    9M'19     9M’18     % vs. 9M’18
EUR million                                                                     Constant
                                                                        Euros
                                                                                 euros          Higher customer revenue due to
Net interest income                                  26,442   25,280      5        5            increased business volumes and
                                                                                                      spread management
Net fee income                                        8,818    8,529      3        4
                                                                                                     Lower market revenue and
Gains on fin. trans. and other                        1,642    2,073     -21     -21                 higher cost of FX hedging
Total income                                         36,902   35,882      3        3
Operating expenses                                  -17,309   -16,843     3        3          Cost control with an individualised and
                                                                                           targeted cost management across the board
Net operating income                                 19,593   19,039      3        3
Loan-loss provisions                                 -6,748    -6,418     5        5                   Good credit quality
Other results                                        -1,422    -1,391     2        3        with low cost of credit and better NPL ratio
Underlying PBT                                       11,423   11,230      2        2
Taxes                                                -3,994    -4,053     -1       -1
Minority interests                                   -1,249    -1,135    10        9
Underlying attributable profit                        6,180    6,042      2        3
Net capital gains and provisions1                    -2,448     -300       -        -       In 2019, mainly XXXXXX
                                                                                                            UK goodwill impairment
                                                                                                     and restructuring costs
Attributable profit                                   3,732    5,742     -35     -35

                 1. 2019 details on the next page                                                                                    14
Grupo Santander: 9M 2019
Customer revenue growth QoQ (+2%) and YoY (+5%) driven by developing markets
and consumer businesses

Net interest income
                                                                                                YoY growth due to higher volumes and spread management,
                                                             8,895 8,966                        with improvements in 6 of our 10 core markets
                      8,663
                                                                                                QoQ positive evolution in developing markets while mature
    8,232                                                                                       markets are impacted by lower interest rates

Net fee income
                                                                                                YoY increase accelerating vs. previous quarters
    2,821                                                    2,910 3,024
                       2,774                                                                    QoQ improvement boosted by South America

Other revenue
                                                                                                9M'19 vs. 9M’18 affected by lower activity, markets and FX hedges
     731              786                                                   697
                                                              473                               QoQ increase due to portfolio sales and the annual SRF
                                                                                                contribution recorded in Q2’19
    Q1'18    Q2         Q3           Q4         Q1'19          Q2            Q3

                  Note: Constant euros.
                       Customer revenue: net interest income + net fee income                                                                                                                   15
                       Other revenue includes gains/losses on financial transactions, income from the equity accounted method, dividends and other operating results. Contribution to the SRF
                       recorded in Q2'18 and Q2'19. Contribution to the DGF in Spain recorded in Q4’18.
Grupo Santander: Business model

Our strategy has allowed us to generate high and recurring pre-provision profit,
leading to resilient growth through the economic cycle…
Resilient profit generation throughout the cycle                                                    PPP/Loans well above most European peers1
Group attributable profit, EUR bn                                                                     %, Jun-19

                                                                                                            Peer 1                                                                       3.2

                                                                                                                                                                                   2.8

        9.1    8.9    8.9
                              8.2
                                                                                                            Peer 2                                                           2.4
  7.6                                                                                   7.8
                                                                                 6.6
                                                                  6.0    6.2
                                     5.3
                                                           5.8                                              Peer 3                                                     2.0
                                                   4.2

                                            2.3
                                                                                                            Peer 4                                                    1.9

                                                                                                            Peer 5                                             1.7
 2006   2007   2008   2009   2010   2011   2012    2013   2014   2015    2016   2017   2018

                                                                                                            Peer 6                                      1.4

                        1.   European peers include: BBVA, BNP Paribas, Credit Agricole, HSBC, ING and Unicredit. Santander calculations using publically available data.                16
Grupo Santander: Business model

… and to generate stable and predictable growth

Predictable results with the lowest volatility among peers coupled with growth in earnings
Quarterly reported EPS volatility1, 1999-Q2’19

                 691%           341%

                                               122%
                                                               108%
                                                                                87%
                                                                                               76%
                                                                                                               64%
                                                                                                                               44%             42%
                                                                                                                                                              35%

                                                                                                                                                                     9%

                   US              IT             CH              CH              FR             FR              US              US              NL             US

                   2x              2x             0x              0x              6x             4x              6x              4x             1x             10x   5x

                                                                              Net income increase 1999-2018

                     1.   Source: Bloomberg, with GAAP Criteria. Note: Standard deviation of the quarterly EPS starting from the first available data since Jan-99        17
Grupo Santander: Business model

Geographic and business diversification, coupled with our subsidiaries model

Loan portfolio by country                                                              Loan portfolio by business
Breakdown of total gross loans excluding reverse repos, % of operating areas ex. SGP   Breakdown of total gross loans excluding reverse repos, Sep-19
Sep-19

                           Argentina;
                                                                                                       Other individuals;
                    Chile; 5% 1% Other S. Am.; 1%                                                             10%
           Brazil; 8%
                                                  Spain; 22%

      Mexico; 4%                                                                              CIB; 12%
                                                                                                                                              Home
                                                                                                                                            mortgages;
                                                                                                                                               36%
     US; 11%

                                                       SCF; 11%                          Corporates;
                                                                                            14%
 Other Eur; 4%
      Poland; 3%
          Portugal; 4%
                                             UK; 26%                                                SMEs; 11%                   Consumer;
                                                                                                                                   17%

        Total gross loans excluding reverse repos: EUR 900 bn
        RWAs as of Sep-19: EUR 614 bn                                                           88% of loan portfolio is Retail, 12% Wholesale

                                                                                                                                                         18
Grupo Santander: Asset Quality

Continued credit quality improvement on a YoY and QoQ basis…

%

                       0.98      0.98     1.00
Cost of credit                                     Lower or stable cost of credit in 8 core
                                                   markets
                       3.87
                                 3.51     3.47

NPL ratio                                          NPL ratio fell YoY in most markets

                         68       68       67
                                                   High level of allowances to total loans:
Coverage                                           strong first line of defense
ratio
                      Sep-18     Jun-19   Sep-19

                                                                                              19
Grupo Santander: Asset Quality
   …to levels well below previous years, supported by generalised improvements across
   geographies

   Credit quality ratios                                                                    NPL ratios by country
    %                                                                                       %
                                                                                                                    Q3 2018   Q3 2019
                                                                                                     Spain           7.55      7.23
                         4.08% 4.02%                                                                 SCF             2.45      2.25
                 3.93%                       3.92% 3.87%
                                                                                                     UK              1.12      1.08
                                                              3.73%
                                                                      3.62%                          Poland          4.23      4.35
NPL ratio                                                                     3.51% 3.47%            Portugal        7.43      4.90
                                                                                                     US              3.00      2.18
                                                                                                     Mexico          2.41      2.30
                                                                                                     Brazil          5.26      5.33
                                1
                 2016    2017 Q1'18 Q2'18 Q3'18 Q4'18 Q1'19 Q2'19 Q3'19                              Chile           4.78      4.48
                                                                                                     Argentina       2.47      3.64

                                                                                            Cost of credit ratios by country
                 1.18%                                                                      %
                                                                                                                    Q3 2018   Q3 2019
                         1.07%                                                                       Spain           0.41      0.41
                                    1.04%
Cost of credit                               0.99% 0.98% 1.00% 0.97% 0.98% 1.00%                     SCF             0.40      0.38
                                                                                                     UK              0.09      0.08
                                                                                                     Poland          0.69      0.71
                                                                                                     Portugal        0.03      0.00
                                                                                                     USA             3.00      3.09
                                1
                 2016    2017 Q1'18 Q2'18 Q3'18 Q4'18 Q1'19 Q2'19 Q3'19                              Mexico          2.72      2.55
                                                                                                     Brazil          4.17      3.85
                                                                                                     Chile           1.18      1.06
                           1.       Acquisition of Banco Popular in 2017
                                                                                                     Argentina       2.92      4.86     20
Grupo Santander: Liquidity and Funding

Well-funded, prudent and highly liquid balance sheet with high contribution from customer
deposits and diversified wholesale instruments
Liquidity Balance Sheet
 EUR bn, Sep-19             1,216                  1,216                                                               Liquidity Coverage Net Stable Funding
                                                                                                                           Ratio (LCR)       Ratio (NSFR)
                                                                                                                               Aug-19            Jun-19

 Loans and                                                       Customer
 advances to                                        814          deposits                                                      155%             113%
 customers                   916
                                                                                                              Group

                                                                                                                        1
                                                     55          Securitisations and others                                    150%             124%
                                                    176          M/LT debt issuances
Financial assets             199
                                                     33          ST Funding
Fixed assets & other         100                    137          Equity and other liabilities
                           Assets               Liabilities                                                                    141%             105%
 HQLAs2
 EUR bn, Sep-19      HQLAs Level 1                   195.0                                                              1
                                                                                                                               162%             106%
                     HQLAs Level 2                     15.3

                         Level 2A                        7.1

                         Level 2B                        8.2
                   Note: Liquidity balance sheet for management purposes (net of trading derivatives and interbank balances)
                   1. Spain: Parent bank, UK: Ring-fenced bank                                                                                            21
                   2. 12 month average, provisional
Grupo Santander: Liquidity and Funding

 Issuances show diversification across instruments and entities

 Debt outstanding by type                              Debt outstanding by issuer entity
  EUR bn and %, Sep-19                                 EUR bn and %, Sep-19

                      Preference shares;                                                  Other;
                            9.5; 5%                                                       6.8; 4%
                                                                 USA; 8.5; 5%
              Sub debt;
              12.8; 7%                                      Brazil; 7.1; 4%

                                                        Chile; 10.5; 6%

Senior non-                                 Senior;
 preferred;                                                                                         San S.A.;
                                           68.8; 39%       SCF;
 36.3; 21%                                                                                          71.2; 41%
                                                         20.2; 11%

                          Covered bonds;                                      UK; 51.6;
                            48.5; 28%                                           29%

                                                                                                                22
Santander Spain
Main figures

                  03
Santander in Spain remains committed to maintaining its leadership while accomplishing a
best-in-class integration of Banco Popular
                                                                                                                   KEY DATA                                     9M’19           YoY Var.
       STRATEGIC PRIORITIES
                                                                                                                                    1
                                                                                                                   Gross loans                                 194,485              -6%
    Largest bank4 in Spain and completed Banco
                                                                                                                                         1
    Popular integration                                                                                            Customer funds                              312,918             +3%

    Accelerate the Bank’s digital transformation                                                                   Underlying att. profit1                         1,185           +3%
    towards a data driven company
                                                                                                                   Underlying RoTE                                10.6%        +43 bps
    Keep on growing SMEs and corporate segments
    backed by Banco Popular’s capabilities                                                                         Efficiency ratio                               53.4%        -284 bps
                                                                                                                                               2
                                                                                                                   Loans market share                                17.4       -21 bps
    Increase customer revenue and obtain cost
    synergies related to Banco Popular’s integration                                                                                               2
                                                                                                                                                                     18.9       -14 bps
                                                                                                                   Deposits market share
    Continue to reduce doubtful assets and leverage                                                                Loyal customers
                                                                                                                                          3
                                                                                                                                                                         2.5       +6%
    our capital efficient model
                                                                                                                   Digital customers3                                    4.7      +20%

                                                                                                                   Branches                                        3,852           -12%

                                                                                                                   Employees                                     29,713             -5%

                 1.   EUR mn. Volumes excluding Repos and Reverse Repos
                 2.   Spain market share includes: SAN Spain (public criteria) + Openbank + Hub Madrid + SC Spain. As of Jun 2019. Other Resident sectors in Deposits.
                                                                                                                                                                                      24
                 3.   Millions
                 4.   In terms of total assets
Spain: profit up boosted by cost synergies, the improvement in customer spread (+20 bps vs.
9M’18) and portfolio management. QoQ profit evolution benefited by SRF contribution in Q2
P&L*                                           Q3'19          % Q2'19            9M'19              % 9M'18
NII                                                  967           -4.2            2,985               -1.8 +1%
                                                                                                                           31%          +20%
Net fee income
             1                                       614           -1.6            1,861               -6.5              Loyal/active     Digital
                                                                                                                         customers      customers
Total income                                     1,989              7.6            5,695               -2.0

Operating expenses                                -999             -2.1           -3,043               -7.0 -6%
LLPs                                              -210             -8.0               -680             4.8
PBT                                                  681           48.7            1,617               5.9

Underlying att. profit                               491           45.3            1,185               3.3 +5%           0.41%          7.23%
                                                                                                                           (0 bps)
(*) EUR mn        Changes excluding IFRS 16 impact                                                                                      (-32 bps)
                                                                                                                           Cost of
                                                                                                                                        NPL ratio
                                                                                                                            credit
ACTIVITY
Volumes in EUR bn
                           313

                                                 2.03%     2.05%     2.06%     2.08%        2.02%
      194                         -1%                                                               Yield on loans
            -3%                  QoQ
                                                                                                                         53.4%           11%
            QoQ                                                                1.94%        1.89%                         Efficiency
                                                  1.81%                                                                                   RoTE
                                  +3%                                                                                        ratio
            -6%                  YoY                                                                Cost of deposits
            YoY                                  0.22%     0.19%     0.14%     0.14%        0.13%
                                                  Q3'18      Q4      Q1'19       Q2          Q3
   Loans                  Funds

                          Note: Loans excluding reverse repos. Funds: deposits excluding repos + marketed mutual funds                              25
                          Customers and credit quality ratios YoY change. Underlying RoTE
Mortgage Covered Bonds
Banco Santander S.A.
September 2019

                         04
Mortgage covered bonds (Banco Santander S.A.)

Mortgage Covered Bonds are direct obligations of Banco Santander S.A. collateralised
by its mortgage portfolio

             Banco Santander S.A.’s mortgage portfolio is a low risk profile business, focused on residential
              and first home financing…

             …well diversified by geography and maturity with an adequate LTV

             Mortgage covered bonds (CH) show a high level of over-collateralisation…

             …and have a three notch rating uplift in Banco Santander S.A.: rated Aa1 by Moody’s and AA by
              Fitch

             CH represent ~28% of total wholesale issuances at Santander Group. Santander is one of the top
              issuers in Spain

            Santander is a relevant player in the Spanish mortgage business (market share 15-20%1),
                      a key commercial product in our customer-focused business model

               1. Estimation. Last data available of Spanish mortgage covered bonds outstanding is for 2017 (EUR 216,498 mn). Please see appendix.   27
Mortgage covered bonds (Banco Santander S.A): Main figures

                            Collateral description                                        2              Mortgage covered bonds
            1         (cover pool – 100% mortgage loans)                                                       description
                 EUR million                                                                    EUR million
                                 84,657
                                                                                                                     Outstanding

                                                        58,311                                                         40,449

                                                                                                     In the market     22,913

                                                                                                          Retained     17,536

                            Total cover pool      Eligible Portfolio
                            September 2019        September 2019                                                  September 2019

                    Average loan size (€ thousand)                     102
                    Number of loans (thousand)                         826
                                                                                            Collateralisation           369%
                    Loan seasoning (years)                             7.0                       rate1
                    Remaining loan maturity (years)                   14.9
                    Average cover pool LTV (%)                          72
                                                                                               Maximum issuance capacity: EUR 46,649 mn
                    Eligible pool LTV (%)                               46                         (80% eligible cover pool portfolio)
                    Eligible portfolio NPL ratio (%)                   3.0
                    Interest rate type            12% fixed; 88% FRN

                1. Only as a percentage of mortgage covered bonds (CH) in markets. Considering 100% CH, 209% (September 2019)             28
Mortgage covered bonds (Banco Santander S.A): Description of collateral (1/4)

Low risk portfolio focused on residential and first home financing…

                                                       Cover pool portfolio: EUR 84.7 bn
           September 2019

                     Segments                                                                             Guarantees

      Developer             5%                                                                                4%       Land
      activities1                                            Second        home2
           Other           30%                                            1%                                 22%       Other
       business
       activities

                                                                                                             74%       Residential3
    Households             65%

                                                                                            99%

                                                                                            First home2

                    1. Developer mortgage product                                                                                     29
                    2. Estimate from mortgages to individuals
                    3. Finished and under construction buildings for residential purposes
Mortgage covered bonds (Banco Santander S.A.): 1) Description of collateral (2/4)

... concentrated in urban areas with lower unemployment rates …

                                                                                                           %
          September 2019                                                                 Regions1         Back-
                                                                                                          book
                                Castile-LM, Murcia Asturias
                               Extremadura                                          Madrid                 26.52
                              Canary                                                Andalusia              18.04
                              Islands
                                                                   Madrid           Catalonia              16.32

                                                                                    Valencian Community     6.86

                 Andalusia                                                          Galicia                 5.61

                                                                                    Canary Islands          4.36
                                                         71%
                                                                                    Castile and Leon        4.20
                                                         29%
                                                                                    Basque Country          3.29
                  Valencian                                                         Balearic Islands        3.26
                 Community
                                                                    Catalonia       Castile La Mancha       2.51
                           Balearic
                                                                                    Aragon                  2.00
                           Islands
                                Galicia                  Castile and                Murcia                  1.88
                                        Aragon, Nav., BasqueLeón                    Asturias                1.37
                              Cantabria   La Rioja    Country
                                                                                    Extremadura             1.32

                        Regions with unemployment rates < Spain’s average           Cantabria               1.29

                        Regions with unemployment rates > Spain’s average           Navarre                 0.79

                                                                                    La Rioja                0.38

                 1. Andalusia includes Ceuta y Melilla                                                             30
Mortgage covered bonds (Banco Santander S.A.): 1) Description of collateral (3/4)

… well distributed by maturity…

       Distribution by maturity1                                                                                      Maturity profile2,3

 September 2019                                                           EUR million

                                                                                                                                                             29,820

                                   30 years
             4%

         26%
 20-30
 years                                                                                                                                                                        3,612
                                                                                                                                     3,235
                                     39%                                             1,825 1,563 2,096 2,610 2,693 2,785 2,731 2,795
                                            10-20                          395 1,030                                                                                                  7
                                            years
                                                                          2019 2020 2021 2022 2023 2024 2025 2026 2027 2028 2029 2030- 2040- 2050- 2060-
                                                                                                                                 2039 2049 2059 2100

                  1. Bucket “< 10 years” includes lines of credit and past due and non-performing loans undergoing legal proceedings. Also includes matured. 2. Excluding lines of    31
                  credit and past due and non-performing loans undergoing legal proceedings. 3. Further information in Appendix
Mortgage covered bonds (Banco Santander S.A.): 1) Description of collateral (4/4)

... and with an adequate loan-to-value

                                   Cover pool portfolio                                                                     Eligible portfolio1

                  September 2019                                                                        September 2019

                              72% = LTV                                                                         46% = LTV (weighted
                          (weighted average)                                                                         average)
                                                                                        100
            100                                                                                                                                            100            100
                                                                                                   100
                                                                      81
                              Cumulative (%)
                                                                                                                  Cumulative (%)              77
             75           Outstanding by LTV                                                         75
                                                       60                                                       Outstanding by
                         interval (%)
                                                                                                                LTV interval (%)
             50                                                                                      50
                                        32                                                                                     41
                                                                                                                                               36
                                                       28
                                        23                            21             19                                                                      23
             25          10                                                                          25                         29
                                                                                                                 12
                         10                                                                                      12                                                           -
              0                                                                                        0
                       0-20%         20-40%         40-60%         60-80%          >80%                       0-20%         20-40%         40-60%         60-80%          >80%
                                                                                                            1) Total cover pool portfolio excluding high LTV loans (residential >80%
                                                                                                            and commercial >60%, without additional guarantees); loans w/o
                                                                                                            appraised value and non-euro loans; 100% developer loans; and others

                  1. Total cover pool portfolio excluding high LTV loans (residential >80% and commercial >60%, without additional guarantees); loans w/o appraised value and non-euro   32
                  loans; 100% developer loans; and others
Mortgage covered bonds - 2) Description of bonds

Average maturity 6 years due to low issuance activity in recent years

                     Distribution by maturity                                         Maturity profile

          % total outstanding, September 2019                        September 2019

                     2019               2020-2021
                        1,000
                                       10,340
                                                                                                         5,011                  4,600

                                                                                        6,500

                                                                                                         7,814                  7,784
                       16,284                            2022-2025                                                      1,425
                                                12,825                                  3,840
             > 2026                                                          -
                                                                          1,000
                                                                                                                        2,475

                                                                          2019        2020-2021       2022-2025         2026    >2026

                                                                                                In the market     Retained

                          Average maturity: 6 years                               100% issued in euros

                                                                                                                                        33
Appendix

           05
Appendix – Spanish CH market: Volumes

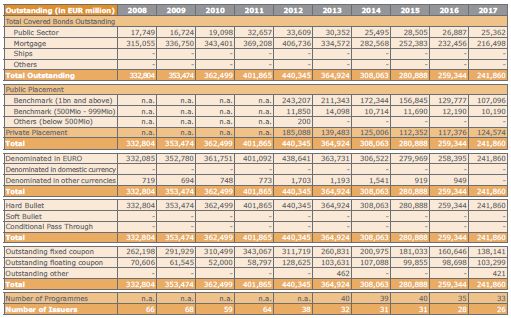
            Spain. Covered bonds outstanding (EUR mn)   Spain. Covered bonds issuance (EUR mn)

                                                                                                 35
Appendix – Spanish CH market: Volumes

                    Spain. Covered bonds outstanding by collateral, size, currency and coupon (EUR mn)

                                                                                                         36
Appendix - Mortgage covered bonds (Banco Santander S.A.): Description of collateral

                          Sep-19                            Maturity profile of total cover pool
                          EUR million

                               2019                   395,442,553                2036              2,780,175,089      2053       257,467,112
                               2020                1,029,848,956                 2037              2,873,584,752      2054       312,660,017
                               2021                1,825,294,474                 2038              2,193,622,552      2055       404,977,903
                               2022                1,562,834,788                 2039              2,187,488,457      2056       377,746,627
                               2023                2,095,567,366                 2040              2,011,290,646      2057       329,003,633
                               2024                2,610,131,548                 2041              1,842,181,762      2058       108,290,680
                               2025                2,693,277,762                 2042              2,139,744,634      2059        39,889,455
                               2026                2,785,273,674                 2043              1,830,392,223      2060         3,709,894
                               2027                2,731,157,086                 2044              2,125,888,515      2061         1,874,621
                               2028                2,794,545,965                 2045              2,060,260,387      2062           353,989
                               2029                3,235,253,499                 2046              2,123,265,801      2063           272,108
                               2030                3,234,514,336                 2047              2,928,379,980      2065           344,304
                               2031                3,018,988,037                 2048              2,697,412,002      2066           179,775
                               2032                2,947,269,213                 2049              1,914,667,548      2072           227,987
                               2033                3,584,947,016                 2050                   702,666,043   2080           333,118
                               2034                3,772,499,033                 2051                   531,202,375   2100            87,322
                               2035                3,226,767,291                 2052                   548,316,148   Matured   5,785,863,533

               (1) Lines of credit and past due and non-performing loans undergoing legal proceedings
                                                                                                                                                37
Thank you
Our purpose is to help people
and business prosper

Our culture is based on believing
that everything we do should be
You can also read