A large-scale image dataset of wood surface defects for automated vision-based quality control processes version 1; peer review: awaiting peer ...
←
→
Page content transcription
If your browser does not render page correctly, please read the page content below
F1000Research 2021, 10:581 Last updated: 01 SEP 2021

DATA NOTE

A large-scale image dataset of wood surface defects
for automated vision-based quality control processes [version
1; peer review: awaiting peer review]
Pavel Kodytek, Alexandra Bodzas                        , Petr Bilik
Department of Cybernetics and Biomedical Engineering, VSB-Technical University of Ostrava, Ostrava, 70800, Czech Republic

v1   First published: 16 Jul 2021, 10:581                                       Open Peer Review
     https://doi.org/10.12688/f1000research.52903.1
     Latest published: 16 Jul 2021, 10:581
     https://doi.org/10.12688/f1000research.52903.1                             Reviewer Status AWAITING PEER REVIEW

                                                                                Any reports and responses or comments on the

Abstract                                                                        article can be found at the end of the article.
The wood industry is facing many challenges. The high variability of
raw material and the complexity of manufacturing processes results
in a wide range of visible structure defects, which have to be
controlled by trained specialists. These manual processes are not only
tedious and biased, but also less effective. To overcome the
drawbacks of the manual quality control processes, several
automated vision-based systems have been proposed. Even though
some conducted studies achieved a higher recognition rate than
trained experts, researchers have to deal with a lack of large-scale
databases and authentic data in this field. To address this issue, we
performed a data acquisition experiment set in the industrial
environment, where we were able to acquire an extensive set of
authentic data from a production line. For this purpose, we designed
and implemented a complex technical solution suitable for high-speed
acquisition during harsh manufacturing conditions. In this data note,
we present a large-scale dataset of high-resolution sawn timber
surface images containing more than 43 000 labelled surface
defects and covering 10 types of the most common wood defects.
Moreover, with each image record, we provide two types of labels
allowing researchers to perform semantic segmentation, as well as
defect classification, and localization.

Keywords
wood surface defects, high resolution dataset, wood industry, wood
processing, wood quality control process, wood defects dataset

                                                                                                                          Page 1 of 10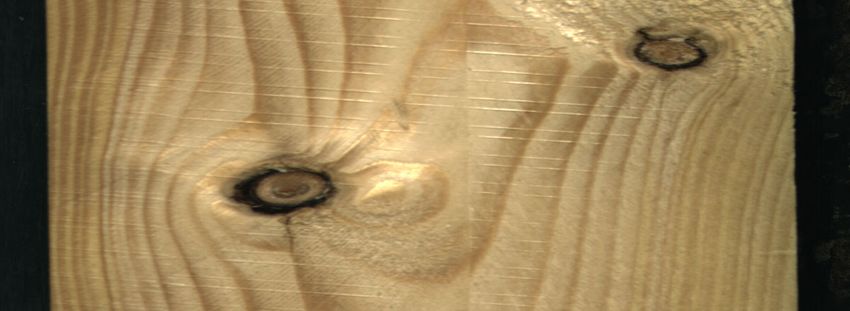
F1000Research 2021, 10:581 Last updated: 01 SEP 2021

Corresponding author: Alexandra Bodzas (alexandra.bodzas@vsb.cz)
Author roles: Kodytek P: Conceptualization, Investigation, Methodology, Software, Validation, Writing – Original Draft Preparation;
Bodzas A: Software, Writing – Original Draft Preparation, Writing – Review & Editing; Bilik P: Funding Acquisition, Project Administration,
Supervision
Competing interests: No competing interests were disclosed.
Grant information: This work was supported by the “Student Grant System” of VSB-TU Ostrava, project number SP2021/123.
Copyright: © 2021 Kodytek P et al. This is an open access article distributed under the terms of the Creative Commons Attribution
License, which permits unrestricted use, distribution, and reproduction in any medium, provided the original work is properly cited.
How to cite this article: Kodytek P, Bodzas A and Bilik P. A large-scale image dataset of wood surface defects for automated vision-
based quality control processes [version 1; peer review: awaiting peer review] F1000Research 2021, 10:581
https://doi.org/10.12688/f1000research.52903.1
First published: 16 Jul 2021, 10:581 https://doi.org/10.12688/f1000research.52903.1

                                                                                                                                  Page 2 of 10
F1000Research 2021, 10:581 Last updated: 01 SEP 2021
Introduction
In the wood industry, each step of the manufacturing process affects material utilization and cost efficiency.1 The
heterogeneity of wood material with the complexity of these manufacturing processes may result in various defects,
which not only degrade the mechanical properties of the wood such as the strength and stiffness but also reduce its
aesthetic value.2 These mechanical and aesthetical defects have furthermore a large impact on the commercial value of the
wood and can diminish the utilization of such materials for further processing. There are many various types of defects
arising from many different causes. The major wood defects include knots, fungal damage, cracks, warping, slanting,
wormholes, and pitch defects. The seriousness of a defect, and therefore the grade and the cost of the material, is primarily
determined by four criteria, including the size, location, type of the defect, and the purpose for which the wooden product
will be used.3,4
Even though the automation in this industrial sector is growing, many market leader companies still utilize trained domain
experts to detect undesirable features and to perform quality grading.5 Besides the fact that the manual examination is
tedious and biased, it was found that domain experts are not able to check large production volumes. Moreover, the study
conducted by Urbonas et al.6 stated that due to factors such as eye fatigue or distraction, manual inspection rarely achieves
70 % reliability. To overcome the drawbacks of the manual examination, researchers try to develop automated systems,
which are accurate and won't slow down the manufacturing process. According to the repeatability and quality of the
inspection, the study performed by Lycken7 has already proved that automatic systems slightly outperformed human
graders. Most of these systems were based on conventional image processing techniques in combination with supervised
learning algorithms, however, over the last decade deep learning has achieved remarkable success in the forestry and
wood products industry.8 Although researchers in the field were able to achieve satisfying results with the average
recognition rate above 90 %,9 most of the authors worked with small-scale image datasets obtained in laboratory
conditions by using self-developed vision system setups. Performing experiments in such conditions usually entails the
disadvantage of a limited number of available products. In most of the studies,2,6,10,11 researchers compensate for the lack
of real products by using data augmentation techniques, which can expand the dataset up to 10 times its original size.
From one point of view, data augmentation is considered to be an excellent tool to generalize the classification model and
therefore prevent overfitting.12 Nonetheless, it cannot ensure that the variability of the observed phenomenon will be
sufficiently captured, especially in cases where the variability might be limitless.
In order to address the lack of extensive databases in the field, we performed an experiment with the goal to acquire a
large-scale dataset of timber surface defects. Unlike other conducted studies, our experiment was placed in an industrial
environment during real production, which allowed us to acquire a large amount of authentic data from the production
line. To face the challenges arising from the manufacturing process, such as the high speed of the conveyor belt and heavy
vibrations, we designed hardware as well as a software solution, which enabled acquisition of high-resolution images at
the acquisition rate of 66 kHz. In this experiment, we acquire 20 276 original data samples of sawn timber surface, from
which 1 992 images were without any surface defects, and 18 284 images captured one or more defects covering overall
10 types of common wood surface defects. The most frequent defects include live knots and dead knots, with an overall
occurrence in the dataset of 58.8 % and 41.2 %, respectively. Furthermore, to provide more valuable information in this
data descriptor, all dataset samples were complemented with two types of labels: a semantic label map for the semantic
segmentation and a bounding box label.
Methods
Due to the industrial environment where the experiment was set, the most challenging part of this work was the dataset
acquisition. Performing data acquisition in such an environment entailed several negative factors. One of those factors
was that the sawmill production line utilized for this experiment is used for more than 300 days per year, with minimal
pauses, which maximizes the manufacturer's profits. Also, we had to deal with the high speed of the sawmill conveyor
belt, which reached a value of 9.6 m s1 at the place of the acquisition. This high speed of the conveyor causes constant
heavy vibrations that in some peaks may result in fluctuations that are even centimetres in length. The main goal of
the technical solution was therefore to create a robust and at the same time portable construction, which can be easily
implemented in the sawmill environment.
Acquisition equipment
To overcome the limitation of this environment, we developed a mechanical construction for carrying the camera and
the light source. The final construction assembled from ITEM aluminium profiles was at the place of the acquisition fixed
to the production line construction and the floor, which helped to avoid the acquisition of blurry images. Although this
solution didn’t deal directly with heavy vibrations, it ensured the harmonization of the conveyor vibrations with the
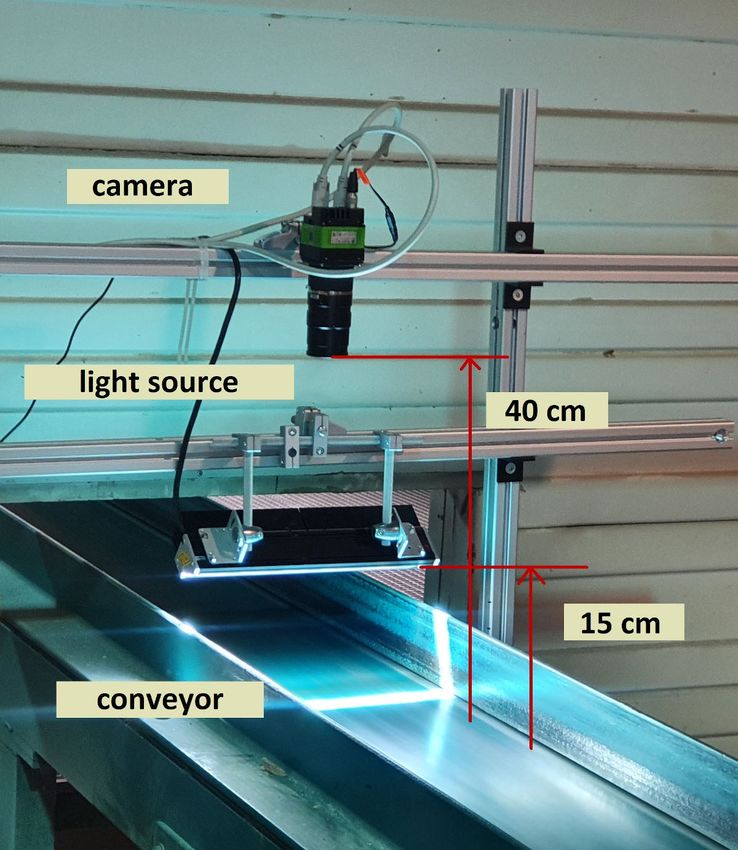
mounted camera. The final mechanical solution implemented in the sawmill environment is demonstrated in Figure 1.
Page 3 of 10F1000Research 2021, 10:581 Last updated: 01 SEP 2021
Figure 1. The mechanical construction, including the mounted camera and light source. The distance between
the line scan camera and the light source from the conveyor belt is 40 and 15 centimetres, respectively.
In order to obtain high-quality images at a speed of 9.6 m s1, a trilinear line scan camera SW-4000TL-PMCL
manufactured by JAI was chosen. This camera was able to acquire 3 4096 pixels per line at the speed of 66 kHz.
The required speed of the image acquisition was achieved by connecting the camera interface to a high-performance
Camera Link frame grabber with the transfer speed parameter set to 10 tap mode. For this application, we selected the
Silicon Software microEnable five marathon VCLx frame grabber with a PCIe interface that allows on-board high-speed
data processing and high data throughput up to 1800 MB s1. The required field of view, which obtains a part of the sawn
timber piece, with a width of 15 cm and the full length of 500 cm was achieved by using the Kowa LM50LF line scan
camera lens. The selected camera, together with a 50 mm focal length lens placed at a distance of 40 cm from the measured
object, led to a horizontal resolution of 16.66 pixels per millimetre. The vertical resolution Rv of the image was computed
before the experiment by the following formula.
1
Rv ¼ vw ∗L (1)
60
vc
where vw is the velocity of the conveyor, L is the number of lines per image, and vc is the line rate of the camera. The
resulting vertical resolution of 6.67 pixels per millimeter was afterward experimentally verified during the acquisition
process.
Since the shutter of the camera was set to 3 μs to ensure the high-speed image acquisition, we had to use a powerful
light source, which would sufficiently illuminate the desired field of view. For this purpose, we selected one of the
most powerful light sources on the market, a linear LED light Corona II by Chromasens with the ability to provide a
light intensity of 3.5 million lux. To achieve the best possible images, a white spectrum of the light was utilized.
Page 4 of 10F1000Research 2021, 10:581 Last updated: 01 SEP 2021
Data acquisition
Instead of saving every single line during the acquisition process, we captured a block of 1024 lines, which resulted
in an image resolution of 10244096. Such a high-resolution color image takes up approximately 12 MB of disk space.
The used sampling frequency of 66 kHz with the total number of captured pixels resulted in a data transfer speed of
773 MB s1, which means that we were able to capture 66.4 images per second. Even though we used a very powerful
computer, we found the process of saving this amount of data at such a high speed quite challenging. To overcome this
challenging task, we had to separate image acquisition and image saving into two separate processes. While the
acquisition process consisted of capturing a set of 84 images with a subsequent saving into the PC's RAM, the only
task of the saving process was the transfer of the images from the computer RAM to the local hard disk drive. For this
experiment, we employed two external 1 TB hard drives. To save CPU time during the acquisition and saving process, no
online processing was performed.
Because transferring such a large amount of data between different software have a negative impact on CPU utilization
and would decrease the frame rate, we used optimized frame grabber software, microDisplay X (runtime version 5.7)
from Silicon Software.13 To use this software in an automated way, we developed an automatic clicker with a feedback
loop based on the captured computer screen. In simple terms, the software reads the desired information from the screen
and based on the information decides whether the acquisition or saving process is already completed. Additionally, it
automatically assigns an incrementing filename to each captured image. This was mainly realized by using Windows
library user32.dll, which allows the control of various aspects of mouse motion and button clicking. Since the saving
process (loop) is almost 10 times slower than the acquisition process, the acquisition loop had to be temporarily stopped in
each cycle. Despite the fact that this causes loss of the data continuity, it does not affect the study validity and reliability.
We assumed that the acquisition process with the other support subroutines takes approximately 1.4 s while the saving
process lasts 7.5 s. To maintain a predictable acquisition speed, including software delays, we introduced synchroniza-
tion, which started a new cycle every 9 s.
Data processing
During four hours of acquisition, 60 480 images were acquired overall. Due to the limited third-party software
functionality, the acquisition process had to be performed in a continuous mode, without any triggering option. This
resulted in a large number of images of an empty conveyor or partly captured wood surface. To filter these meaningless
data from the dataset, an offline histogram-based algorithm was created. The basic idea behind this algorithm is the sum
calculation of the image green color space histogram. This sum value of the histogram can be in the next step divided by
any number from the range of 5 to 10 (values in the range were deduced from the size of the images). The last step of the
algorithm is based on a simple threshold, where all images with a resulting value of less than 10 were removed. Using this
value of threshold ensured that only images that contained in the horizontal direction at least 40 % of the wood surface
were kept. Since this filtration approach proved 100 % reliable in successfully filtering images with no wooden surface
on 1500 randomly selected and manually sorted samples, we applied this filtering algorithm on the whole dataset. The
filtering process reduced the dataset to a final number of 20 275 images.
Additionally, besides the filtration, we performed image cropping to remove the undesirable background from the
images. This operation not only reduced the file size but also decreased the potential computation time for future use.
To automatically crop each image in the dataset without any relevant data loss, we employed a simple straight-line edge
detection technique in a vertical direction. Basically, the main principle of the algorithm is finding as many raising
edge points in the desired direction as are needed to construct a line. The cropping operation was then performed on the
image bounding box derived from the following formula.
Lx1 þ Lx2 Lx þ Lx2
BBðx1 , y1 ,x2 ,y2 Þ ¼ 150,Ly1 , 1 þ 2650, Ly2 (2)
2 2
where BBðx1 ,y1 , x2 ,y2 Þ is the cropped bounding box, and Lx1 y2 x1 y2 stands for the image coordinates of the detected straight
edge. Cropping the image, changed the image resolution to 2800 1024, and reduced the overall dataset size by almost
80 GB. An example of the image after the image crop operation is demonstrated in Figure 2.
Ground truth labelling
The dataset annotation in this study was performed manually by a trained person. To accelerate this time-consuming
process, we developed a customizable annotation tool. In comparison with other annotation tools available on the market,
which didn’t fulfil our requirements, we created a universal application with the ability to manage bounding box labels, as
well as labels for the semantic segmentation at the same time.14
Page 5 of 10F1000Research 2021, 10:581 Last updated: 01 SEP 2021
Figure 2. A dataset example of a sawn timber surface with dead knots.
Table 1. Wood surface defects included in the database with the number of particular occurrences and an
overall occurrence within the dataset.
Defect type Number of Number of images Overall occurrence in the
occurrences with the defect dataset [%]
Live knot 21 224 11 912 58.8
Dead knot 11 985 8 350 41.2
Knot with crack 2 276 1 835 9.1
Crack 2 169 1 578 7.8
Resin 3 455 2 624 12.9
Marrow 1 181 1 060 5.2
Quartzity 1 075 847 4,2
Knot missing 503 478 2.4
Blue stain 96 77 0.4
Overgrown 10 6 0.03
For every single image, we created a BMP file representing a semantic map of the labeled defects. During the labeling
process, the user manually painted zones in a displayed image, where each zone drawn with a selected color represents a
specific defect. Each drawn zone was then automatically bounded with a zone of the particular label and a bounding
rectangle. From the created zones, the tool automatically generated coordinates (left, top, right, bottom respectively) in
the form of percent divided by 100, where a certain defect is located. For each processed image from the dataset, the
annotation tool therefore created a text file including labels and bounding box coordinates and a semantic segmentation
map with the configured color labels.
Data records
The dataset containing the data acquired in this experiment is publicly available.15 The dataset includes 1 992 images of
sawn timbers without any defects and 18 283 timber images with one or more surface defects. On average, there are 2.2
defects per image, while only 6.7 % of images contain more than three defects. The highest occurrence of defects, which
was captured during the experiment, was 16 defects per image. In this dataset, we present altogether 10 types of wood
surface defects, including several types of knots, cracks, blue stains, resins, or marrows. An overall overview of all
available wood surface defects with a number of occurrences is summarized in Table 1.
Each colour image with a resolution of 28001024 is provided in a BMP format in 10 separated zip folders labelled as
Images.15 Additionally, we provide two types of annotations, semantic label maps, and bounding box labels. Both labels
are provided in separate zip folders. The bounding box labels are located in a folder Bounding_Boxes and named as
imagenumber_anno.txt, where the image number corresponds to the name of the original image in the dataset. Each
original image has therefore one assigned text file, which can have multiple label records for each defect in the image. All
bounding box labels have the following structure, where the first record represents the object label, and the subsequent
values correspond to left, top, bottom, and right absolute positions of the defect in the image divided by 100.
Knot_OK 0, 421786 0,819336 0,571429 1, 000000
Page 6 of 10F1000Research 2021, 10:581 Last updated: 01 SEP 2021
Figure 3. Example of a semantic segmentation label. The red label represents dead knots, the green label stands
for live knots, and the dark yellow represents knots with cracks.
Table 2. Annotation colour specification for the provided dataset with hexadecimal colour codes.
Defect type Colour HEX colour code
Live knot Green 00FF00
Dead knot Red FF0000
Knot with crack Dark Yellow FFAF00
Crack Pink FF0064
Resin Magenta FF00FF
Marrow Blue 0000FF
Quartzity Purple 640064
Knot missing Orange FF6400
Blue stain Cyan 10FFFF
Overgrown Dark Green 004000
Semantic label maps, used for semantic segmentation, are located in a folder, Semantic Maps. For each image in the
dataset there exists just one semantic map in a BMP format with the label name in the form of imagenumber_segm.bmp,
where the image number represents the corresponding name of the original image. In comparison to bounding box labels,
each pixel of the semantic map image has its label, which is determined by a specified colour (see Figure 3).
To see the exact label specification for the provided wood surface defect dataset, refer to Semantic Map Specification text
file,15 or Table 2.
Technical validation
The technical validation of the dataset was conducted by assessing the quality of the assigned labels by employing
deep learning-based classification. For this purpose, we utilized a standard state-of-the-art Convolution neural network
detector based on the ResNet-50 model.16 The selected neural network architecture was modified by adding Batch
Normalization and ReLu layers after each convolution layer. The input layer of the network, and therefore all dataset
images were downsampled to 1024357. To train the neural network, we employed a transfer learning paradigm using
pre-trained weights from the COCO dataset.17 Moreover, we performed data augmentation, including horizontal, vertical
flip, translation and scaling, and divided the dataset into training and testing set in a conventional ratio of 40/60. To
increase the detection of the labelled defects by the ResNet-50 model, several parameters were additionally modified on
the basis of the trial-and-error process. These included sizes, strides, ratios and scales (see Table 3).
At the beginning of the training, the first four layers of the network were frozen. After freezing the layers, the neural
network was tuned by unfreezing the layers in a reverse order except for the Batch Normalization layer. The whole neural
network was then finally fine-tuned at a low training speed. The overall number of epochs during the training was
30, while the training speed ranged between 10-4 at the beginning and 10-6 at the end of the training.
The trained ResNet-50 model resulted in an accuracy of 81 %. Since the neural network output a large number of false
positives, the dataset was re-evaluated by a trained person who didn’t participate in the primary dataset labelling process.
Page 7 of 10F1000Research 2021, 10:581 Last updated: 01 SEP 2021
Table 3. A detailed specification of the modified neural network parameters.
Parameter Values
Sizes [32, 64, 128, 256, 512]
Strides [8, 16, 32, 64, 12]
Ratios [0.3, 0.55, 1, 2, 3.5]
Scales [0.6, 0.8, 1]
Data availability
Underlying data
Zenodo: Underlying data for A large-scale image dataset of wood surface defects for automated vision-based quality
control processes. ‘Deep Learning and Machine Vision based approaches for automated wood defect detection and
quality control’. http://doi.org/10.5281/zenodo.4694695.15
This project contains the following underlying data:
• Bounding boxes
• Images 1–10
• Semantic map specification
• Semantic maps
Data are available under the terms of the Creative Commons Attribution 4.0 International Public License (CC-BY 4.0).
Software availability
Zenodo: Software for labeling wood surface defects and managing images. ‘Supporting tools for managing and labeling
raw wood defect images’. http://doi.org/10.5281/zenodo.4904736.14
This project contains the following underlying data:
Labeler tool:
SubVI
• Labeler_software.vi
• Readme.txt
• Labeler.ini
Support Utils:
• Cutter.vi
• Sorter.vi
Data are available under the terms of the Creative Commons Attribution 4.0 International Public License (CC-BY 4.0).
Page 8 of 10F1000Research 2021, 10:581 Last updated: 01 SEP 2021
References
1. Broman O, Fredriksson M: Wood material features and technical 9. Kryl M, Danys L, Jaros R, et al.: Wood recognition and quality
defects that affect yield in a finger joint production process. imaging inspection systems. J. Sens. 2020; 2020.
Wood Mater. Sci. Eng. 2012. Publisher Full Text
Publisher Full Text 10. He T, Liu Y, Xu C, et al.: A Fully Convolutional Neural Network for
2. Ding F, Zhuang Z, Liu Y, et al. : Detecting defects on solid wood Wood Defect Location and Identification. IEEE Access. 2019.
panels based on an improved SSD algorithm. Sensors. 2020. Publisher Full Text
PubMed Abstract|Publisher Full Text|Free Full Text 11. Gao M, Chen J, Mu H, et al.: A Transfer Residual Neural Network
3. Prokhorov M: Great Soviet Encyclopedia: A Translation of the Third Based on ResNet-34 for Detection of Wood Knot Defects. Forests.
Edition. New York: Collier Macmillan Publishers; 1973. 2021; 12.
4. Çetiner I, Var AA, Çetiner H: Wood surface analysis with image Publisher Full Text
processing technique. 22nd Signal Processing and Communications 12. Jackson PTG, Amir A-A, Bonner S: Style augmentation: data
Applications Conference (SIU). 2014. augmentation via style randomization. Proceedings of the IEEE/
Publisher Full Text CVF Conference on Computer Vision and Pattern Recognition. 2019.
5. Gu IYH, Andersson H, Vicen R: Automatic classification of 13. Basler AG: microDisplay X – The Reliable Path to Your First Image:
wood defects using support vector machines. In: Bolc L, Basler. Basler AG. 2021, May 28.
Kulikowski JL, Wojciechowski K, editors. Lecture Notes in Reference Source
Computer Science. Berlin: Springer Science+Business Media; 2009. 14. Kodytek P, Bodzas A: Supporting tools for managing and labeling
p. 356–367. raw wood defect images. Zenodo. 2021.
6. ˉ nas R, et al.: Automated
Urbonas A, Raudonis V, Maskeliu Publisher Full Text
identification of wood veneer surface defects using faster 15. Kodytek P, Bodzas A, Bilik P: Supporting data for Deep Learning
region-based convolutional neural network with data and Machine Vision based approaches for automated wood
augmentation and transfer learning. Appl. Sci. 2019. defect detection and quality control. Zenodo. Dataset. 2021.
Publisher Full Text Publisher Full Text
7. Lycken A: Comparison between automatic and manual quality 16. He K, Zhang X, Ren S, et al.: Deep Residual Learning for Image
grading of sawn softwood. Forest Prod. J. 2006; 56: 13–18. Recognition. 2016 IEEE Conference on Computer Vision and Pattern
8. Liu Z, Peng C, Work T, et al.: Application of machine-learning Recognition (CVPR). 2016.
methods in forest ecology: Recent progress and future Publisher Full Text
challenges. Environmental Reviews. 2018; 26. 17. Lin T, Maire M, Belongie S, et al.: Microsoft COCO: Common objects
Publisher Full Text in context. ECCV. 2014.
Page 9 of 10F1000Research 2021, 10:581 Last updated: 01 SEP 2021
The benefits of publishing with F1000Research:
• Your article is published within days, with no editorial bias
• You can publish traditional articles, null/negative results, case reports, data notes and more
• The peer review process is transparent and collaborative
• Your article is indexed in PubMed after passing peer review
• Dedicated customer support at every stage
For pre-submission enquiries, contact research@f1000.com
Page 10 of 10You can also read