Michigan Wind Energy Potential, 2006-2020: MREP/WWG1 Input for MPSC Capacity Need Forum - State of Michigan
←
→
Page content transcription
If your browser does not render page correctly, please read the page content below
Michigan Wind Energy Potential, 2006-2020                                                      Page 1
D-R-A-F-T … NOT FOR CITATION OR QUOTATION

          Michigan Wind Energy Potential, 2006-2020:
        MREP/WWG1 Input for MPSC Capacity Need Forum
       D-R-A-F-T               Not for Quotation or Citation                   June 14, 2005

Introduction

In its October 14, 2004 Order in Case No. U-14231, the Michigan Public Service Commission
(MPSC or Commission) commenced “an investigation into the present and future capabilities
of Michigan’s electric power system to supply adequate levels of this key product at a
reasonable price…” (Order, p. 3). The Commission directed its Staff “to work in conjunction
with representatives of the electric power industry and other interested parties to…[p]ropose
membership in a Capacity Need Forum (CNF) to be approved by the Commission… to review
data and advise the Commission on resource addition policy matters” (Order, p. 4). Specific
questions raised in the Commission Order included:

    1. The anticipated short-, intermediate-, and long-term demand for power.
    2. An analysis of the ability to meet projected demands from existing resources.
    3. If additional resources are needed, an analysis of the potential resource options that are
       available within each of the timeframes, including, but not necessarily limited to: (a)
       technical considerations relevant to various options; (b) anticipated capital and
       operating costs; (c) relevant financing, ownership, and organizational considerations;
       (d) risks associated with various options; and (e) a discussion of any synergistic effects
       or the extent to which the choice of some options may enhance or foreclose others.
    4. Recommendations. (Order, p. 4).

In reviewing the scope of power supply and demand-management options to be investigated
through the CNF, the Commission stated:

                “The Commission is aware that alternative sources of generation capacity, such
       as qualifying facilities, merchant plants, and distributed generation must be considered
       in addition to the more traditional sources of supply provided by the state’s public
       utilities. It is not starting this proceeding with the assumption that the future
       construction of base-load generation is the only solution to future resource shortfalls.
       The Staff should ensure that renewable resources and everyday efficiency measures are
       included in the investigation of the need for additional capacity. The work done by the
       Staff and others pursuant to the orders issued in Cases Nos. U-12915 and U-13843,
       which implement the legislative mandate set forth in MCL 460.10b(1) and MCL
       460.10r(6) to promote renewable resource generation facilities, is exemplary and should
       be incorporated into the investigation. Given that the focus of the investigation is

1
 MREP is the Michigan Renewable Energy Program. WWG is the Michigan Wind Working Group, which is the
MREP Wind Energy Committee. Representatives from MREP and WWG are participants in the Michigan Public
Service Commission Capacity Need Forum, Other Generation Workgroup.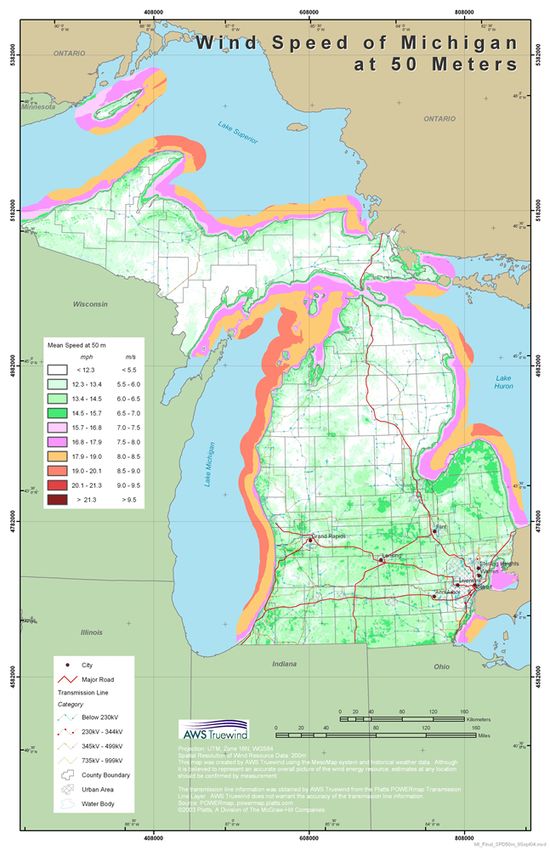
Michigan Wind Energy Potential, 2006-2020 Page 2
D-R-A-F-T … NOT FOR CITATION OR QUOTATION
broader in scope than renewable resources, the previous Staff work related to renewable
resources may be supplemented, but it need not be duplicated.” (Order, p. 5).2
The purpose of this paper is to present estimates of Michigan’s potential for wind energy
resource development over the next 15 years, based on assessments made by participants in the
Michigan Renewable Energy Program (MREP) Collaborative which has been established in
response to the Commission’s May 16, 2002 and May 18, 2004 Orders in Case No. U 12915.3
Basic Data on Michigan Wind Energy Availability
Information on the estimated availability of wind energy in Michigan was developed for
Michigan’s Wind Working Group4 in 2004 and early 2005, under a program sponsored by the
U.S. Department of Energy, with the assistance of experts at the National Renewable Energy
Laboratory (NREL) and with the financial support of Michigan’s State Energy Office.5
The first major step in analyzing Michigan wind energy potential for this study was the
production of new wind maps for Michigan. Maps of Michigan wind speed and wind power
density were developed by AWS Truewind.6 New maps of Michigan wind speed and wind
power density measured at 50 meters above the surface were validated by NREL experts.7
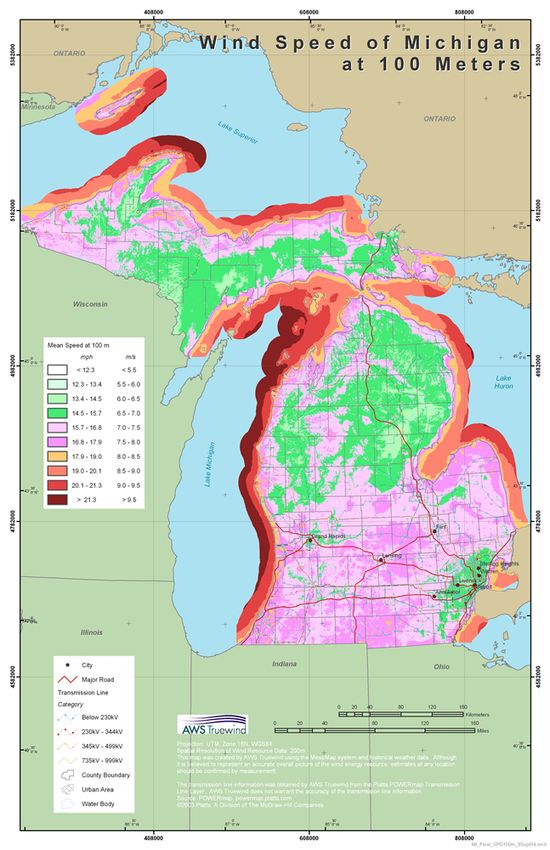
Figures 1 and 2 are examples of the kinds of maps that were developed in this effort. Figure 1
shows wind speed estimates at 50 meters and Figure 2 shows unvalidated estimates of wind
speed at 100 meters.
2
Information on the Capacity Need Forum, including the October 14, 2004 Order in Case No. U-14231, is
available on the Commission’s Web site at http://www.cis.state.mi.us/mpsc/electric/capacity/cnf/.
3
Information on the Michigan Renewable Energy Program, including Orders in Case No. U-12915, is available on
the Commission’s Web site at http://www.michigan.gov/mrep.
4
The Michigan Wind Working Group (WWG) was first organized in fall 2002 under the auspices of the state
energy office. WWG participation is open to any interested party, and the group serves as MREP’s Wind
Committee. The WWG promotes wind energy development by providing a forum for the exchange of information,
creating the opportunity for members to discuss and develop joint projects, helping increase consumer awareness
about wind energy potential, identifying barriers and opportunities related to the development of wind energy, and
making policy recommendations. See http://www.michigan.gov/eorenew.
5
A majority of the work involved in developing this Michigan wind energy potential study was completed by staff
from the National Renewable Energy Laboratory, in response to specific information requests from the Michigan
Wind Working Group and Capacity Need Forum. Major contributors from NREL included Dennis Elliott,
Lawrence Flowers, and Donna Heimiller, whose assistance is greatly appreciated.
6
See http://www.awstruewind.com/.
7
The maps provide wind resource estimates, based primarily on computer modeling using the MesoMap system; a
numerical weather model which simulates the physics of the atmosphere. Also a wind flow model is used to refine
the spatial resolution and account for localized effects of terrain and surface roughness. The maps of wind speed
and power at 50-meters were validated by the National Renewable Energy Laboratory using data from over 90
wind measurement stations in Michigan; e.g. 35 airports, 20 Coast Guard stations, and other both public and
proprietary data sources.
These maps are intended to be suggestive of areas that may be suitable for wind generators. Values represented
may differ from actual conditions at any specific location. Although the maps are believed to accurately portray
general information about Michigan wind energy, estimates for particular locations should be confirmed by on-site
measurements, before purchase or installation of any wind power system. (continued on next page)
See Elliott, D. and Schwartz, M. (2002, May). Validation of New Wind Resource Maps. Golden, CO: National
Renewable Energy Laboratory, NREL/CP-500-32536; http://www.nrel.gov/docs/fy02osti/32536.pdf.Michigan Wind Energy Potential, 2006-2020 Page 3 D-R-A-F-T … NOT FOR CITATION OR QUOTATION The next steps, completed by NREL staff, included using geographic information systems to identify and calculate the area, measured in square kilometers, of onshore land and nearby offshore areas for each wind power class, for each of the three Michigan regions being evaluated by the CNF.8 Specific assumptions were made about land and offshore areas to be excluded from analysis.9 The areas that remained after removing exclusions were tabulated, and those results are shown for onshore areas in Table 2 and offshore in Table 3. Once those land area estimates were completed, then wind generation capacity estimates (measured in nameplate MW) were separately calculated for the onshore and offshore areas not excluded, based on the generally conservative assumption that 5 MW of wind generator nameplate capacity could be installed, per square kilometer.10 The results of these calculations are presented for onshore areas in Table 4 and offshore in Table 5. In the final steps needed to complete this analysis, members of the MREP Collaborative, WWG, and CNF Other Generation Committee reviewed all of the data presented in Tables 2 through 5, and made estimates of Michigan wind energy development potential for 2006 through 2020. Those estimates, presented in Table 6, were guided by a series of assumptions, which are explained in the following paragraphs. Economics of Wind Energy Production A few assumptions are based on ideas about the economics of wind energy production. These include: (1) minimum size developments to achieve economies of scale in production; (2) minimum wind speed requirements; and (3) the eventual emergence of viable wind energy storage technologies. 8 These three regions are: (1) Southeast Michigan and the Thumb area, most of which is served by the International Transmission Company (ITC) and generally coinciding with the Detroit Edison Company service territory; (2) the rest of Michigan’s Lower Peninsula, most of which is served by the Michigan Electric Transmission Company (METC) and generally coinciding with the Consumers Energy Company service territory; and (3) Michigan’s Upper Peninsula, most of which is served by the American Transmission Company (ATC). 9 The assumptions about exclusions are reviewed in detail, beginning on page 6. 10 Include conversion factor between km2 and square miles (mi2) to help readers understand: One square kilometer equals X square miles, or one square mile equals XX square kilometers. Thus, the estimate of wind generating potential used is approximately Y MW/mi2.
Michigan Wind Energy Potential, 2006-2020                                                                              Page 4
D-R-A-F-T … NOT FOR CITATION OR QUOTATION

Figure 1: Validated Wind Speed of Michigan at 50 Meters   Figure 2: Unvalidated Wind Speed of Michigan at 100 Meters
Michigan Wind Energy Potential, 2006-2020                                                                     Page 5
D-R-A-F-T … NOT FOR CITATION OR QUOTATION

A first assumption is that developers need to install several wind generators in a single project
(typically called a wind farm), in order to spread certain fixed costs across multiple units; to
achieve economies of scale in development, construction, operations and maintenance. For
wind farms in Michigan, the result is a need to develop facilities equal to at least 25-35 MW in
any given project. Greater economies will accrue to even larger developments, but 25-35 MW
appears to be a reasonable lower boundary. This assumption translates into minimum estimates
in the early years being analyzed by the CNF (see Table 6, p. 14). For example, the low
(25 MW) and base case (50 MW) estimates for Southeast Michigan, 2006-2010, represent
development of one or two wind farms.

A second assumption involves estimates of the lowest average wind speeds that can support
wind farm developments. Given today’s utility-scale wind generator technology, viable
developments in Michigan are expected to require contiguous or near-contiguous areas large
enough to support a minimum of roughly 20 or more generators, where wind speeds will be
classified as Class 4 or better, or near Class 4.11 It is expected that continued progress in wind
turbine design and engineering will gradually improve performance. Future wind generators are
being developed with the intent of extracting more useful energy from lower speed winds.
Thus, by 2011, it is likely that areas with Class 3 winds will also be economically feasible for
development.

In reviewing the data that forms the basis for the MREP wind estimates, however, it should be
noted that utility scale wind generators may already employ tower heights in excess of 50
meters. It is generally understood that for onshore installations, wind power increases as the
hub height and rotor diameter increase. Therefore, prospectors are likely to identify areas with
better wind resources at somewhat higher elevations. Many areas identified as class 2 or 3 on
the 50 meter map may yield class 3 or 4 winds higher above the ground. To some extent, this
factor can be observed by comparing the 50 and 100 meter maps that have been developed for
Michigan (see Figures 1 and 2 on page X).12

A third basic assumption is that augmenting wind or other variable output electric generating
technologies by the use of energy storage technologies is not presently economical for utility
scale wind generators. Many technologies are being explored to enable economical storage of
electricity, and it is expected that at least some of those technologies may become viable during
the 15-year time horizon being investigated by the Capacity Need Forum. Storage technologies
were not considered in this assessment for utility scale wind systems, however. This subject
should be revisited in the not-too-distant future, though. As storage technologies improve, the
economics of wind generation and its value to the utility system could change markedly.

Finally, the economics of utility-scale wind developments have been estimated by MREP,
based on preliminary information. It is expected that more and better information on these
resource costs in Michigan will become available in the coming months, as Consumers Energy
and Detroit Edison embark on their new and expanded renewable energy programs. In the

11
   Near Class 4 may also be referred to as high Class 3. Where Class 3 winds average X mph and Class 4 Y, the
threshold for economic viability of utility scale wind generators in Michigan is estimated at about Z mph. +++
12
   The reader should bear in mind that the 100 meter map (Figure 2) was developed by applying algorithms to
project wind speed at higher elevations. It has not yet been validated through actual data collection and reporting.
Michigan Wind Energy Potential, 2006-2020                                                                Page 6
D-R-A-F-T … NOT FOR CITATION OR QUOTATION

meantime, however, MREP has developed estimated supply curves based on generally
accepted rules of thumb and preliminary wind power data. Those preliminary supply curves are
presented in Figures 3, 4, and 5, on page X.

=============== ============= ============= ============ ==========

Insert about here: Figures 3, 4, and 5, the supply curves for low, base case, and high penetration
scenarios. This will take 1 or two pages, I expect. We need a quick calculation from Don Johns
and/or one or more of the wind developers to lay out the basic economics. We can use the DOE
online software for building a sample economic case to form the baseline. Kurt Guter used the
DOE program in preparing his testimonty for U-13843, as I recall.

=============== ============= ============= ============ ==========

Exclusions Used in Estimating Wind Energy Production
Estimates of wind energy potential based on statewide wind resource modeling indicate the
upper bounds of what might be developed, given no competing land use or technological
constraints. Estimates of the developable potential, however, must take into consideration a
variety of both technical and political exclusions. The following paragraphs review the
exclusions used in developing the wind production estimates presented in this report.

Exclusions for Onshore Wind Energy Production

As NREL staff estimate wind energy potential, they use data from various Geographic
Information System (GIS) databases, and exclude various lands from consideration for wind
energy development. Generally speaking, exclusions are based on environmental concerns and
competing land uses. NREL’s analysis excluded from consideration:

     1. All lands managed by the National Park Service and Fish and Wildlife Service,
        including 3 km surrounding buffer areas;
     2. All federal lands designated as parks, wilderness, wilderness study areas, national
        monuments, national battlefields, recreation areas, national conservation areas, wildlife
        refuges, wildlife areas or wild and scenic rivers, including 3 km surrounding buffer
        areas;
     3. All state and private lands that are equivalent to those first two classification types,
        where GIS data is available to indicate those land use types, including 3 km surrounding
        buffer areas;13
     4. One-half of all remaining U.S. Department of Agriculture Forest Service lands,
        including National Grasslands, that are not already classified in one of the first two
        types;
     5. One-half of all remaining Department of Defense lands that are not already classified in
        one of the first two types;

13
 NREL indicates it did not have access to Michigan GIS data to identify these land uses when the preliminary
Michigan wind assessments were completed.
Michigan Wind Energy Potential, 2006-2020 Page 7
D-R-A-F-T … NOT FOR CITATION OR QUOTATION
6. One-half of all state forest land, where GIS data is available;13
7. One-half of all forest lands that are not ridge-crests;
8. All airfields, including a 3 km surrounding buffer area;14
9. All urban land, all wetlands, and all inland water areas, including a 3 km surrounding
buffer area;15
10. All areas where the slope of the land exceeds 20 percent; and
11. Exclude small resource areas, where there is not a density of at least 5 km2 of Class 3 or
better resources within the surrounding 100 km2 area.
As an additional conservatism for the purposes of the estimates provided to the CNF, MREP
assumed that no more than about one half of the land areas identified by NREL will be
available for development in 2006-2010, due to additional exclusions not yet identified by
NREL (e.g., viewshed issues, other competing land uses, local community judgment, etc.).
On the other hand, it should be noted that the NREL estimates are based on computer modeling
of the entire state. There are bound to be some specific sites that have higher wind speeds than
indicated in the current wind maps, especially at tower heights in excess of 50 meters.
Therefore, this analysis assumes that developers will identify some areas where wind
generation can prove economical, in excess of the number of MW identified by NREL. This
assumption is particularly relevant for Southeast Michigan, where NREL estimates there is a
potential for only 13 MW of land area with Class 4 or higher average wind speeds, but the
Midwest ISO Web site already indicates applications for two interconnection studies
representing a total of nearly 200 MW (see p. 9) and developers are already publicly discussing
the potential for as much as 400 MW ().
Exclusions for Offshore Wind Energy Production
NREL based its estimates of Michigan’s offshore wind energy potential on two major
exclusions:
1. All offshore areas less than 5 nautical miles (about 10 km) and more than 10.8 nautical
miles (about 20 km) from shore; and
2. 2/3 of all offshore areas between 5 and 10.8 nautical miles.
Additional overriding assumptions were made by MREP, related to the trajectory and speed of
possible offshore wind energy resource development in Michigan. NREL has identified a very
significant resource potential for Michigan offshore development, but many uncertainties
remain about the viability of developing that resource.16 The MREP assumptions include:
14
The source for airfield identification is a GIS database of airfields and airports from Environmental Systems
Research Institute, Inc. (2003; http://www.esri.org).
15
NREL presently identifies these land-use types using U.S. Geological Survey GIS maps of Land Use and Land
Cover (1993).
16
See Offshore Wind Energy Development in the Great Lakes: A Preliminary Briefing Paper for the Michigan
Renewable Energy Program (April 2005; http://www.michigan.gov/mrep).Michigan Wind Energy Potential, 2006-2020 Page 8
D-R-A-F-T … NOT FOR CITATION OR QUOTATION
3. No significant offshore wind resources will be developed in Michigan waters between
now and 2015;
4. Under a low wind energy production scenario, no significant offshore development will
occur by 2020;
5. Preparatory work on offshore development will continue, so that by 2010 the first
efforts to better evaluate the offshore resources will be undertaken and by 2015 some
experimental offshore generators can be operating;
6. Thus, by 2016, it should be clear whether or not offshore resources are likely to be
developed prior to 2020; and,
7. In the base case and high wind energy production scenarios for 2016-2020, the
obstacles to offshore wind resource development are overcome, so that resources equal
to a small percentage of the total estimated technical potential can be developed;
equivalent to not more than 2 percent of the offshore Class 4+ estimates in the Base
Case and 5 percent in the high production scenario.
Wind Energy Limited to 15% of Regional Capacity
Wind energy should be constrained in CNF modeling, to not exceed 15 percent of the total
capacity in any region. With continuing advances in energy storage options and techniques
employed by utility system operators to integrate larger percentages of variable output electric
generators, it is conceivable that wind energy penetration could grow to exceed 15 percent.
Thus, this assumption should be revisited in the future.17 Presently, however, 15 percent of
Michigan’s statewide electric capacity needs represents approximately 1,000 times more wind
energy than is operating in our state. MREP participants note many important uncertainties
remain about how much wind energy capacity can and will be developed in Michigan, and at
what cost. Therefore, MREP participants do not believe it is unreasonable at this time to
constrain CNF modeling of the next 15 years, based on the assumption that 15 percent
represents an upper limit to the penetration of wind energy in Michigan’s three electric
planning regions.
Small Wind Energy Conversion Systems (SWECS)
Modeled as Demand Reductions
For the purposes of this assessment, SWECS are handled like solar, geothermal, and micro-
hydro technologies: modeled as reductions in demand, rather than as increases to supply.
It is possible that SWECS will make a more substantial contribution to Michigan electric power
supply during the CNF planning period, but for now the market for SWECS is very small,
compared to Michigan’s total capacity requirements. Estimates of the total of currently
installed SWECS in Michigan are in the range of single digits of MW, and at least several of
those installations are for remote facilities that are not interconnected with the electric grid. As
experience is gained with Michigan’s newly established statewide net metering programs, the
17
For example, evidence from Denmark and at least one state in Germany and another in Spain suggests that
utility systems can be successfully operated with upwards of 20 percent penetration of wind energy capacity. See
.Michigan Wind Energy Potential, 2006-2020 Page 9 D-R-A-F-T … NOT FOR CITATION OR QUOTATION issue of the contribution of SWECS may need to be revisited. Some Promising Michigan Wind Sites Are Ready Now for Commercial Development Another important assumption is that there are already a few significant Michigan wind energy developments in advanced stages of planning, permitting, and preparations. At least a couple of developers report they have already completed at least 12 to 24 months of necessary wind monitoring, lined up all of the local government land use approvals, secured land leases, and begun the interconnection processes with the appropriate transmission system operators, to be able to install at least about 200 MW of wind turbines in West Michigan, beginning as early as 2006. One important indicator of wind development progress is that the Midwest ISO’s Web site reports five Michigan projects in its queue for generator interconnection.18 Those requests include two Southeast Michigan (Thumb area) wind developments totaling 194 MW and three in the Western Lower Peninsula totaling 398 MW. Currently, plans are reported to hinge on the ability of developers to secure long-term contracts for the wind electric production, and on the U.S. Congress extending the existing wind energy production tax incentives, which are currently set to expire at the end of December 2005. Thus, MREP participants believe it is realistic to assume as much as a 200-300 MW could be constructed in 2006-2008, depending on market conditions. And, if the market conditions are good enough, soon enough, a similar number might be available for development again in 2008-2010. Basic Assumptions for Low, Base Case, and High Wind Energy Penetration Based on all of the above exclusions and assumptions, MREP participants used their best judgment to develop low, base case, and high wind energy penetration estimates for the coming years, as shown in Table 6 (p. 14). Low Penetration: The low penetration estimates assume that existing barriers to greater market penetration remain. Under this scenario, Michigan developers continue to face obstacles to obtaining long-term contracts for the sale of wind generation, and that in turn limits access to development capital. Michigan markets for utility scale renewable energy production are constrained to premium-priced green rates offered by Michigan utilities, which are not expected to exceed three percent of sales by 2010.19 Neither federal nor state policy changes are adequate to transform Michigan’s renewable energy market. Transmission constraints in the Upper Peninsula and Southeast Michigan continue to limit the possibilities for development in 18 See http://www.midwestiso.org/plan_inter/generator.shtml#. 19 Explain what green rates are. Refer to MREP Web for descriptions and statistics on all existing Michigan utility green rate programs. See http://www.michigan.gov/mrep. Stanton note: be sure to include link from MREP to http://www.eere.energy.gov/greenpower/markets/pricing.shtml.
Michigan Wind Energy Potential, 2006-2020                                                                   Page 10
D-R-A-F-T … NOT FOR CITATION OR QUOTATION

those areas.20

Base case Penetration: In this scenario, some of the major obstacles to greater market
penetration are removed. Developers are able to proceed to bring on much more significant
quantities of wind power, apace with the expectation that wind production can grow at a rate
that equals about X percent of sales growth (measured in MWh) forecast for Southeast
Michigan and the Rest of the Lower Peninsula.21 Production modeled for the U.P. represents a
much larger fraction of sales growth (approximately y percent). The assumption is that
promising wind resources in the U.P. may be developed in part to serve interconnected loads in
neighboring areas. In addition, the Base Case assumes transmission expansions will be
completed as necessary in order for the grid to be able to accommodate all modeled wind
energy resource expansions.

High Penetration: In this scenario, all of the major obstacles to further growth are removed,
and perhaps both federal and state government policies actively encourage greater Michigan
renewable energy development. For example, policy changes might include some version of a
federal or state renewable portfolio standard (RPS) that requires all electricity suppliers to
produce a specific fraction of their supplies using renewable resources. Or, stronger emissions
requirements may be enacted, which include provisions for renewable resources to claim
valuable emissions credits. These are just a couple of examples of policy changes that might
support larger renewable energy contributions in the coming years.22 There may also be
significant technology improvements and other market changes (for example, continued high
fossil fuel costs) that make renewable energy even more attractive as a source of future energy
supply. The point is, under certain conditions the market for renewable energy in Michigan
might grow much more rapidly. This is what the high penetration scenario is intended to
capture. To the extent that all other constraints and exclusions mentioned above are met, in the
high penetration scenario, wind generation would be allowed to grow until it would reach a cap
at 15 percent of each region’s service area capacity.

20
   Transmission system studies will be needed in order to determine the effects of adding wind energy capacity in
areas with constrained transmission capability. New capacity additions in Michigan could at least partially relieve,
rather than exacerbate, existing transmission constraints.
21
   The issue of the appropriate capacity credit value (in MW) that should be modeled for wind generation in
Michigan is one that is being explored through MREP and the CNF. Based on preliminary information about wind
production in Michigan, it is estimated that each 100 MW of wind generation may contribute, for example, only
about 20 MW towards meeting utility system peak capacity requirements. (continued on next page).
   This analysis assumes a capacity factor of 25% for Michigan wind generators. Using that assumption, each
100 MW of new wind generation nameplate capacity will produce 218,750 MWh per year (that is, 100 MW times
8760 hours per year, times 25%).
22
   This analysis does not anticipate adoption of any specific policy changes. Some U.S. states are establishing
flexible supplier portfolio standards that incorporate credits for the deployment of energy efficiency and advanced
generation technologies, in addition to renewable energy resources. Pennsylvania’s recently adopted Advanced
Generation Portfolio Standard includes provisions for both energy efficiency and clean coal technologies, for
example, and similar programs have already been proposed for Illinois and Ohio. Also, portfolio requirements
might apply only to new load growth, rather than all capacity. See .
Michigan Wind Energy Potential, 2006-2020                                                       Page 11
D-R-A-F-T … NOT FOR CITATION OR QUOTATION

Table 1: Summary of Assumptions Used in Michigan Wind Energy Production Estimates, 2006-2020

 1. Utility scale wind production developments proceed in increments of at least 25-35 MW.
 2. Near Class 4 winds are required for economical wind generation, 2006-2010. By 2011, Class 3
     winds are expected to also prove economical.
 3. No more than half of the NREL estimates of onshore potential will be available for development,
     due to state and local land use restrictions.
 4. Offshore wind development will not be practical until at least 2016. There is no offshore wind in
     the case of low wind penetration. For 2016-2020, no more than about 2% of the Class 4+ offshore
     potential is developed in the base case and 5% in the high wind penetration case.
 5. Wind generation capacity is constrained to not more than 15% of regional generation capacity.
 6. Production from small wind energy conversion systems (SWECS) is incorporated in CNF
     modeling as reduced demand, and is not included in this wind production analysis.
 7. 200-400 MW of Michigan wind energy production is already in advanced stages of readiness to
     be developed, as early as 2006-2008, if market obstacles and barriers can be removed in time.
 8. Low wind penetration: The Michigan market continues to struggle under existing obstacles and
     barriers. Therefore, little development occurs beyond that needed to support voluntary, customer-
     driven, green power markets. Voluntary utility green-rate programs will achieve maximum
     penetration rates up to 3 percent of sales volume by 2010.
 9. Base Case wind penetration: Major market obstacles and barriers are removed, including
     transmission constraints. Wind energy penetration grows at about the same rate as regional total
     load growth, about 1-2% per year of regional energy use.
 10. High wind penetration: Major market obstacles and barriers are removed. Federal and/or state
     policies actively promote and encourage wind (and other renewable) energy development. Thus,
     wind penetration can grow until it reaches the limits of either the available wind resources or 15%
     of regional generation capacity, whichever is lower.
Michigan Wind Energy Potential, 2006-2020 Page 12
D-R-A-F-T … NOT FOR CITATION OR QUOTATION
Table 2: Wind Resource Classification of Onshore Michigan Land Areas, After NREL Exclusions
(Reporting Areas in Square Kilometers)
Total Total
Region Class 3 Class 4 Class 5 Class 6 Class 3+ Class 4+
Southeast
Michigan 1492.1 2.5 0.0 0.0 1,494.6 2.5
Rest of
Lower Peninsula 1267.3 91.1 13.6 2.6 1,374.7 107.3
Upper Peninsula 387.4 50.2 5.9 0.0 443.6 56.2
1
Total 3146.8 143.9 19.6 2.7 3,312.9 166.1
Source: Donna Heimiller, National Renewable Energy Laboratory, March 2005.
Notes: 1Totals may not add correctly due to rounding. Total Class 3+ and Total Class 4+
represent the sum of areas classified as having wind resources higher than,
respectively Class 3 or Class 4.
Table 3: Wind Resource Classification of Offshore Michigan Land Areas, After NREL Exclusions
(Reporting Areas in Square Kilometers)
Total2 Total2
Region Class 3 Class 4 Class 5 Class 6 Class 3+ Class 4+
Southeast
Michigan 7 242 2,251 933 3,434 3,427
Rest of
Lower Peninsula 1 33 2,359 6,8633 9,257 9,255
Upper Peninsula 345 1,993 6,395 5,502 14,236 13,891
Total1 353 2,268 11,005 13,298 26,924 26,571
Source: Donna Heimiller, National Renewable Energy Laboratory, March 2005.
Notes: 1Totals may not add correctly due to rounding.
2
Total Class 3+ and Total Class 4+ represent the sum of areas classified as
having wind resources higher than, respectively Class 3 or Class 4.
3
Included with Class 6 data for the Rest of Lower Peninsula are 4 km2 of area
classified as Class 7.Michigan Wind Energy Potential, 2006-2020 Page 13
D-R-A-F-T … NOT FOR CITATION OR QUOTATION
Table 4: Wind Resource Estimates for Onshore Michigan Land Areas, After NREL Exclusions
(Reporting Nameplate Capacity Values in MW)
Total2 Excluded3 Total2 Excluded3
Region Class 3 Class 4 Class 5 Class 6 Class 3+ Class 3+ Class 4+ Class 4+
Southeast
Michigan 7,460 13 0 0 7,473 9% 13 2%
Rest of
Lower Peninsula 6,337 456 68 13 6,873 37% 537 62%
Upper Peninsula 1,937 251 30 0 2,218 59% 281 56%
1
Total 15,734 719 98 13 16,565 32% 831 60%
Source: Donna Heimiller, National Renewable Energy Laboratory, March 2005.
Notes: 1 Totals may not add correctly due to rounding.
2
Total Class 3+ and Total Class 4+ represent the sum of areas classified as having wind resources
higher than, respectively Class 3 or Class 4.
3
Some areas were excluded from consideration, as explained on pages 6-7.
Table 5: Wind Resource Estimates for Offshore Michigan Land Areas, After NREL Exclusions
(Reporting Nameplate Capacity Values in MW)
Total2 Total2
Region Class 3 Class 4 Class 5 Class 6 Class 3+ Class 4+
Southeast
Michigan 12 404 3,751 1,556 5,723 5,711
Rest of
Lower Peninsula 2 55 3,932 11,4393 15,428 15,426
Upper Peninsula 575 3,322 10,658 9,171 23,726 23,151
1
Total 589 3,781 18,341 22,166 44,877 44,288
Source: Donna Heimiller, National Renewable Energy Laboratory, March 2005.
Notes: 1 Totals may not add correctly due to rounding.
2
Total Class 3+ and Total Class 4+ represent the sum of areas classified as
having wind resources higher than, respectively Class 3 or Class 4.
3
Class 6 data for Rest of Lower Peninsula includes 7 MW of Class 7.Michigan Wind Energy Potential, 2006-2020 Page 14
D-R-A-F-T … NOT FOR CITATION OR QUOTATION
Table 6: MREP/CNF Other Generation Committee Estimates
of Michigan Developable Wind Energy Potential, 2006-2020
(Cumulative MW of utility scale development)
2006-2010 2011-2015 2016-2020
Low Base High Low Base High Low Base High1
Region Case Case Case1
Southeast Michigan 25 50 75 75 150 400 225 560 1,100
Rest of Lower 135 270 400 270 540 800 540 1,480 2,250
Peninsula
Upper Peninsula 50 100 150 100 200 300 250 950 1,850
Total 210 420 625 445 890 1,500 1,015 2,990 5,200
1
Notes: For 2016-2020, the base case potential includes approximately 2% and high potential
5% of estimated Class 4+ offshore wind potential identified by NREL. See Table 5.Michigan Wind Energy Potential, 2006-2020 Page 15 D-R-A-F-T … NOT FOR CITATION OR QUOTATION Summary, Conclusions, and Recommendations for Further Research
Michigan Wind Energy Potential, 2006-2020              Page 16
D-R-A-F-T … NOT FOR CITATION OR QUOTATION

References

List here all published references and sources used.

MREP Offshore Briefing Paper, 2005. .
You can also read