Emerging Trends in Shared Services - CFO Forum 27 February & 6 March 2015

Page created by Randy Riley
 
CONTINUE READING
Emerging Trends in Shared Services - CFO Forum 27 February & 6 March 2015
The CFO Program | Japan

Emerging Trends in
Shared Services

CFO Forum 27 February & 6 March 2015
Emerging Trends in Shared Services - CFO Forum 27 February & 6 March 2015
Agenda

Directions of Shared Services and Outsourcing

The Japan Challenge

Looking Forward, Closing Thoughts

Case Studies

Appendices

Contacts

The CFO Program | Japan                         2
Emerging Trends in Shared Services - CFO Forum 27 February & 6 March 2015
Directions of Shared Services &
Outsourcing
Acronym speak

SSC = Shared Service Centre(s)

OS = Outsourcing

COE = Centre of Excellence

BPO = Business Process Outsourcing

GBS = Global Business Services

MNC = Multi-national Companies

JMNC = Japanese MNCs

APAC = Asia Pacific

BRIC = Brazil, Russia, India, China

The CFO Program | Japan               4
Executive Summary (1 of 2)
The SSC and Outsourcing market continues to grow and mature globally….

The 2015 Survey shows that, globally, Shared Services and Outsourcing has continued to mature
and evolve as predicted in previous surveys

The following are they key trends:

•    Maturity of the Service Delivery Model: growth in multi-functional, multi-regional centers - “GBS” - with
     service models blending SSC, CoE, Outsourcing and Retained Organization

•    Maturity of “western” proven locations and evolution of new unproven locations

•    Continued strong evidence of positive impact on cost savings (91% of respondents)

•    Average payback of less than 2.5 years, with average annualized savings of more than 20%

•    The level of transactional processes being moved to SSCs has now peaked

•    The level of outsourcing continues to grow, still focused on transactional processes

    Shared Services and Outsourcing are a globally proven model used to drive significant benefits
                         and process improvements for most organizations
The CFO Program | Japan                                                                                          5
Executive Summary (2 of 2)
….and Japan is no longer considered an exception

We now have evidence that Japan is no longer considered an exception – organizations are now
asking “when, where and how”, rather than “if”:

•    Well-known challenges remain e.g. language, culture, resource changes

•    However, JMNCs and MNCs operating in Japan / APAC, are actively looking to include, expand and
     optimize Japanese operations into existing or new SSC / Outsourcing models – often Japan being the
     final major market to go live with the model. Labor arbitrage of up to 50% can be achieved through
     offshore locations.

•    Regionalization and globalization of operations, amongst other factors, is creating a more favorable
     picture

•    Increase in evidence of onshore SSC serving Japanese operations

Let us now analyze and discuss the trends and Japan challenges in more detail – we welcome your
experience and views, in order to make this knowledge-sharing more meaningful

    Japan remains (and will probably always remain!) different, but is no longer being left out of the
                               SSC / OS models adopted by most MNCs
The CFO Program | Japan                                                                                     6
Summary of 2015 survey
This year we can rely on more significant responses from Japan and therefore
reasonably compare to the global trends
                          Global Respondents                                                   Japan Respondents*

                          >300 organizations
                                                                                                22 organizations*
                                        Average revenue                                                        Average revenue
                                             $11bn                                                                  $10bn
                                                                                 Over 50% of
            Over 50% of                   All major                            respondents had          LifeSciences, Auto, Financial
          respondents had                industries                           organizations over            Services, Consumer
         organizations over                                                      10,000 FTEs             Business, Oil & Gas, Media,
            10,000 FTEs                                                                                      Business Services,
                                                                                                        Construction, Transportation,
                                                                                                                    TMT
                               35 countries                                                       1 country!

    *Most of our respondents of MNCs operating in Japan/APAC classified as Japan for improved data analysis. The analysis presented today has
        been supplemented by Deloitte research and knowledge to provide a fuller picture for Japan (making a total of 27 organizations). It is
                                              predominantly based on the trends for Finance SSC.

The CFO Program | Japan                                                                                                                          7
The Big Picture: Global and Japan Trends
Japanese MNCs / MNCs operating in Japan have lagged significantly behind
Western MNCs, but are now being more aggressive and trying to catch up
                                      Level of                                                                                                                                           6. Portfolio
             Western Companies

                                                                                                                                                                                        optimization
                                    “aggression”                                                                                                                                          e.g. GBS
                                     and benefit
               (US / Europe)

                                                                                                                              5. Outsourcing
                                                                                                                                                                    5. Outsourcing maturity
                                                                                                                                  growth*
                                                                      General point                                          4. Far-shore
                                                                                                                                                                    4. Far-shore maturity
                                                                        of entry                                             emergence
                                                                                                          3. Near-shore
                                                                                                                                                             3. Near-shore maturity
                                                                                                              growth

                                                                   2. On-shore growth                                 2. On-shore maturity                                  2. On-shore decline

                                                                           1. Centralization
                                     1. Centralization
                                                                               decline
                                                                                                                                                                                                                        Today
                                            1980s                                        1990s                                        2000s                                          2010s
                                                                                                                                                                                                                         2015
                                      Level of
             Japanese Companies /
              Operations in Japan

                                    “aggression”
                                     and benefit                                                                                                                               5. Outsourcing
                                                                                                                                                                                   growth*
                                                                                                                  General point                                            4. Far-shore growth
                                                                                                                    of entry                                                     (e.g. KL)
                                                                                                                                                                       3. Near-shore growth
                                                                                                                                                                            (e.g. China)
                                                                                                                                                                2. On-shore growth
                                                                                                                                                               (e.g. Tokyo, Kyushu)

                                                                                                                               1. Centralization

The CFO Program | Japan                                                                                                                                                                                                             8

                                    NOTE: the above is illustrative only and is based on viewpoints on Finance SSC/OS. *Notably, IT BPO is generally considered to be more mature than depicted above, with the market started / grown in 2000’s
The Big Picture: Global and Japan Trends
 From 311 organizations, the following global picture emerges of their SSC
 locations, with LATAM and APAC being the main growth areas
                                                       The numbers of SSCs
                                                       within Western Europe
                  The number of SSCs in                decreased whereas the
                  US and Canada                        numbers of SSCs within
                  decreased compared to                Eastern Europe increased
                  2013

                                                                                               The increase in SSCs
                                                                                               within APAC is
                                                                                               primarily attributable
                                                                                               to growth in SSCs in
                                                                                               India, Malaysia, China
 Region
            % of
                      No. of
                    countries   Trend
                                                                                               and Japan
            SSCs
                    with SSCs
                                          The number of
W Europe    26%            16
                                          countries with
US/Canada   18%            2
                                          SSCs within
APAC        18%            11
                                          LATAM
LATAM       17%            13
                                          increased
E Europe    10%            13

India        8%            1
                                                   40+ SSCs    20–39 SSCs   10–19 SSCs   1–9 SSCs      No SSCs
Other        3%            9
 The CFO Program | Japan                                                                                         9
What are the top regions and countries globally?
Within APAC, India and China are considered the top locations for new or
relocated SSC. Poland remains the leading country in Eastern Europe.
What regions and countries are being considered for a new SSC?

                              Other, 4%
                 US/Canada,
                 5%
                                                           India                            13%
             LATAM,                               APAC,
             17%                                  38%
                                                          China                     9%

              W Europe,                                   Poland                   8%
              19%
                                          E Europe,
                                          17%

       As compared to 2013, the number of respondents that identified APAC as a future location
           doubled, from 19% to 38% in 2015 – with over half of that in India and China alone
  This represents a significant opportunity for Japan/APAC – the trend towards China in particular
              will make a transition to a SSC in APAC easier from many perspectives
The CFO Program | Japan                                                                              10
What drives organizations to set up/ relocate SSCs?
Cost is still king, although in Japan the principal driver appears to be in order to
consolidate into existing SSC rather than cost
What are the primary reasons for opening a new SSC or relocating a SSC?

                     Reduce cost                                        61%

       Accommodate growth                               41%
                                                                                Japan
   Consolidate into existing
                                                 30%                            respondents’
            SSC
                                                                                primary
               Improve service            20%                                   reason
     Expand language skills         10%

                      Reduce risk   10%

   Globally, the primary reasons for opening a         For Japan, the primary reason is
  new SSC are to reduce cost and accommodate      “Consolidating into existing SSC”. This is in
                     growth.                             contrast to the global trend.
The CFO Program | Japan                                                                           11
What are the key considerations in choosing a location?
The leading factor for selecting a SSC location is now proximity to operations
rather than labor cost
What are the most important factors in selecting a SSC location?

     Close proximity to current operations                                         73%

                                    Labor cost                     43%               Japan
                                                                                     respondents’
                              Labor availability           28%
                                                                                     primary
                                  Labor quality     12%                              reasons
                          Close proximity to HQ     8%

         Cultural synergies (non-language)         4%

                                    Risk profile   4%

   As opposed to prior years, the primary factor in selecting a future SSC location is the proximity
   to current operations, which advanced over labor factors such as cost, availability and quality.
      The picture is similar for Japan although there is greater emphasis on Labor availability.
The CFO Program | Japan                                                                                12
Which functions are most common?
As with recent surveys, Finance, HR, IT and Procurement remain the most
common
Which functions are performed in your organization’s SSCs?
                              Finance                                                      91%
                   Human Resources                                              66%
              Information Technology                                      52%
                                 Tax                                39%
                          Procurement                              39%
          Customer Service / Contact…                        34%
                                Legal                  20%
               Real Estate / Facilities…               20%                            Most
                 Sales Administration                 18%                             prevalent in
        Supply Chain / Manufacturing…           15%                                   Japan
          Marketing Insight & Support           14%
                                R&D        9%
                          Engineering      8%

         There is no change in the trends: Finance is by far the most popular function for moving
         processes to a SSC, followed by HR and IT. The situation appears to be similar in Japan,
                       although with less variety of functions represented in SSCs.
The CFO Program | Japan                                                                              13
How common are multi-functional SSCs now?
60% of the respondents confirmed they have more than one function in the scope
of their SSC organizations

What percentage of the SSCs are single or multi- For Japan, the picture is similar despite a less
function?                                        mature market

            > Three                                                   >Three functions,
            functions,                                                             25%
            31%
                                             Single function,                                              Single function,
                                             40%                                                           35%
                                                                    Three functions,
               Three                                                            13%
               functions,
               12%          Two functions,                                                Two functions,
                            17%                                                                     28%

   As compared to 2013, single function SSCs                     For Japan, we have found that the trend
   have declined whereas SSCs with more than                    mirrors the global picture. All respondents
         three functions have increased                           included at least Finance in their SSC
The CFO Program | Japan                                                                                                       14
Finance processes most commonly performed in a SSC
Transactional processes remain most common, but there is an ongoing trend to
include more “value-add” activities

                                Accounts Payable                                                              55%    Transactional processes
                            Accounts Receivable                                                         50%          continue to be the most
Transactional

                              General Accounting                                                      48%               commonly shared
                         Fixed Asset Accounting                                                       48%
                        Travel and Entertainment                                                44%
                                                                                                                     processes, but there has
                                           Payroll                                        38%                          been an increase in
                                       Collections                                      36%                                sharing non-
                                            Billing                                    35%                          transactional “value-add”
                                        Cash Mgt                                     33%                                 process such as
                                  Freigh Payable                               29%
                             Revenue Accounting                               28%
                                                                                                                      Financial Management
                         Financial Mgt Reporting                              28%                                    Reporting and Business
                                        Credit Mgt                            28%                                            Analysis
                                         Treasury                             28%
Non Transactional

                                 Cost Accounting                           25%                                      For Japan, we have found
                               Project Accounting                         24%
                                                                    20%
                                                                                                                          evidence that
                               External Reporting
                                    Internal Audit            16%                                                       organizations are
                                        Budgeting            15%                                                     focusing on AP, GA, FA
                                Business Analysis           14%                                                       and T&E – with fewer
                                    External Audit          14%                                                         examples of more
                    Financial Planning & Analysis           14%
                                                           13%
                                                                                                                      “customer-oriented”
                                      Forecasting
                               Financial Risk Mgt          13%                                                       processes such as AR,
                        Function Mtgt & Strategy      6%                                                             Collections and Billing
The CFO Program | Japan                                                                                                                                               15

                                                                                                                           *Note, the above data is from the 2013 Global SSC Survey
Finance processes most commonly outsourced
Organizations are continuing to outsource transactional processes, but there is no
marked increase in any one specific process

                                                             Globally, organizations
      Travel and Entertainment                     50%        continue to outsource
                                                            transactional processes,
             Accounts Payable                      49%      pointing to a continuation
                                                            of assumed reduced risk
                     Collections             41%                 associated with
                                                                   outsourcing
            General accounting               41%
                                                             For Japan, there is less
                          Payroll           40%             evidence of outsourcing,
                                                                 although more
        Fixed Asset accounting             38%                  organizations are
                                                                considering it for
           Accounts receivable         36%                   processes such as AP,
                                                             T&E and Fixed Assets.
                          Billing    32%                        There is evidence
                                                             showing growth of the
                                                              onshore outsourcing
                                                            market in the next 3 years
The CFO Program | Japan                                                                                           16

                                                                *Note, the above data is from the 2014 Global Outsourcing Survey
What is the financial impact of Shared Services?
Globally, organizations continue to achieve significant and rapid cost savings. For Japan, the benefits are
reduced and the payback period is longer

What was the average headcount reduction achieved by your last significant SSC implementation
over the first 12 months after full operations began?
                   26%             27%
                                                                                                   42%
                                            19%
                                                                                     33%
     11%                                                 10%
                                                                          7%                                            17%
                                                                                                                                      8%
                                                                                                                0%                                   0%

      No     0% to 10%             10% to   20% to      30% to          More than      No     0% to 10%        10% to   20% to      30% to       More than
   reduction                        20%      30%         40%              40%       reduction                   20%      30%         40%           40%

What was the payback period of your Shared Services implementation?
           Over four years after
           implementation, 10%                   Less than one year                                                               Less than one year
                                                after implementation,                                                            after implementation,
                                                         16%                                                                              30%
  Between three and
   four years after
 implementation, 11%
                                                                                       Over four years after
                                                                                       implementation, 40%
                                                           Between one and two
     Between two and                                            years after
     three years after                                     implementation, 35%
   implementation, 29%                                                                  Between two and                                  Between one and two
                                                                                        three years after                                     years after
                                                                                      implementation, 20%                                implementation, 10%

   Average cost reduction of 20%, payback of 2.4 years                              Average cost reduction of 10%, payback of 4 years

The CFO Program | Japan                                                                                                                                        17
Where has Shared Services had a positive impact?
It is not just cost reduction – many other areas have been improved through SSCs

                            Cost reduction                                     49%                                                       42%
                        Process efficiency                             39%                                                         51%
                           Internal controls                             42%                                                       44%
                           Process quality                      31%                                                          53%
           Data visibility and comparability                    31%                                                      51%
              Support of growth/scalability                    28%                                                      53%
          Cross-organization comparability                   25%                                                  51%
                             Service levels              21%                                                52%
Removal of distractions from core business                   24%                                            45%
  Compliance with regulatory requirements                      28%                                           39%
        Talent and capability development         11%                                            53%
                    Acquisition integration            16%                               32%
                           Working capital        7%                             37%
                          Effective tax rate 3%         15%

                                                                   Significant positive impact    Somewhat positive impact

    Globally, many factors are improved when                                                        Our Japanese respondents indicated that
   implementing SSC – from process to service                                                      process standardization and control are the
                    to control                                                                     key reasons and benefits for implementing
                                                                                                                     SSCs
The CFO Program | Japan                                                                                                                          18
Addressing the Retained Organization challenge
Plan in the changes required within the Retained Organization and don’t neglect it
How have you typically addressed the organization and talent changes
needed at the local level when shifting to SSCs/COEs?

     Provided new organization chart, job descriptions, etc.                                 68%

                     Provided target headcount reductions                              61%

                Issued communications regarding changes                          56%

                                        Conducted training                 44%

                 Shifted prior associates to other functions         29%

                                    Reevaluated job levels           29%

     Required associates to reapply for remaining positions    21%

 Consider key change management activities such as providing new organizational charts and job
  descriptions. As opposed to 2013, more respondents provided target headcount reductions to
                 the retained organization. Communicate clearly and from the top!
The CFO Program | Japan                                                                       19
The Japan Challenge
How common is SSC / OS for our Japan respondents?
Our respondents from Japan indicate that the majority have established SSC, and
the majority of those now serve Japan
Summary of statistics for JP respondents:

            100%
                                                      70%
                                                                             60%

                  50%             27
                                                      19                     16
                          Number of respondents Number with SSC /    Number servicing JP
                                from JP          OS in JP / APAC        operations

       A large majority - 70% - of organizations in the survey have already set up SSCs or OS
   arrangements in Japan or APAC. Most of those are serving Japan operations (60% of total). For
   those not yet serving Japan, our respondents indicated that they were looking to include Japan
                                          in the near future.
The CFO Program | Japan                                                                             21
The picture for Japan for SSC and Outsourcing
For all companies, including those responding from Japan, the following picture
emerges
From where are you serving Japan?

                              Japan                                               19%
                               China                                       17%
                                India                           14%
                                                                                                                   Almost ¾ (72%) of
                          Philippines                          14%                                               respondents’ Japanese
                                                                                                                  operations are served
                            Malaysia                  12%                                                           from other APAC
                                                                                                                        locations
                          Singapore             10%
                          Other Asia    5%
                                 US            9%

       With the level of respondents this year, we can confirm that “Japan serving Japan” is a key
                 theme, with almost 20% of operations servicing Japan located onshore
    However the majority of operations servicing Japan are located offshore, with China, India and
                         the Philippines being the most common locations
The CFO Program | Japan                                                                                                                                                     22

                                                 Does not include 10% of data – which respondents’ confirmed to serve Japan from numerous other locations e.g. Denmark / Spain / Colombia
Which specific locations are the proven destinations?
The geographic spread is now broad, with a variety of locations being used, but
with some clear preferred locations
                                                                                  Onshore: 19% located in Japan
                                                                   More established on-shore locations are:
                                                                                “Major Metropolitan Areas”: Tokyo, Osaka
                                                                                “Minor Metropolitan Areas”: Hokkaido, Shikoku, Kyushu
                                                                                Other research points to Okinawa being a common location
                                                                                for TMT organizations establishing Customer Services
                                                                                Centers

                                                                          Near-shore: 34% located in China SK,
                                                                               Taiwan and the Philippines
                                                                   More established near-shore locations are:                                    Manila
                                                                                                                                                 Dalian
                                                                                                                                                 Shanghai/Wuxi

                                          Far-shore: 38% located in India,
                                          Malaysia, Thailand & Singapore
                                  Established far-shore cities servicing Japan from within Asia are:

   (Very) Far-shore:                                  KL
   9% located in US                                   Singapore
No specific locations disclosed                         India - no specific locations disclosed
The CFO Program | Japan                                                                                                                                              23

                                          Does not include 10% of data – which respondents’ confirmed to serve Japan from numerous other locations e.g. Denmark / Spain / Colombia
How can you overcome the challenges in Japan? (1 of 2)
The following are the top challenges that MNCs or JMNCs face – for discussion
Challenge                 Detail                               Comments
Japanese                  • Lack of available Japanese         • Focus on simple processes with minimal external impact, manage any
language                    speakers in offshore locations       change with external suppliers / customers carefully
                          • Complexity of systems’             • Increase in availability of Japanese-speaking resources in cities like Dalian
                            language                             and Manila, and increase in use of English in Japan in general
                          • Many suppliers / customers still   • “Olympics effect” will no doubt accelerate this trend in next 3-5 years
                            operate primarily in Japanese
Lack of                   • Processes tend not to be           • Consider standardization and simplification first, either before or after putting
process                     harmonized and are highly            activities into a shared team or outsource, although this goes against the
standardization             customized, in particular            global trend
/ customization             systems processes                  • Avoid outsourcing non-standardized processes: experience shows for Japan
                                                                 that these processes are very hard for the Outsourcer to manage successfully
Unable to                 • Making resource lay-offs /         • Consider all resource options – temps, part-time, retirees
release                     changes is very challenging        • Top-down sponsorship and communication is critical
resources                                                      • Set more conservative business case savings
Corporate risk            • Especially JMNCs tend to be        • Prove the concept initially – share / outsource / offshore low risk processes
aversion                    more risk-averse, needing            such as Fixed Assets accounting or Travel and Entertainment processing.
                            strong evidence of existing        • Take advantage of MNC’s culture of being less risk averse. Adopt a more
                            success                              “mandated” approach to SSC rather than “opt-in”
                                                               • Compare to other companies who have made the leap and been bold
Lack of scale             • MNC operations in Japan may        • SSC can still be achieved on a smaller scale
for MNCs                    lack scale                         • Consider outsourcing as an option
                                                               • Note – average SSC size is around 100 FTE (Japan = 50)
Lack of                   • Most JMNCs do not invest           • Reduces the likelihood of success of the project
investment and              sufficient budget, resource and    • Develop clear business case for investment and manage expectations
governance                  authority to SSCs and board          carefully. Develop clear governance model as part of transition
                            members of SSCs                    • Communicate achievements within the organization

The CFO Program | Japan                                                                                                                          24
How can you overcome the challenges in Japan? (2 of 2)
The following are the top challenges that MNCs or JMNCs face – for discussion
Challenge                 Detail                               Comments
General &                 • Concern over delivery quality      • MNCs can take advantage of top-down cultural ways of working to help
organizational            • Tendency to over-customize           influence decision-making in Japan
culture                     and control                        • Incremental change required
                          • Desire for “100% accuracy”         • Leading examples are now numerous – the level of acceptance is growing
                                                               • Manage expectations carefully – things will go wrong, especially at the start,
                                                                 but will gradually improve and service and quality have been proven to have
                                                                 continuously improved in SSCs
Higher change             • Achieving any change in Japan      • Change management is rated highest as things organizations wish they had
resistance                  is slow and difficult                done better
                                                               • Consider carefully the change mgt. needs: training, knowledge transfer,
                                                                 communication, career changes required. You cannot over-communicate
Perceived lack            • Concern is generally high          • Our experience is that due to lack of standard operational procedures, non
of flexibility              amongst Japanese                     standard requests to the back office are frequent. There is a concern that the
with SSC/OS                 management that the SSC or           SSC / OS provide cannot be flexible enough
                            OS provider will not be flexible   • Manage as part of a smooth transition and plan additional resource to
                            enough                               manage expectation to new service levels
Service and               • JNMCs have an aversion to          • In general, roles and responsibilities are more vague in JMNCs, therefore it is
contract                    signing a contract / SLA with        difficult to clarify the scope and tasks of the SSC or the OS
uncertainty                 SSCs and BPO vendors               • In addition, many Japanese organizations have an aversion to negotiate a
                                                                 contract / SLA with a third party
                                                               • Start small with low risk scope, then move into other scope
Brand                     • Skilled and available resources    • Carefully consider process and resource availability – some processes will
challenge                   outside of major metropolitan        not need highly skilled resources (e.g. AP, T&E)
                            areas difficult to source          • Consider ways to up-skill and motivate staff: training, knowledge transfer,
                            especially for less well-known       shadowing from existing resources to help transition (bed this into the plan)
                            brands

The CFO Program | Japan                                                                                                                          25
Looking Forward, Closing Thoughts
Change over the next 3-5 years for SSCs
SSCs will continue to mature on a global level
How do you expect your organization to increase its use of Shared Services /
COEs in the next 3-5 years?
     # of transactional                                                 81%      # of transactional
                                 58%                        23%                                                     64%                  7%     71%
    processes in SSCs                                                           processes in SSCs
    # of knowledge-                                                             # of knowledge-
   based processes in            58%                        23%         81%    based processes in                   64%                  7%     71%
      SSCs/COEs                                                                   SSCs/COEs
       # of functions                                                               # of functions
                                 60%                       11%    71%                                             53%
      served by SSCs                                                               served by SSCs
        % of internal                                                                % of internal
       business units        50%                   13%       63%                    business units                53%
      served by SSCs                                                               served by SSCs
          # of                                                                         # of
  geographies/regions      44%                16%        60%                   geographies/regions           43%
    being served by…                                                             being served by…
  # of customer-facing                                                         # of customer-facing
                           44%                9%     54%                                              7% 7% 14%
   processes in SSCs                                                            processes in SSCs

                          Increase somewhat        Increase significantly                                   Increase somewhat   Increase significantly

    Majority of the respondents are planning to                               Our Japanese respondents indicated that their
     increase the number of transactional and                                  intentions are in line with the overall survey,
           knowledge-based processes                                          except they will be less aggressive with scope
  Over 70% of the respondents want to increase
   the number of functions within their SSCs
The CFO Program | Japan                                                                                                                                  27
Change over the next 3-5 years for Outsourcing
Outsourcing will continue to focus on transactional processes
How do you expect your organization to increase its use of Outsourcing in
the next 3-5 years?

   # of transactional                                     49%                        # of transactional
                                 40%                 9%                                                          29%         7%    35%
      processes                                                                         processes

    # of knowledge-                          27%                                      # of knowledge-
                           25%         2%                                                                 7%
    based processes                                                                   based processes

       # of functions                                                                    # of functions
                              36%             2% 38%                                                           21%
          served                                                                            served
        % of internal                                                                     % of internal
       business units       29%             3% 32%                                       business units   7%
          served                                                                            served
   # of geographies /                                                                # of geographies /
                           26%          5% 31%                                                            7%
     regions served                                                                    regions served

 # of customer-facing                                                              # of customer-facing
                          17% 1% 18%                                                                       14%
       processes                                                                         processes

                                 Increase somewhat        Increase significantly                                     Increase somewhat   Increase significantly

     Generally, fewer respondents indicated that                                      We anticipate some strong growth in the use
     they were planning to increase their use of                                      of outsourcing for transactional processes in
      Outsourcing as compared to their use of                                                             Japan
                Shared Services/COEs
The CFO Program | Japan                                                                                                                                           28
The Big Picture: 2020 Predictions
The Western market will continue to mature, with GBS evolving. For Japanese
MNCs / Japan Operations, the market will grow on all levels
                         Level of                                                                                                                                   6. Portfolio
                                                                                                                                                                                                         Ongoing
Western Companies

                                                                                                                                                                   optimization
                       “aggression”                                                                                                                                  e.g. GBS
                                                                                                                                                                                                         maturity
                        and benefit
  (US / Europe)

                                                                                                        5. Outsourcing
                                                                                                                                              5. Outsourcing maturity                               Ongoing maturity
                                                                                                            growth*
                                                 General point                                         4. Far-shore
                                                                                                                                               4. Far-shore maturity                                Ongoing maturity
                                                   of entry                                            emergence
                                                                                  Or 3. Near-shore
                                                                                                                                       3. Near-shore maturity                                       Ongoing maturity
                                                                                       growth

                                              2. On-shore growth                                2. On-shore maturity                                  2. On-shore decline

                                                      1. Centralization
                        1. Centralization
                                                          decline
                                                                                                                                                                                                              Next 5
                           1980s                                   1990s                                         2000s                                          2010s                                         years
                                                                                                                                                                                       2015
                         Level of
Japanese Companies /
 Operations in Japan

                       “aggression”
                        and benefit                                                                                                                       5. Outsourcing                             5. Outsourcing
                                                                                                                                                              growth*                              growth and maturity
                                                                                            General point                                            4. Far-shore growth                           4. Far-shore growth
                                                                                              of entry                                                     (e.g. KL)                                   and maturity
                                                                                                                                                  3. Near-shore growth                            3. Near-shore growth
                                                                                                                                                       (e.g. China)                                   and maturity
                                                                                                                                           2. On-shore growth                                     2. On-shore growth /
                                                                                                                                          (e.g. Tokyo, Kyushu)                                          decline?
                                                                                                                                                                                                      1. Centralization
                                                                                                         1. Centralization
                                                                                                                                                                                                          decline
The CFO Program | Japan                                                                                                                                                                                                         29

                                  NOTE: the above is illustrative only and is based on viewpoints on Finance SSC/OS. *Notably, IT BPO is generally considered to be more mature than depicted above, with the market started / grown in 2000’s
Closing thoughts
The following are closing pieces of advice to our CFOs in the room

•    Consider Shared Services / Outsourcing as a long-term journey, from initiation through to Optimization

•    Consider Shared Services / Outsourcing within your full Operating Model - don’t forget what and who
     will remain (“Retained Organization”), what skills to they need to succeed

•    The market is only going to grow from here for Japanese operations

•    “If you can’t beat them, join them” – make use of onshore/offshore outsourcing

•    Plan from a Regional perspective – but be involved from a Global perspective to enhance your choices
     for the Japanese market

•    Treat any SSC as a separate governance model, providing a service under an agreement

The CFO Program | Japan                                                                                       30
Case Studies
Case Study 1
Company A is moving towards a SSC in Tokyo serving the Japan market. It is
establishing a SSC in China. It has established SSC in SEA, Europe and North
America.
                               Summary picture for Company A (Electronics industry)

                                          China:
                                          Centralizing operations, where
                                          no legal restrictions
                                                                                         North America:
                                                                                         Centralized operations to
                                                                                         one SSC on West Coast
                                                                                         and moving to BPO
   Europe:
                                                                                         vendor
   Centralized operations to
   existing SSCs by business
   and moving to BPO                                        Japan:
   vendor                                                   Centralizing approx. 100
                                                            companies’ operations into
                           Asia:                            one SSC in Tokyo
                           Centralized some SEA
                           operations into 1 SSC, now
                           moving to lower cost location

The CFO Program | Japan                                                                                              32
Case Study 2
Company B has established a Finance SSC in both Japan and China and uses a
BPO vendor in India for processing, which it is growing. It has an established SSC
in Singapore serving SEA.
                               Summary picture for Company B (manufacturing industry)

                                      China:
                                      SSC in operation + BPO vendor

                                                                                        North America:
                                                                                        TBD
Europe:
Undergoing integration of
accounting systems into                                    Japan:
SSC operations                                             One SSC supporting Finance
                                                           functions for BUs + BPO
                                                           vendor

                          India:
                          BPO vendor – increase in        Asia:
                          scope and scale                 Established SSC in Singapore, and
                                                          uses BPO vendor in India

The CFO Program | Japan                                                                                  33
Case Study 3
Company C has SSCs in Japan and China. It acquired a company with a legacy
SSC in India which covers North America, and is now expanding that to serve as a
global SSC to EMEA and APAC.
                            Summary picture for Company C (Service industry)

                                      China:
                                      SSC for Japan

                                                       Japan:
                                                       2 SSC across multiple
                                                       functions for 60
                          India                        companies
                          SSC for legacy company
                          acquired by Company C.
                          Considering using for core
                          operations / company.

The CFO Program | Japan                                                        34
Appendices
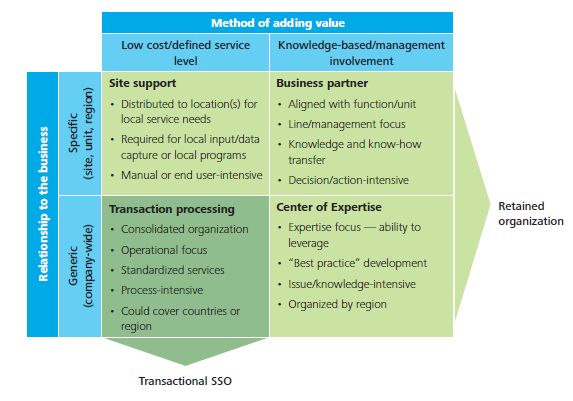
Deloitte’s SSC and Outsourcing Process Model (1 of 2)
This can be used to help determine the split between SSC/OS and how to deliver
the remainder of the model

The CFO Program | Japan                                                          36
Deloitte’s SSC and Outsourcing Process Model (2 of 2)
This can be used to help determine the split between SSC/OS and how to deliver
the remainder of the model

The CFO Program | Japan                                                          37
Does your organization mandate SSC?
The majority mandate the use of existing SSCs in order to lower costs. In Japan, it
is used more as an “opt-in” solution
Does your organization mandate participation in Shared Services or use an
opt-in model?                            Why do business units/segments choose to opt in?
                                                                                    Lower costs                        71%
                                                                                       Expertise                    58%
                                               Opt-In,                     Flexibility in Staffing
                                               28%                                                               45%
                                                                                 Higher Quality               40%
                                                 Opt-In,
            Mandated,                            47%                  Internal/political pressure          28%
            72%                                                           Access to technology           26%
                                                                     Infrastructure/larger scale        25%
            Mandated,
            53%                                                            Higher caliber talent     15%
                                                                     Greater geographic reach        10%

                                                               Why do business units/segments choose to opt out?

                                                                                     Lack of service responsiveness
                          Mandate vs. opt-in                                                                                         36%

 •     Over 70% of the organizations mandate participation          Not being able to support the business remotely
                                                                                                                                   29%
                                                                            (from a Shared Service Center)
       within Shared Services – consistent with the 2011 and
                                                                                                        Poor quality
       2013 surveys                                                                                                                28%
 •     Primarily businesses are opting out due to a lack of                                                Higher costs
                                                                                                                               26%
       service responsiveness, whereas in 2013 the primary
                                                                                                     Lack of flexibility
       concern was that SSCs would not be able to support                                                                      25%
       the business remotely                                        Not being able to drive/contribute to the
                                                               mandate/scope/budget allocation process of the SSC            15%
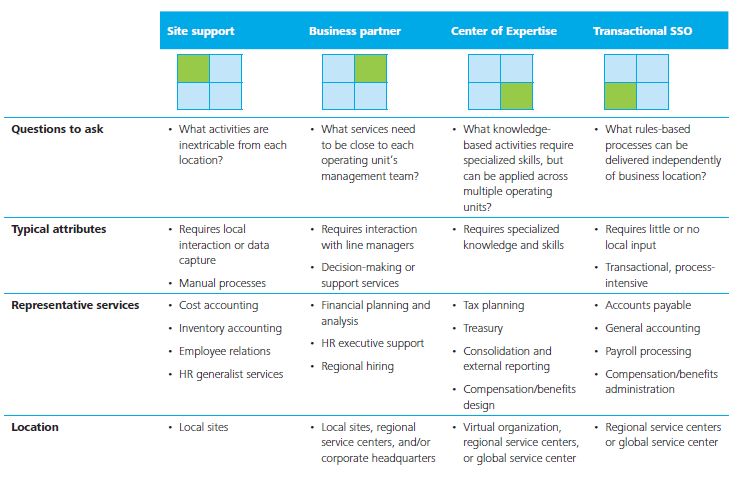
The CFO Program | Japan                                                                                                                    38
Outside of the local business, how are FTEs distributed?

                                  Tax    17%                                    34%                                 16%                             30%                     3%

               Information Technology     21%                                 21%                  13%                                33%                            12%

                                Legal     21%                                       32%                                    22%                       15%             10%

      Customer Service/Contact Center          24%                       9%           13%                                       42%                                  12%

                          Engineering          25%                 3%                                         54%                                              13%         5%

     Real Estate/Facilities Management           30%                                         29%                          6%                  27%                      8%

                              Finance            30%                                  17%                9%                                 40%                            4%

                         Procurement                 31%                                     25%                          14%                            30%

 Supply Chain/Manufacturing Support                  32%                               16%                    13%                           32%                        7%

                                 R&D                 33%                                            33%                                              34%

           Marketing Insight & Support               33%                                                 38%                                12%                12%         5%

                    Human Resources                        38%                                     20%                    8%                       30%                     4%

                  Sales Administration                     39%                                       24%                         9%                    24%                 4%

                                               Local         Corporate          KnowledgeBased SSCs/ COEs            Transactional SSCs           Outsourced

 •       Knowledge-based SSCs or Centers of Excellence (COEs) are mostly leveraged for non-traditional functions such as
         Engineering and R&D
 •       Customer Service/Contact Center, Finance, and Information Technology have the largest percentage of FTEs within
         transactional SSCs
 •       Information Technology, Customer Service/Contact Center and Legal have the highest percentage of Outsourced
         FTEs

The CFO Program | Japan                                                                                                                                                          39
What is important to your business unit customers?
Many factors are now considered important according to SSC customers
                     Timeliness of response

                            Cost of services

         Reacting to Business Unit requests
                                                                                                                         2015
                   Providing routine services                                                                            2013
                                                                                                                         2011
 Staff knowledge of Business Unit objectives

  Staff knowledge of multiple SSO processes

              Providing non-routine services

Anticipating unidentified Business Unit needs

 •     Timeliness of response continues to be the most important service that SSCs can provide to customers since 2007
 •     Although reacting to business unit requests and having a greater understanding of the business unit objectives have
       increased in their importance to business unit customers since 2013, they are still considered less important than they
       were in 2011
 •     Ad-hoc and non-standardized requests, such as providing non-routine services and anticipating unidentified business
       unit needs, continue to be of least importance to business unit customers
 •     Overall: cost is the one variable vs. other factors which are now “standard / assumed” as part of moving to SSC

The CFO Program | Japan                                                                                                         40
Process standardization and technology
How has process standardization and technology impacted your move to Shared
Services? Standardizing and implementing new technology after moving to a SSC
is the more common approach
Did you standardize processes before, during, or after the     Process migration
move to Shared Services?
                                                               •   Respondents’ preference for moving processes via the
            Standardized
            processes prior to                                     ‘lift and shift’ method increased
            move to SSC, 17%
                                                               •   In comparison to 2013, there was a reduction in the
                                                                   number of respondents who followed the ‘big bang’
    Standardized                                                   approach
    processes and
    moved to shared                                            •   Moving processes prior to standardization and
                                             Standardized
    services at the same
                                             processes after       technology changes continues to be the most popular
    time, 21%
                                             move to SSC,          approach and is actually gaining popularity
                                             62%

                                                                                               Timing of process move to SSC
Did you move processes before, during, or after technology
change?                                                                                       Prior to     During        After
                                                                                            technology   technology   technology
            Moved processes
                                                                                              change       change       change
            after technology
            change, 21%                                                          Prior to
                                                                                 move to       5%           7%           5%
                                                                                 SSC
                                             Moved processes   Timing of         During
                                             before            process           move to       6%           13%          3%
                                             technology        standardization   SSC
                                             change, 45%

      Moved processes                                                            After
      at the same time                                                           move to       35%          13%          13%
      as the technology                                                          SSC
      change, 34%

The CFO Program | Japan                                                                                                        41
How could you have improved your Shared Services
journey?
What changes would you have made along your                            How do you use the savings generated by SSC
SS journey?                                                            productivity improvements?
       Better change management                                  51%        Pass lower costs onto the
                                                                                                                     54%
                                                                                    business
Better alignment between process
                                                           42%
 change and technology change
               Stronger executive                                                 Invest in technology         13%
                                                           42%
               support/alignment

              Stronger governance                          41%
                                                                        Invest in process improvement          12%
             Better team/resources                   35%
      Faster decision making/issue
                                                    31%                   Invest in talent development    6%
               resolution

                   Better reporting           24%
                                                                                     Improve facilities   3%
           Faster transition to GBS     18%

 Shared Services improvements
 •     Since 2011, better change management continues to be the primary improvement respondents would make to their
       SS journey
 •     Although the top three areas for improvement remain consistent from 2013, fewer respondents are indicating those as
       their improvement areas
 •     18% of the respondents indicated that their SS journey would have improved with a faster transition to GBS
 •     Over half of the respondents indicated that the savings generated by SSCs productivity improvements are passed
       onto the business

The CFO Program | Japan                                                                                                    42
How will the strategic priorities for SS/GBS organizations
shift?

             Focusing on continuous improvement

                    Increasing level of automation

     Increasing functional scope (functions served)
                                                                                                                          Today
                                                                                                                          In Five Years
Increasing degree of functional process integration
                                                                                                                          In Ten Years

                  Developing analytics capabilities

Increasing geographic scope (geographies served)

                         Developing a GBS model

 Shift in priorities
 •      Continuous improvement will continue to be the primary focus of the SS/GBS organizations over the next ten years
 •      Although increasing functional scope is one of the top priorities for organizations today, developing analytics
        capabilities is a main priority for five years and ten years out
 •      Over time, the SS/GBS organizations will focus less on increasing geographic scope and more towards developing a
        GBS model…

The CFO Program | Japan                                                                                                                   43
Contacts
Contacts

                                                    Deloitte

                          Tom Hewitt                           Michael M. Laurer

                          Senior Manager                       Manager
                          CFO Services Group                   The CFO Program | Japan

                          +81 80 9354 4505                     +81 80 4363 4814
                          tohewitt@tohmatsu.co.jp              mlaurer@tohmatsu.co.jp

The CFO Program | Japan                                                                  45
Deloitte Touche Tohmatsu (Japan Group) is the name of the group consisting of member firms in Japan of Deloitte Touche Tohmatsu
Limited (DTTL), a UK private company limited by guarantee, and Deloitte Touche Tohmatsu (Japan Group) provides services in Japan
through Deloitte Touche Tohmatsu LLC, Deloitte Tohmatsu Consulting Co., Ltd., Deloitte Tohmatsu Financial Advisory Co., Ltd., Deloitte
Tohmatsu Tax Co., and all of their respective subsidiaries and affiliates. Deloitte Touche Tohmatsu (Japan Group) is among the nation's
leading professional services firms and each entity in Deloitte Touche Tohmatsu (Japan Group) provides services in accordance with
applicable laws and regulations. The services include audit, tax, consulting, and financial advisory services which are delivered to many
clients including multi-national enterprises and major Japanese business entities through nearly 7,900 professionals in almost 40 cities
of Japan. For more information, please visit Deloitte Touche Tohmatsu (Japan Group)’s website at www.deloitte.com/jp/en.

Deloitte provides audit, consulting, financial advisory, risk management, tax and related services to public and private clients spanning
multiple industries. With a globally connected network of member firms in more than 150 countries and territories, Deloitte brings world-
class capabilities and high-quality service to clients, delivering the insights they need to address their most complex business
challenges. Deloitte’s more than 210,000 professionals are committed to becoming the standard of excellence.

Deloitte refers to one or more of Deloitte Touche Tohmatsu Limited, a UK private company limited by guarantee (“DTTL”), its network of
member firms, and their related entities. DTTL and each of its member firms are legally separate and independent entities. DTTL (also
referred to as “Deloitte Global”) does not provide services to clients. Please see www.deloitte.com/about for a more detailed description
of DTTL and its member firms.

This communication contains general information only, and none of Deloitte Touche Tohmatsu Limited, its member firms, or their related
entities (collectively, the “Deloitte Network”) is, by means of this communication, rendering professional advice or services. No entity in
the Deloitte Network shall be responsible for any loss whatsoever sustained by any person who relies on this communication.                   Member of
                                                                                                                                              Deloitte Touche Tohmatsu Limited
© 2015. For information, contact Deloitte Touche Tohmatsu LLC.
You can also read