Four Trends Re-Shaping Investment Management - Economic ...
←
→
Page content transcription
If your browser does not render page correctly, please read the page content below
Citi Markets & Securities Services – Business Advisory Services

10th January 2019

Four Trends Re-Shaping Investment Management
Presentation for the Economic Club of Florida

 For Institutional Clients Only

Citi Business Advisory Services     Global:   Sandy Kaul, 212-723-5118 Sandy.Kaul@citi.com
                                    EMEA:     Robert Crossley, +44 (0) 207 986 9255 Robert.Crossley@citi.com
                                    US:       Matt Kummell, 212-723-2848 Matt.Kummell@citi.com
Strictly Private and Confidential
Agenda
Improved Factor Understanding Drives New Thinking About Portfolio Construction
Investors Demonstrate a Significant Shift to Passive Over Actively Managed Funds
Actively Managed Funds Re-Align to High Conviction, Thematic & Alternatives
Emerging Technologies Offer Potential to Democratize Access to Real Assets
2
1Rethinking Asset Class Diversification
Since the late 1950s, investors have sought to build diversified portfolios of asset class
exposures that seek to balance risk and reward, but our understanding of risk is evolving
Evolving Understanding of Portfolio Diversification
Real Assets Real Assets
Alternatives Private Equity Common Factor
Rates Exposures
Hedge Funds Inflation
Growth
Rates Liquidity
Currency
Exposure to
Bonds Geography
Diversified Companies Sector
Asset Credit
Companies
Class
Exposures
Common Factor
Exposures
Volatility
Inflation
Equities Equities
Growth
Momentum
Geography
Sector
• By diversifying across asset • Asset classes are not mutually exclusive units • Real assets and rate-linked
classes, investors should be investments also share many
able to find the best possible • Many are comprised of exposure to a set of common risk factors, several of which
return for the least possible risk companies that share common risks overlap with company risk factors
Source: Citi Business Advisory Services
3
2Risk Balancing
To ensure diversification without disrupting their existing fund allocation, some institutions go long
or short specific factor exposures outside their desired range to balance their portfolio holdings
Adjusting for Factor Exposures at a Portfolio Level
Asset Class Fund Allocations Under- Factor Exposures Over-
Exposed 0 Exposed
Alternatives
Volatility
Inflation
Bonds Growth
Momentum
Aggregate
Exposures Liquidity
Duration
Credit Risk
Equities
Real Rates
Emerging
Markets
• Many sophisticated institutional investors look to manage their unintended Desired Range
factor exposures, but there is significant debate as to whether this practice Buy Sell
undermines the value of the core allocations Exposure Exposure
Source: Citi Business Advisory Services
4
3Re-Categorizing Allocations Based on Return Profile
Other investors are re-thinking whether asset classes are the best way to categorize and diversify
their portfolio—many are beginning to re-assign strategies based on their return profile
Re-Assigning Strategies Based on their Return Profile • A wide variety of sub-strategies can be
found within the Equity, Bond and
Asset Class Return Profile Alternatives buckets
Systematic Illiquid • Sub-strategies offer highly divergent
Alternatives Macro Limited return profiles:
Mark-to- •
Market • ,Some align to low volatility bond-
Returns like returns
Distressed
Bonds • Some align to higher volatility
Bonds
Higher equity-like returns and
G-10 Volatility
Rates Equity- • Others are illiquid and very long-
Fund Like term in nature and are thus only
Returns occasionally marked-to-market to
track their contribution
Emerging
Markets • Some institutions have now begun to re-
Low
Equities Equity categorize these various sub-strategies
Volatility
Bond- and group them more effectively to reflect
Quant the types of risks and return streams they
Long- Like
Returns offer to the portfolio
Short EQ
• This is seen as helping ensure better
diversification and more effective risk
control according to participants in
proprietary Citi surveys
Source: Citi Business Advisory Services
4Re-Thinking Sources of Investment Returns
Improved risk technologies allow investors to slice and dice portfolios to look more deeply into
what is the driver of returns and thus better isolate and target the specific sources of returns
Fund or Portfolio Sources of Investment Returns
Return Attribution
Asset Idiosyncratic
Selection Exposures
& Capacity
Momentum Technical
Volatility
Duration
Factors:
Liquidity etc.
Growth Style
Value
Quality
Factors
Credit Grade etc.
Interest Rate Sensitivity Risk
Credit Risk—Ability to Repay
Factors
Equity Risk—Earnings on Cash
Inflation Sensitivity etc.
Financials
Sector
Automotive
Energy Exposures
Consumer Goods etc.
Local Market
Developed Markets Geographic
Emerging Markets Exposures
Specific Countries etc.
Source: Citi Business Advisory Services
5Increasing Use of Index Exposures in Portfolio Construction
A more precise view of the various sources of return for the portfolio allows investors to replace
many expensive active managers with low cost indices for much of their exposures
Traditional Approach Shifting Approach to Portfolio Construction Emerging Approach
EQ B A External
Idiosyncratic
Active
Exposures
Managers
Technical
Factors
External
Active
Managers Style
Factors
Active
Index
Risk
Selection
Factors
Sector
Exposures
Asset Geographic
Allocation Exposures
Source: Citi Business Advisory Services
6Agenda
Improved Factor Understanding Drives New Thinking About Portfolio Construction
Investors Demonstrate a Significant Shift to Passive Over Actively Managed Funds
Actively Managed Funds Re-Align to High Conviction, Thematic & Alternatives
Emerging Technologies Offer Potential to Democratize Access to Real Assets
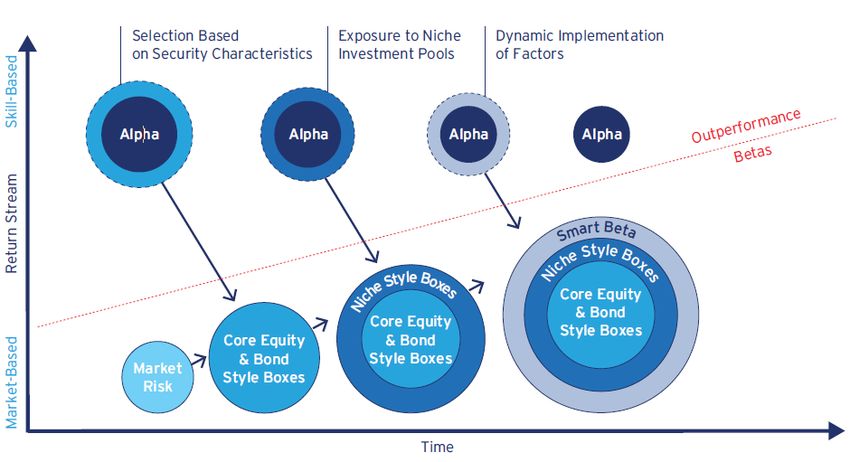
7Impact of Rising Index Offerings
Technology is enabling managers to dynamically identify and construct indices or baskets of
securities to provide exposure to specific factors, shifting factor-related returns from alpha to beta
Reclassification of Outperformance to Beta
*1995: 32 Stocks to
Each Tradable Index
2016: 1.2 Tradable Indices
To Each Stock
• The ever-expanding variety of tradable index offerings are allowing investors to directly access sources of return
that used to only be available through active management and that were considered to be “outperformance”
• Now those return sources can be captured as an alternate type of market return or “beta”, helping to explain why
increasingly, investors are only viewing idiosyncratic returns as alpha-generating
Source: Citi Business Advisory Services. *“What’s Behind the Falling Number of Public Companies?”, Vanguard.com,
https://advisors.vanguard.com/VGApp/iip/site/advisor/researchcommentary/article/IWE_InvResBhndFallPublCompanies
8Drivers of New Portfolio Construction Approach
The number of index offerings increased 4.5X between 2007 and 2017—the growing variety of
index offerings and cost advantage is helping drive the move away from actively managed funds
Growth in Number of Passive Fund Offerings Actively Managed vs. Passive Fund Fees
ETFs & US Index Funds Actual Paid by Institutional Investors: 2016
Basis Points
70
7,593
Number of Funds
8000
59
60
7000
50
6000
+4.5x 37
40
5000
30 28
4000 AUM Growth by Category
2007-Q3 2018: 20
14
3000
Equity ETFs: +5.7X $3.9T
1,667 Bond ETFs: +13.4X $823B 10
4
6 6
4
2000
Int’l ETFs: +7.2X $767B
0
1000 Asian ETFs: +8.6X $508B US Large Cap US Small/Mid Non-US EQ US FI (Core)
US Index MFs: +3.9x $3.4T* Cap
0
2007 2008 2009 2010 2011 2012 2013 2014 2015 2016 2017 Active Managers Passive Funds
• The number of passive fund offerings has expanded • Fee advantages are a major reason that many investors
dramatically in the past decade are choosing to utilize low-cost ETFs and indices
• Growth has occurred across a wide range of categories, • The largest institutional investors that can command the
boosting the variety of indices that investors can choose lowest fees paid between 14 bps for US Core Fixed
to gain exposure Income and 59 bps for US Small/Mid-Cap actively
managed funds in 2016 according to Callan
• Smart Beta funds that isolate specific technical and style
factors are further expanding investor options • By contrast, the range for passive funds was 4-6 bps
*Data as of 2017. Sources: Left-hand Chart: Citi Business Advisory Services analysis based on proprietary data subscriptions to SimFund and eVestment. US Mutual fund data from
www.ici.org. Right hand chart: Callan 2017 Investment Management Fee Survey. Active fees are for the largest category of investor (cheapest fees) and passive fees represent average
9
across all investor bands. https://www.callan.com/wp-content/uploads/2017/10/Callan-2017-Investment-Manager-Fee-Survey.pdfDecisive Shift to Passive Fund Exposures
Since 2011,net new investor flows into passive funds has outstripped flows into actively managed
funds by nearly 5X – with flows into active managers showing a net negative since 2015
Comparison of Net New Flows into Actively Managed vs. Passive Funds
2,000 Passive
Active
1,500 Passive Funds
1,263 2011-H1 2018 : $5.2T
1,000 515 2015-H1 2018: +$3.1T
Investor Flows
(USD billions)
461 564
500 647 927
786 640 679
424 531
282 Active Funds
190
0 37 2011-H1 2018: +$1.1T
-145
-432 -549 2015-H1 2018: -$447B
(500) -290
(1,000)
2011 2012 2013 2014 2015 2016 2017 1H18
• Net investor flows into passive funds topped $5.0 trillion between 2011 and H1 2018, a figure 4.7X larger than the
net new flows into actively managed funds
• Active fund managers have in particular struggled since 2015 as both the financial press and global regulators have
been vocal in their views about how fees negatively impact long-term returns. Since 2015, actively managed funds
have registered outflows of $447 billion through H1 2018
Source: Citi Business Advisory Services based on proprietary data subscriptions to Morningstar, eVestment and Simfund
10Agenda Improved Factor Understanding Drives New Thinking About Portfolio Construction Investors Demonstrate a Significant Shift to Passive Over Actively Managed Funds Actively Managed Funds Re-Align to High Conviction, Thematic & Alternatives Emerging Technologies Offer Potential to Democratize Access to Real Assets 11
Shifting Goals for Actively Managed Funds
 Active managers with returns too close to a benchmark that can be replicated through a cheaper
 index fund are becoming more active in their security selection to generate differentiated returns
          Traditional Active Funds                  High Conviction Funds                         Thematic Funds

                                                            Performance                             Performance

        Performance / Benchmark                              Benchmark
                                                                                              Benchmark
                                                                                               Universe

              Full Set of Securities                 High Conviction Sub-Set                 Benchmark
                                                                                              Universe            Select
                                                                                                                  Cross-
                                                                                                                 Universe
                                                                                             Benchmark           Securities
             Benchmark Universe                        Benchmark Universe                     Universe
• Traditional actively managed funds           • High conviction funds choose a sub-set • Thematic funds choose securities
  overweight or underweight securities           of securities, concentrating their bets  across several benchmark universes,
  across the entire benchmark universe to        across a fewer number of names so        uniting those choices by a common
  outperform—this makes for returns              that correct choices can outperform the  characteristic in the pursuit of
  tightly clustered around the benchmark         benchmark by a more significant degree   uncorrelated opportunistic returns

        Actively-Managed                                                                      More Actively-Managed
     Source: Citi Business Advisory Services
12
Growth Accelerates in New Active Fund Categories
Though AUM in traditional long only active core funds rose over the past decade, the pace of
growth trailed those funds that offer more specialized or thematic strategies
AUM Growth 2008 to H1 2018 Market Share Changes • Specialty long funds that include
2008 to H1 2018 high conviction strategies added
+48% +115% 100%
9000 nearly as much AUM as active
90%
Billions of Dollars
8000 27% 35% core funds over the past decade
+$8.6T 80%
7000 70%
+$7.6T • Specialty long funds grew by
6000 60%
50% 115% between 2008 and H1
5000
40% 2018,rising from $6.6 trillion to
4000 73% 65%
30% $14.2 trillion and gaining 8%
3000 market share over active core
20%
2000 10%
1000 0% • Active core grew 47.5% in the
0 2008 H1 2018 corresponding period from $18.0
Active Core Specialty Long (Ex- to $26.6 trillion—losing 8% share
Active Core Specialty Long (ex-ESG)
ESG)
Growth in ESG / Impact Funds
• The most widely recognized category of thematic funds are those 1,550
Billions of Dollars
$1.4T
that isolate companies that lead their industries in environmental,
1,350
societal or governance practices (aka ESG or impact funds)
1,150
• Total AUM has more than doubled in these funds over the past 950
decade, rising to $1.4 trillion in H1 2018
750 $639B
• In our proprietary surveys, Institutional investors cite their belief that 550
these companies will outperform their peers over time due to already
existing practices and investments whereas retail and wealth 350
investors focus on these funds as a way of impacting the world with
their investment dollars
Sources: Top charts: Citi Business Advisory Services analysis based on the Boston Consulting Group Global Asset Management Study 2018, https://www.bcg.com/en-
13 us/publications/2018/global-asset-management-2018-digital-metamorphosis.aspx Bottom Chart: Citi Business Advisory Services analysis based on proprietary data subscriptions to
Morningstar and eVestmentMore Opportunities & Interest in Private Markets
More foundational issues exist in the publicly traded markets beyond a shifting approach to active
management and the move to passive--more and more activity is occurring in the private markets
Dry Powder in Private Equity Investments Downward trend in US & European IPOs
• Ready availability of private capital is allowing more companies to forego the public markets – especially small firms
with valuations below $50 million; more growth opportunities are now only to be found in the private markets
• Many private companies express concern about short-termism in the public markets; institutional investors also see the
focus on short-term financial results as out of sync with what is required to sustain long-term growth
• While cash may be available, staying private makes it harder for their employees to monetize their wealth tied up in
these companies and boxes investors unable to meet suitability thresholds out of many growth opportunities
Source Left Hand Chart: Citi Business Advisory Services Analysis based on proprietary subscription to Preqin. Source Right Hand Chart: Citi Business Advisory Services based on
Dealogic data to 30 June 2017
14Alternative Flows Dominate, Focus on Most Illiquid
Net inflows into Alternative products outstripped passive flows in recent years with 79% of that
money going to the industry’s most illiquid assets in private equity, real estate & infrastructure
Total Industry Net Flows: Active, Passive & Alternative Breakdown of Inflows into Alternatives
2014 to H1 2018 2014 - 1H18 ($4.1Tn)
3,000
Alternatives: +$4.1T
Passive: +$3.8T 1,043 79%
2,000 Active: -$257B Infrastructure
& Real Estate
(USD Billions)
Private Equity $1,221 B
880 812 1,263 30%
907 $2,006 B
1,000 49%
647 927 433 Private Debt
640 679 $467 B
190 282 12%
0 -145
-432 -549
Hedge Funds Liquid Alts
$58 B $323 B
-1,000 1% 8%
2014 2015 2016 2017 1H18
• Global flow data shows that investors have moved into • Flows have not just been directed to alternatives as a
illiquid funds and private markets in their search for yield whole, but into the two most illiquid portions of the
and diversification alternatives space
• While flows into passively traded funds from 2014 to H1 • Private equity inflows totaled $2.0 trillion between 2014
2018 totaled $3.8 trillion, alternative fund flows were +8% and H1 2018 (49%) and real estate and infrastructure
larger at $4.1 trillion in the corresponding period. These accounted for $1.2 trillion (30%)
figures compare to a net outflow of -$257 billion from
actively managed funds
Source left hand chart: Citi Business Advisory Services based on proprietary data subscriptions to Morningstar, eVestment, Simfund, HFR, and Preqin.
15 Right hand chart: Citi Business Advisory Services based on proprietary data subscriptions to Simfund, Preqin and HFR..Demographic Challenges for Industry
Accelerating Baby Boomer retirements are shifting the industry to one where individuals will be
left to manage more of their own money, resulting in less robust and diverse portfolios
Assets Managed for Institutions Less 2017 Portfolio Allocation
Assets Managed for Individuals (US) U.S. Corporate & Public DB Plans vs. IRAs
$7 $6.6T 100%
Baby Boomer Retirements
16.9%
$6 22.2%
$5.3T
$5 Individuals limited
to equity & bonds
$4 50% 97%
Cash
80.1%
74.2%
$3
Alternatives
$2.1T
$2
Equities & Bonds
$1 0%
2007 2008 2009 2010 2011 2012 2013 2014 2015 2016 2017 Corp DB Public DB IRAs
• The bulk of professionally managed U.S. assets are • Institutional investors have shifted a significant share of
invested on behalf of institutions that can use their their portfolio into alternative investments
more sophisticated status to access a wider array of • These alternative investments offer both an illiquidity
illiquid and sophisticated investment options premium and the potential to access cash flows
• With Baby Boomers retiring and pulling their money uncorrelated to listed companies
out of defined benefit and defined contribution plans, • Individuals are limited to such public companies in their
there is a shift underway—by the early 2020s, more investment options and most are over-exposed to only
of the industry’s assets are going to be managed on one real asset—their home
behalf of individuals, not institutions
Sources: Left hand chart: Citi Business Advisory Services analysis based on proprietary data subscription to Cerrulli Associates. Right hand chart: Citi Business Advisory Services analysis
based on proprietary data subscription to Cerulli Associates and on Willis Towers Watson Global Pension Assets Study 2017, https://www.willistowerswatson.com/en/insights/2017/01/global-
16
pensions-asset-study-2017, proprietary subscriptions to Hedge Fund Research (HFR), Morningstar, eVestment, SimFund, and Preqin, http://investments.yale.edu/about-the-yio/Agenda Improved Factor Understanding Drives New Thinking About Portfolio Construction Investors Demonstrate a Significant Shift to Passive Over Actively Managed Funds Actively Managed Funds Re-Align to High Conviction, Thematic & Alternatives Emerging Technologies Offer Potential to Democratize Access to Real Assets 17
Understanding the Architecture Underlying Digital Assets
Early digital assets such as Bit Coin have been greeted with widespread skepticism by many but
the architecture underlying such assets may help democratize access to alternative investments

                              Digital Assets & their Underlying Architecture
                                                                               •   New digital assets have garnered many headlines and
                                                                                   resulted in highly volatile and unregulated parallel capital
     New Products

                                                                                   markets activity
                                                                               •   Regulators are looking into establishing rules for these
                                      Cryptocurrencies      Coin Offerings         markets, but their future is uncertain
                                                                               •   The architecture that these products are built upon,
                                                                                   however, can be levered to create registered investment
                                                                                   products that may democratize access to alternatives

                                                                               •   Big Data & AI Analytics: New technologies developed
                                                                                   by Google allow for the processing of huge, unstructured
                                            Big Data & AI Analytics                data sets and the application of “smart” toolkits such as
                                                                                   machine learning and natural language processing
       Product Architecture

                                                                               •   Smart Contracts: New digital contracts code in the
                                                                                   terms of execution, link such terms to specific data-driven
                                                                                   triggers that can be monitored using Big Data & AI
                                                Smart Contracts                    analytics and allow for the self-execution of those terms
                                                                                   when a trigger is activated

                                                                               •   Distributed Ledgers: Distributed ledgers record
                                                                                   transactions but have 3 advantages over traditional
                                                                                   ledgers: 1) all interested parties can simultaneously see
                                       Blockchain / Distributed Ledgers            transactions; 2) each transaction is secured by two
                                                                                   independently verified crypto-keys; 3) the entire history of
                                                                                   each transaction is contained in each entry
       Source: Citi Business Advisory Services

18
New Shared Ownership Models for Access to Real Assets
Tokenization might enable today’s models around crowd-investing and unitization for ownership of
real assets to extend to a more democratized set of investors with smaller liquidity thresholds
Carve Out Minority Divide Minority Access Natural
Share of a Real Share of Asset Up Level of Demand by
Asset into Individual Units Fractionalizing Unit
• Co-investing in real assets • Unitizing assets entails • Tokenizing each investable unit
features a majority asset owner breaking up the shared allows demand be adjusted down
“sharing” their ownership investable pool into a pre- to fractional bits that can meet
stake with either an outside determined number of fixed trading interest from both large
entity or the crowd pieces and small investors
FRACTIONAL UNITS
TOKENS OF
REAL ASSET
OWNERSHIP
MINORITY MINORITY UNITS OF
SHARE OF SHARE OF REAL ASSET IDENTICAL
REAL ASSET REAL ASSET OWNERSHIP SMART
MAJORTY CONTRACTS
SHARE OF DESCRIBING
REAL ASSET BLOCKCHAIN LEDGER
OWNERSHIP
RIGHTS
SEPARATE ABILITY TO REASSEMBLE
CONTRACT FRACTIONAL UNITS BACK
DESCRIBING SEPARATE STANDARDIZED TO ORIGINAL WHOLE
MINORITY CONTRACTS DESCRIBING
OWNERSHIP RIGHTS UNIT OWNERSHIP RIGHTS
Source: Citi Business Advisory Services
19Opportunity for Financial Instrument Innovation
Survey participants in our Industry Revolution report envision new real asset models and the
blueprint underlying cryptocurrencies to create a new investment instrument--Ownits
New Solution:
• Expand the “shared ownership” model to a broad set of
real assets
• Make this approach affordable by dividing these assets up
into units
New Liquid
• Create a new registered digital token using smart
contracts that define the rights of the unit owners and embed Ownership Units
the contracts into the blockchain (Ownits)
• Facilitate fractionalization and secondary liquidity
• Leverage existing primary and secondary market
transmission mechanisms
Source: Citi Business Advisory Services
20Ownits as New Investment Vehicles
Ownits would create the ability to have a listed ownership unit that offers the owner both financial
and non-financial rights to the underlying asset as well as a set of utilization rights
Model of an Ownit
Ownits may offer a series of financial and non-
financial rights in the underlying asset:
• Financial Rights: Total return investment,
including both cash flow participation and
long-term appreciation of the underlying
asset
• Ownership Rights: The Ownit owner can list
Ownits on their financial statement, pass the
Ownit on to their heirs or choose to transfer
ownership to another holder
• Utilization Rights: Ownit holders could partake
in the utilization of their asset via incentives
such as discounted rates and preferential
consideration for use or access
Source: Citi Business Advisory Services
21Ownits Might Be Used to Solve Many Investor Problems
Both institutional and individual investors may find benefits through the use of real asset tokens
that could both democratize access to new types of investments and support more localization
Use Cases to Highlight Potential of New Investment Template
Pension Plan Supplements Individual Business Owner
Institutional Investor
Liability Shortfall via Finances Capital
Frees Up Liquidity in
Extension of Improvements Through
Existing Real Asset Holding
Utilization Rights Shared Ownership Model
• Problem: Institutional investor • Problem: Pension does not have • Problem: Individual owner
currently owns a real asset such as a sufficient assets to meet their full needs capital to expand or
shopping mall but they need some liability to members improve their business but does
liquidity and do not wish to sell their not want to take on additional
entire stake and/or other investors are • Solution: Pension might invest in debt or partners
against any overall asset sale an asset that individuals could
utilize such as a housing • Solution: Individual could allow
• Solution: Investor might carve out a community and offer members local institutions or a pool of
minority share of their investment and “credits” via tokens to use the individuals to take on a minority
sell the right to participate in their asset/ live in the community to ownership in their business via a
investment to the crowd via a offset owed liabilities tokenized offering
tokenized offering
• Benefit: Long-term asset that • Benefit: Incoming cash for the
• Benefit: Incoming cash for the should generate income and individual business owner and an
institution and an ability for individuals appreciate for pension fund and incentivized pool of local owners
to both own a portion of the property utilization benefit for retired to support their business and
and participate in its revenue- pension member to offset any exposure to a new asset and
generation and appreciation benefit shortfall potential cash flow for investors
Source: Citi Business Advisory Services
22Disclaimer
This communication is provided by a member of the Business Advisory Services Group of Citigroup Global Markets Inc. (together with its affiliates,
"Citi"). For important disclosures and disclaimers please see https://icg.citi.com/icg/data/documents/ST_ExternalDiscl.pdf. This message is for the
internal use of the intended recipients and may contain information proprietary to Citi which may not be reproduced, redistributed, or copied in whole or
in part without Citi's prior consent.
The information contained in this communication is for discussion purposes only. Information provided does not constitute or include professional legal
and tax or any other form of advice and should not be relied on as such.
Information is provided to the recipient solely on the basis that the recipient will make all decisions, regardless of their nature, based on its own
independent evaluation and judgment regarding their appropriateness for the recipient's own business. Any decisions made by the recipient will be
made independently and separate from this communication and any other material provided by Citi, and in reliance on the advice of its other
professional advisors as the recipient may deem necessary and not in reliance on any communication whether written or oral from Citi. Though Citi
hopes its services will be helpful, Citi is not acting as investment advisor or fiduciary to the recipient or its clients, and the recipient's clients are not
third-party beneficiaries of Citi's services. No communication whether written or oral will be understood to be an assurance or guarantee of results.
This communication is provided by Citi on a confidential basis for the recipient's use and may not be publicly disclosed. The information contained
herein (a) is for informational purposes only and may not be publicly disclosed, (b) is not an offer to buy or sell any securities or service, and (c) may
contain estimates and projections which may be incomplete or condensed and may be inaccurate. No representation or warranty, express or implied,
is made as to the accuracy or completeness of the information and nothing herein is, or shall be relied upon as, a representation. Citi has no obligation
to update or otherwise revise any such information.
© 2019 Citigroup Global Markets Inc. Member SIPC. All rights reserved. Citi and Arc Design are trademarks and service marks of Citigroup Inc. or its
affiliates and are used and registered throughout the world.
23You can also read