GLOBAL TRANSPORTATION & LOGISTICS - Overview through FQ4 June 30, 2021 (NYSE American: RLGT)

Page created by Clyde Ortega
 
CONTINUE READING
GLOBAL TRANSPORTATION & LOGISTICS - Overview through FQ4 June 30, 2021 (NYSE American: RLGT)
(NYSE American: RLGT)

GLOBAL TRANSPORTATION & LOGISTICS
Overview through FQ4 June 30, 2021
GLOBAL TRANSPORTATION & LOGISTICS - Overview through FQ4 June 30, 2021 (NYSE American: RLGT)
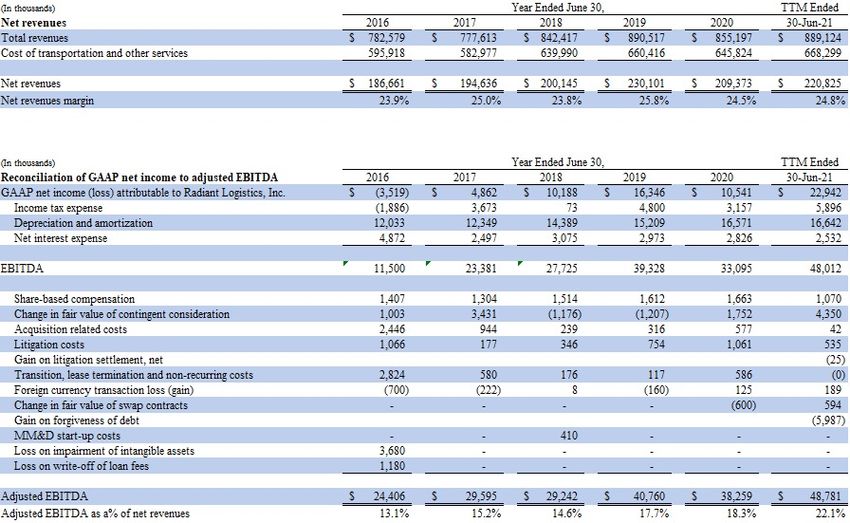
Disclaimer
  FORWARD-LOOKING STATEMENT
This presentation and discussion includes forward-looking statements within the meaning of Section 21E of the Securities Exchange Act of 1934, as amended, and
Section 27A of the Securities Act of 1933, as amended, and such statements are subject to the safe harbor created by those sections and the Private Securities
Litigation Reform Act of 1995, as amended. All statements, other than statements of historical fact, including without limitation statements regarding the financial
position, strategic plan and other plans, projections, future industry characteristics, growth expectations, future ability to identify, consummate, and integrate
acquisitions, and objectives for our future operations, are forward-looking statements. Such statements may be identified by their use of terms or phrases such as
“may,” “could,” “expects,” “estimates,” “projects,” “believes,” “anticipates,” “plans,” “intends,” and similar terms and phrases. Forward-looking statements are
based upon the current beliefs and expectations of our management and are inherently subject to risks and uncertainties, some of which cannot be predicted or
quantified, which could cause future events and actual results to differ materially from those set forth in, contemplated by, or underlying the forward-looking
statements. Although we believe that such forward-looking statements are based on reasonable assumptions, we give no assurance that our expectations will in
fact occur. For examples of risks, uncertainties, and events that may cause our actual results to differ materially from the expectations we describe in our forward-
looking statements, see “Risk Factors” in the prospectus to which this offering relates and the documents incorporated by reference therein. Existing and
prospective investors are cautioned not to place undue reliance on forward-looking statements, which speak only as of the date hereof. We undertake no
obligation to publicly update or revise any forward-looking statements after the date they are made, whether as a result of new information, future events or
otherwise, except for the extent required by applicable securities laws.

  NON-GAAP FINANCIAL DATA
This presentation may include the use of net revenues, EBITDA, adjusted EBITDA, adjusted net income, and adjusted net income per share, which are financial
measures that are not in accordance with generally accepted accounting principles (“GAAP”). Each such measure is a supplemental non-GAAP financial measure
that is used by management and external users of our financial statements, such as industry analysts, investors and lenders. While management believes such
measures are useful for investors, they should not be used as a replacement for financial measures that are in accordance with GAAP.
We define net revenues as revenues less directly related operations and expenses attributed to the company’s services. We define EBITDA to exclude the effects of
preferred stock dividends, interest and taxes, and excludes the “non-cash” effects of depreciation and amortization on long-term assets. Companies have some
discretion as to which elements of depreciation and amortization are excluded in the EBITDA calculation. We exclude all depreciation charges related to furniture
and equipment, all amortization charges, including amortization of leasehold improvements and other intangible assets. We define adjusted EBITDA to exclude
changes in contingent consideration, expenses specifically attributable to acquisitions, severance and lease termination costs, F/X gains and losses, extraordinary
items, share-based compensation expense, non-recurring litigation expenses, and other non-cash charges. For adjusted net income and adjusted net income per
share, management uses a 24.5% tax rate commencing with FY2019 and a 31% tax rate for prior periods for calculating the provision for income taxes before
preferred dividend requirement to normalize the Company's tax rate to that of its competitors and to compare the Company's reporting periods with difference
effective tax rates. In addition, in arriving at adjusted net income, the Company adjusts for significant items that are not part of regular operating activities. These
adjustments include acquisition costs, transition, severance and lease termination costs, non-recurring litigation expenses as well as depreciation and amortization
and certain other non-cash charges.
Our presentation of net revenues, EBITDA, adjusted EBITDA, adjusted net income, and adjusted net income per share should not be construed as an inference that
our results will be unaffected by unusual or non-recurring items. Our computations of net revenue, EBITDA, adjusted EBITDA, adjusted net income, and adjusted
net income per share may not be comparable to other similarly titled measures of other companies.
Reconciliations of our non-GAAP financial measures presented to our GAAP-based financial measures are included on the last slide of this presentation.                     2
GLOBAL TRANSPORTATION & LOGISTICS - Overview through FQ4 June 30, 2021 (NYSE American: RLGT)
Leading Multi-Modal 3PL Service Provider
Radiant is a leading non-asset based provider of domestic and int’l transportation and logistics solutions.
  Ø Radiant provides global supply chain services, including domestic and international air and ocean                                  KEY STATISTICS
    freight forwarding and truckload, less-than-truckload, and intermodal freight brokerage services
       • Strong network of company-owned locations and strategic operating partners (agents) in the United States and                  $889.1M
         Canada as well as additional global partners to facilitate international shipments                                              Gross Revenue
                                                                                                                                       TTM Ended 6/30/21
  Ø Radiant continues to build out a compelling multi-modal offering, leveraging its technology and
    bundling value-added logistics solutions with its core transportation service offerings                                            $220.8M
       • The Company continues to optimize its best-in-class operating platform (people, processes, and technology) in order              Net Revenue
         to provide exceptional operational and back-office infrastructure to its network participants                                 TTM Ended 6/30/21

  Ø The Company has generated impressive financial results, with revenues of $889.1 million, net revenues
    of $220.8 million and adjusted EBITDA of $48.8 million for the trailing twelve months ended Jun. 30,                                $48.8M
    2021.                                                                                                                                 Adj. EBITDA
                                                                                                                                       TTM Ended 6/30/21

NET REVENUE For the Trailing Twelve Months Ended June 30, 2021 ($ in millions)
                                                                                                                                         14.9%
SERVICE OFFERING                                                                                                                          2 0 16-2021
                                                                                                                                         EBITDA CAGR
                                   COMPELLING DIVERSITY OF NET REVENUE BY SERVICE OFFERING
           9%                                                                                           VALUE-ADDED
                                    FREIGHT FORWARDING
     5%
                                                                    BROKERAGE BY MODE
                                                                                                      SERVICE OFFERING                     100+
                                                                                                                3%                       Agent Stations

                                                                          12% 0%                          10%

          $220.8                                                                                                                            20+
                                     40%                                                                                                Company-Owned
                                           $190.4                          $10.5                           $20.0                           Locations
                                                           60%
                     86%                                                                                                                     18
                                                                                   88%                               87%                  Completed
                                                                                                                                          Acquisitions
      Freight Forwardi ng                  Domesti c                     Intermodal              Materials Management & Distribution
      Brokerage                            International                 Truckload               Customs House Brok erage
      Value Added Servi ce (VAS)                                                                 Consulting/Other                                          3
                                                                         Less-Than-Truckload
GLOBAL TRANSPORTATION & LOGISTICS - Overview through FQ4 June 30, 2021 (NYSE American: RLGT)
A Proven Growth Platform

   Since its inception in 2006, Radiant has continued to deliver profitable growth with a track record
   of executing and integrating acquisitions.                                                          $889.1MM
                                                                                                                                                                                                    TTM Ended 6/30/21
                                                                                                                                                                                                         Revenue
                                                                                   FY E 2 0 0 6 – 2 0 2 1
                                                                              T T M E nded 6 / 3 0 C AG R s                                                                                               Friedway
                                                                                        Gross Revenue: 26.4%                                                                                      Enterprises and CIC2
                                                                                                                                                                                                     (Agent stations)
                                                                                         Adj. EBITDA: 34.8%              ~$500MM
                                                                                                                          FY2015 Revenue
                                                                                                                                                                                               Radiant remains
                                                                                                                                                                                               opportunistically acquisitive,
                                                                                                                                                                                               seeking companies with
                                                                                                                                                                                Lomas,         complementary
                                                                                                                                                                              Dedicated
                                                                                                                                                                            Logistics Tech,
                                                                                                                                                                                               geographical and
                                                                                                                                                                                               logistics service
                                                          ~$300MM                                                                  Largest
                                                                                                                                   acquisition to
                                                                                                                                                                               Sandifer
                                                                                                                                                                                Valley         offerings
                                                            FY2012 Revenue
                                                                                                                                   date, providing                         (Agent stations)
                                                                                                                                                            Copper
                                                                                                                                   intermodal                                                                     1+
                                                                                                                                   and brokerage
                                                                                                                                                           Logistics
                                                                                                                                                        (Agent station))
                                                                                                                                                                                                            202
                                                                                                                                   capabilities
                                                                                                               Phoenix Cartage
                                                                                                                                                                                                    0
~$25MM
                                                                                                                (Agent station)
                                                                                                                                                                                              202

                                                                                                                                                                                                         100+
                                                                                                                Don Cameron
FY2006 Revenue
                                                Radiant                                                         & Associates      Highways & Skyways
                                                                                                                                                                                 7
                                                acquires its                                                   (Agent station)       (Agent station)
                                                                                                                                                                           201
                                                first company-                                                                                                                                             Agent
                                                owned
                                                locations                                                                                                                                               Stations and
                                                                                                                                                       2016
                               Radiant
                               embarks on       through DBA               ALBS                                                                                                                           Company
                               multi-brand                              Logistics
                               strategy                              (Agent station)                       2015                                                                                          Locations
        Radiant is
        launched with                                                                           2014                              2015
                                                   ISLA Intl
        initial                                                                  2013
                                                                                                          2014
                                                (Agent station)
        investment in
        AIRGROUP
                                                                                         2013
                                                                  2012
                                             2011
                        2008
   2006

  34 Agent Stations
                                                                                                                                                                                                                          4
GLOBAL TRANSPORTATION & LOGISTICS - Overview through FQ4 June 30, 2021 (NYSE American: RLGT)
A Track Record of Profitable Growth
Radiant has consistently generated solid financial results and is well positioned for future growth.
  Ø For the Trailing Twelve Months Ended June 30, 2021, Radiant generated $220.8 million in net revenue and $48.8
    million in adjusted EBITDA
  Ø A track record of seamlessly integrating company-owned locations and realizing meaningful post-acquisition
    synergies, combined with an active M&A pipeline, creates compelling levers to further accelerate growth
  Ø Radiant’s adjusted EBITDA margin (i.e. adjusted EBITDA as a percentage of net revenues) improved to a record
    22.1% for the Trailing Twelve Months Ended June 30, 2021

 CONSISTENT FINANCIAL PERFORMANCE

        GROSS REVENUE                                          NET REVENUE & NET REVENUE MARGIN                         ADJ. EBITDA & ADJ. EBITDA MARGIN
        For the Fiscal Years Ended 2015 – 2021                 For the Fiscal Years Ended 2015 – 2021                   For the Fiscal Years Ended 2015 – 2021
        ($ in millions)                                        ($ in millions)                                          ($ in millions)

                                                                                             $230.1
                                                                                                      $209.4 $220.8                                                       $48.8
                          $842.4
                                 $890.5 $855.2 $889.1                 $186.7 $194.6 $200.1
                                                                                                                                                      $40.8 $38.3
          $782.6 $777.6
                                                             $123.7                                                                    $29.6 $29.2
                                                                                                                               $24.4
                                                                                                                       $17.3
 $502.7                                                      24.6% 23.9% 25.0% 23.8% 25.8% 24.5% 24.8%                                                     22.1%
                                                                                                                       14.0% 13.1% 15.2% 14.4% 17.7% 18.3%
                                                              15

                                                                     16

                                                                             17

                                                                                      18

                                                                                             19

                                                                                                    20

                                                                                                                        15

                                                                                                                               16

                                                                                                                                      17

                                                                                                                                                18

                                                                                                                                                       19

                                                                                                                                                              20
                                                                                                                  1

                                                                                                                                                                             1
                                                                                                               /2

                                                                                                                                                                          /2
                                                            20

                                                                   20

                                                                           20

                                                                                    20

                                                                                           20

                                                                                                  20

                                                                                                                      20

                                                                                                                             20

                                                                                                                                    20

                                                                                                                                              20

                                                                                                                                                     20

                                                                                                                                                            20
                                                                                                            30

                                                                                                                                                                       30
                                                                                                         6/

                                                                                                                                                                    6/
                                                                                                         M

                                                                                                                                                                    M
                                                                                                      TT

                                                                                                                                                                 TT
 2015     2016    2017     2018    2019    2020     TTM
                                                  6/30/21             Net Revenue            Net Revenue Margin                 Adj. EBITDA          Adj. EBITDA Margin

                                                                                                                                                                                  5
GLOBAL TRANSPORTATION & LOGISTICS - Overview through FQ4 June 30, 2021 (NYSE American: RLGT)
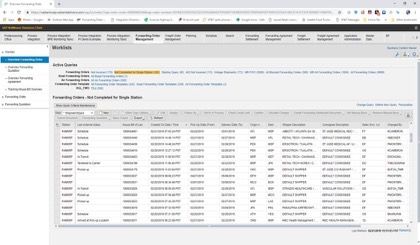
First to Market Advantage

Structural changes within the freight forwarding community, resulting from industry deregulation in the
1970s and the natural “graying” of industry pioneers, provide an opportunity to support the logistics
entrepreneur in transition.

  Ø Radiant enjoys a 10+year first to market                            MULTI-BRAND STRATEGY
    advantage in leveraging a multi-brand strategy to
    consolidate the agent based forwarding
    community
  Ø Uniquely positioned to bring value to the logistics
    entrepreneur
    • Leveraging our status as a public company to provide
      network participants with a framework to share in the
      value that they help create
    • Solid platform in terms of network, people, process
      and technology to “scale” the business
    • Ideal long-term partner in terms of succession
      planning and liquidity

  Ø Systematically, we plan to convert key agent-
    based offices to company-owned offices and
    strategically acquire and integrate other
    additional non-asset based operations
  Ø Radiant has identified and is in varying stages of
    due diligence with a number of potential
    acquisitions

                                                                                                          6
GLOBAL TRANSPORTATION & LOGISTICS - Overview through FQ4 June 30, 2021 (NYSE American: RLGT)
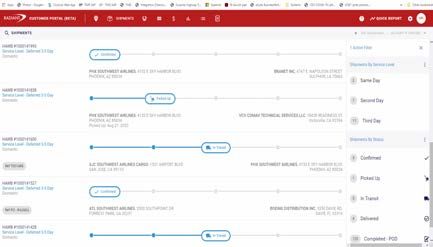
A Robust Technology Platform

 Radiant enjoys a robust, scalable technology platform to support its future growth.
           CUSTOMER PORTAL                                     AGENT PORTAL                               SAP TM ROLL-OUT

                                                                                                Ø Radiant maintains a highly-
                                                                                                  customizable, enterprise IT platform
                                                                                                  to support its multi-brand strategy

                                                                                                Ø The Company has chosen SAP TM as
                                                                                                  its platform going forward and is
                                                                                                  effectively and methodically deploying
                                                                                                  the system across its network

Ø Direct integration with SAP TM                  Ø Robust platform supporting all key modes    Ø The Company’s IT team developed a
Ø Visual tracker providing status of shipments    Ø Separate, integrated modules for booking,     “middleware” solution that allows any
Ø Highly versatile dashboard allows user to         routing, settlement                           TMS to quickly integrate into Radiant’s
  quickly search and filter data to see records                                                   financial system
                                                  Ø User configurable screens and worklists
  for pertinent activities                        Ø Extensive data elements for analytics and     – Acts as a transmission between any
Ø Radiant-developed, with a continuous              customer reporting                              other TMS and SAP ECC and allows
  feature set as business expands                                                                   agent stations and company-owned
                                                                                                    locations to use legacy systems
                                                                                                    concurrently with the new system
 Radiant is one of the first 3PLs in North America to deploy SAP TM, a competitive                  as they transition, facilitating a
 advantage in targeting the installed customer base of shippers operating on SAP.                   seamless integration
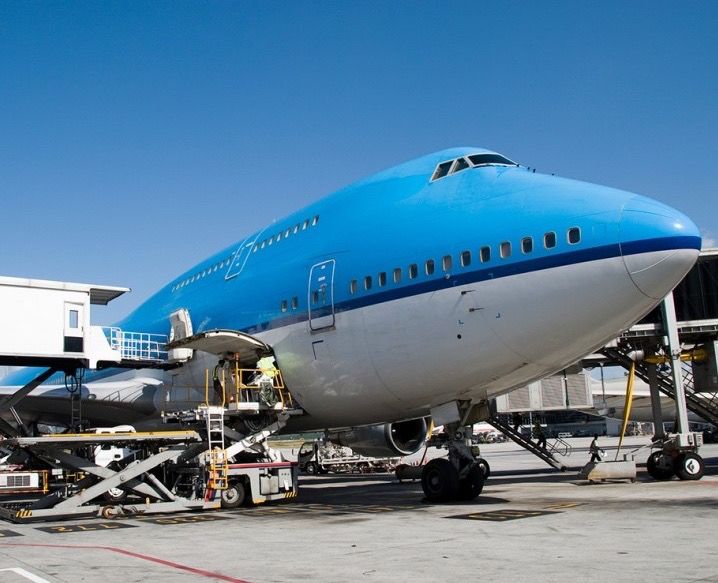
 To meet our current and future growth, Radiant’s production environments are
 deployed in AMAZON WEB SERVICES (AWS). AWS is a premier hyperscaler providing
 stable and scalable global infrastructure with the capabilities to expand our footprint.
                                                                                                                                            7
GLOBAL TRANSPORTATION & LOGISTICS - Overview through FQ4 June 30, 2021 (NYSE American: RLGT)
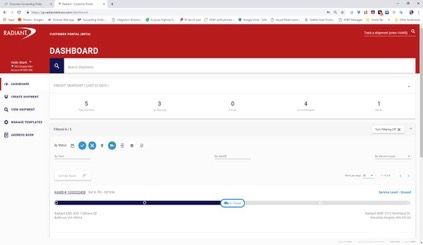
A Talented and Experienced Management Team

Radiant is led by a deep management team with extensive industry experience, a long track record of success
and is aligned with shareholders. The Founder/CEO continues to own ~20% of the shares outstanding.

EXECUTIVE LEADERSHIP TEAM

 Bohn Crain   Todd Macomber       John Sobba          Arnie Goldstein     Mark Rowe           Harry Smit       Tim O’Brien      Christopher Brach
   Founder,    SVP, CFO, and   SVP, General Counsel     SVP and CCO     SVP of Technology   SVP and Country   SVP and General   SVP and General
  Chairman,      Treasurer        and Secretary                             Solutions       Manager, Canada      Manager,       Manager, Clipper
    & CEO                                                                                                       Forwarding
                                               /

                                                                                                                                                    8
Diversified Customer Base

Radiant provides customized time critical domestic and international transportation and logistics solutions to
a diversified customer base of manufacturers, distributors and retailers.

                 HIGHLY DIVERSIFIED CUSTOMER BASE               (1)                                       NET REVENUE BY STATION TYPE                   (1)

     Ø Over 12,000 individual customers
                                                                                                       Agency vs Company-Owned
     Ø No single agency station accounts for more than 6.5%
       of net revenues
     Ø Top 5 agency stations account for less than 20.5% of
       net revenues
     Ø Top 10 customers account for less than 18.5% of net
       revenues
                                                                                                                    47%       $220.8          53%
     Ø No single customer accounts for more than 3.5% of net
       revenues

                                                                                                             Agent Stations        Company-Owned Locations
    (1) For TTM Ended Jun. 30, 2021 and $ in millions

                                                                  INDUSTRIES SERVED

                                                                           Medical,                                                      Trade Shows,
    Aviation         Military &   Manufacturing &
                                                    Industrial & Farm    Healthcare &     Electronics & High Tech   Oil & Gas/Energy       Events &           Retail
  & Automotive      Government    Consumer Goods
                                                                        Pharmaceuticals                                                   Advertising

                                                                                                                                                                       9
Uniquely Positioned in the Marketplace

               UNIQUE MULTI-BRAND STRATEGY
               Ø Radiant has maintained the brands from its agent network acquisitions including AIRGROUP (2006),
                 ADCOM (2008), Distribution by Air (2011), and SBA (2015)
               Ø Provides multiple on-ramps for agents to join the network while centralizing back-office operations and
                 creating a pipeline of attractive tuck-in acquisitions
               Ø Company-owned locations operate as Radiant Global Logistics, including agency locations as they convert
                 to company-owned stores

               SCALABLE INFRASTRUCTURE
               Ø Scalable platform with infrastructure and team in place to support a much larger organization

               Ø Track record of on-boarding acquisitions and capturing significant synergies through absorption of back-
                 office functions

               BEST-IN-CLASS TECHNOLOGY
               Ø Have utilized SAP ERP since inception, providing robust analytics and functionality

               Ø One of the first 3PLs in North America to implement SAP TM, providing seamless integration with the vast
                 universe of shippers operating on SAP

               BUILT-IN ACQUISITION PIPELINE
               Ø Opportunity to continue to selectively convert agent stations to company-owned operations
               Ø Limited integration risk as agent stations are already operating as part of the network
               Ø Incremental cost synergies available at the station level
                                                                                                                            10
Multiple Opportunities for Future Growth

        STR ONG ,                                                                                                                                               S TRONG F REE
       CONSISTENT                                                       SER V IC E                                                                               C ASH F LOW
                                         V E R T IC A L                                            NE W AG E N T                 INTERNA L A ND
       R ECORD O F                                                     O FFERING                                                                                      AND
                                    S PECIALIZATION                                               O NBOARDING                   E X T E R N A L M&A
        OR G A N I C                                                   EXPANSION                                                                                  F INANCIAL
        GR O W T H                                                                                                                                                FLEXIBILITY

Ø Entrepreneurial              Ø Recently initiated vertical   Ø Leveraging competencies    Ø Radiant’s multi-brand         Ø Active M&A pipeline, with    Ø Through the trailing
  characteristics of the         strategy focusing on key        gained through Wheels,       strategy provides a             out-of-network                 twelve months ended
  leading agent-based            end markets such as             Management continues to      number of ways to add           opportunities currently in     June 30, 2021, Radiant
  network, underpinned by        military & government,          build out freight            new agent stations /            progress                       generated $14.1 million in
  Management’s focus on          healthcare & life sciences,     brokerage, intermodal,       locations into the network                                     cash from operations
                                                                                                                            Ø 100+ agent stations
  increasing company-            and humanitarian / NGO,         and value-added services
  owned same-store-sales,        reaping early rewards           to enhance and deepen      Ø The Company’s three             provide embedded             Ø December 2018, Radiant
                                                                                              Regional Vice Presidents        pipeline of potential          redeemed $21.0 million
  provides consistent                                            customer relationships
  organic growth               Ø Former operators in                                          are each charged with           acquisition targets            preferred stock
                                 respective industries serve   Ø Continuing to focus on       recruiting agents to the
                                                                                                                            Ø Opportunity to               Ø Low leverage with $15M
Ø Recent investment in           as vertical experts,            growing through a            Radiant platform.
  Salesforce platform is         providing deep                  strategy of bundling                                         consolidate operations         drawn on $150 million
                                                                                            Ø Incremental cost of             into one of 20+ company-       facility at 6/30/21, not
  expected to drive              institutional knowledge to      value-added logistics
  continued organic growth       agents and internal sales       solutions with its core      supporting the next agent       owned locations provides       including access to an
                                                                                              station is very small           additional synergy             additional $50.0 million
  momentum                       force                           transportation service
                                                                                                                              potential                      accordion feature to
                                                                 offering                   Ø Continuing to replenish a                                      support our future M&A
Ø Recent investment in X-      Ø Vertical experts typically
  suite driving productivity     bring an existing book of     Ø Significant opportunity      pipeline of potential tuck-   Ø U.S. Forwarding, U.S.          activities
                                                                                              in acquisitions as agent        Brokerage and Canada
  gains in the back-office       business with them when         exists to cross-sell                                                                      Ø $100M Equity Shelf
  and margin expansion (adj.     joining Radiant, bolstering     services to existing         stations ultimately             provide three discreet
                                                                                              convert                         platforms to support           declared effective and
  EBITDA as a function of        organic revenue growth          customers only utilizing                                                                    available
  gross margin)                                                  one or two service                                           M&A efforts
                                                                 offerings

                                                                      SCALABLE PLATFORM
            World-class IT system, corporate infrastructure, and multi-brand strategy provide ability to efficiently
                 add new agents to the network, grow existing locations and agents organically, and realize
                                                                                                                                                                                  11
                                      significant back-office synergies from acquisitions
Key Investment Highlights
INVESTMENT HIGHLIGHTS
         LEADING MULTI-MODAL 3PL SERVICE PROVIDER
ü        A PLATFORM FOR GROWTH WITH A PROVEN TRACK RECORD OF PROFITABLE GROWTH THROUGH A NETWORK OF
         COMPANY - OWNED LOCATIONS
                                                                                                                                      120+ AGENT AND

         10+YEAR FIRST              TO MARKET         ADVANTAGE         AND    UNIQUELY POSITIONED                  IN THE MARKETPLACE
ü        T HE PREFERRED PARTNER FOR LOGISTICS ENTREPRENEURS WITH A ROBUST SERVICE OFFERING AND BUILT - IN EXIT STRATEGY FROM ITS
         M ULTI -B RAND P LATFORM
         HIGHLY DIVERSIFIED CUSTOMER BASE
ü        S IGNIFICANT LONG - STANDING CUSTOMER RELATIONSHIPS ACROSS THE PLATFORM – NO ONE CUSTOMER REPRESENTS MORE THAN 5% OF
         T RAILING T WELVE M ONTHS E NDED J UN . 30, 2021 N ET R EVENUE
         ROBUST IT PLATFORM
ü        M EANINGFUL INVESTMENTS IN IT INFRASTRUCTURE TO SUPPORT SCALE AND ENHANCE OPERATIONAL EXECUTION AND EFFICIENCIES
         TALENTED           AND   EXPERIENCED MANAGEMENT TEAM                        WITH    SIGNIFICANT            EQUITY OWNERSHIP
ü        M ANAGEMENT HAS DEEP EXPERIENCE AND ALIGNED WITH SHAREHOLDERS ( FOUNDER /CEO OWNS ~20% OF THE SHARES OUTSTANDING ) IS
         COMMITTED TO CONTINUING TO GROW THE PLATFORM

         MULTIPLE OPPORTUNITIES                    FOR     FUTURE GROWTH           AND      MARGIN EXPANSION
ü        SCALABLE PLATFORM IN TERMS OF PEOPLE , PROCESS AND TECHNOLOGY WITH FINANCIAL FLEXIBILITY ( LOW LEVERAGE AND
         SHELF ) TO SUPPORT M&A
                                                                                                                                                     $100M EQUITY

ATTRACTIVE GROWTH TRAJECTORY
                                                                                                                                  $842       $891          $855   $889
 GROSS REVENUE                                                          FY E 2 0 0 6 – T T M E nded                                            $33          $31     $30
                                                                                                                       $778         $25
 For the Fiscal Years Ending 2006 – 2021 ($ in millions)                    6 / 3 0 / 2 1 C AG R s       $783                                                       $97
                                                                                                                                   $210        $207        $161
                                                                          Gross Revenue: 26.4%               $245       $224

                                                                                                                                                           $664    $762
                                                                                                                        $554       $608        $650
                                  $137      $147                                                $503         $538
$26         $76      $100                                        $297       $311     $349
                                                        $204

2006      2007       2008         2009      2010        2011     2012       2013     2014       2015         2016       2017       2018       2019         2020     TTM
                                                                                                                                                                  6/30/21
                            Freight Forwardi ng Gross Revenues     Brokerage and Intermodal Gross Revenues          Value Added Servi ces Gross Revenues                  12
Reconciliations of Non-GAAP Financial Measures
Reconciliation of Total Revenues to Net Revenues, Net Income Allocable to Common Stockholders
to EBITDA and Adjusted EBITDA.

                                                                                                13
®
It’s the Network that Delivers!

          THANK YOU
You can also read