INVESTOR PRESENTATION - FEBRUARY, 2021 - AWS

Page created by Peter Mcdonald
 
CONTINUE READING
INVESTOR PRESENTATION - FEBRUARY, 2021 - AWS
INVESTOR PRESENTATION
               FEBRUARY, 2021
INVESTOR PRESENTATION - FEBRUARY, 2021 - AWS
The information presented here may include statements regarding future
events and / or projected financial results. The results obtained may differ from
those projected in this presentation because they are subject to risks and
uncertainty that may change based on various factors that are not under the
control of the Company.
INVESTOR PRESENTATION - FEBRUARY, 2021 - AWS
1

Revolutionizing

How Consumers Shop

For Household Products
INVESTOR PRESENTATION - FEBRUARY, 2021 - AWS
2

                                     Powerful Distribution Model
                                      ●   Two-Tier Independent Distributors and Associates
                                      ●   Compelling Primary or Secondary Income Opportunity
                                      ●   Convenient Work from Home
                                      ●   Technology Based Ordering and Delivering

     Key Investment
                                     Critical Mass with Significant White Space potential
     Highlights
                                      ●   59.7K Distributors and 1.23M Associates

                                      ●   20% Household Penetration in Mexico

                                     Outstanding Track Record of Sales and Earnings Growth

                                     Asset light Business with High Free Cash Conversion
For more information, please go to
our Investor Relations website,
ri.betterware.com.mx                 Talented Management Team
INVESTOR PRESENTATION - FEBRUARY, 2021 - AWS
3
                                            Betterware At A Glance

                  Key Facts (as of 01/31/2021)
                  Stock Price                                  $36.00 USD
                  Market Capitalization                        $1,317M USD
                  FY2021 Guidance
                  Net Revenue                               $10,100M - $11,100M
                  EBITDA                                    $3,000M - $3,300M
                  EBITDA Margin                                   29.7%
                  CAPEX                                           $460M

Notes: i ) Financial information in Mexican Pesos                                 Source: Management
INVESTOR PRESENTATION - FEBRUARY, 2021 - AWS
4
   Powerful Distribution Network Model

                           Overview                                   Two-Tier Distribution Network

      59.7k Distributors                                                                                             Rewards for Distributors
  ▪   82% of Distributors place orders every week
  ▪   Average weekly order ticket of ~US$390 (MXN$7.8K)                                                              •     12-16% discount     on   its
                                                                                                                           Associates’ sales
  ▪   High tenure                                                                        1   Distributor places      •     20-40%     of  Betterware
                                                                                             orders to Betterware          Points   earned by its
                                                                                                                           Associates
      1.23m Associates
                                                                   Distributor
  ▪   Place orders to their assigned distributor and are either
      final consumers or the selling point with other clients
                                                                                                       Distributor sells to a pool of Associates
  ▪   Do not receive commissions and are not paid for recruiting                                   2
                                                                       Recruited                       (19 on average)

                                                                                                                     Rewards for Associates

                                                                                                                    •    24% discount on product
Source: Management, as of December 31st, 2020                                                                            purchases
Note: Associates need to recruit 3 individuals and                           Associates           Referred
purchase a minimum of US$125 in order to upgrade                                                                    •    1 Betterware Point for
to Distributor level                                                                                                     every MXN$1 of purchase
                                                                     3   Associates purchase and sell products
INVESTOR PRESENTATION - FEBRUARY, 2021 - AWS
Critical Mass with Significant White                                                                                      5

Space Potential

 Business is highly     Strong distributor and    Innovation supports      Increased technology      New marketing to
consistent and easily    associate growth in     continued expansion in   support including web       drive increased
 replicated in new      2020 – paves the way        existing and new      platform upgrade and          awareness
      markets           for continued double            categories        digital app to increased
                           digit sales gains                                        sales

                                                                                                          Source: Management
INVESTOR PRESENTATION - FEBRUARY, 2021 - AWS
Unparalleled Business Intelligence Unit                                                                           6

                                     Best-in-class Technological Tools

      Clear Strategy                         Product Intelligence                   Tight Monitoring

    Well-mapped distribution             Extensive product analysis to          Proprietary live performance
     network location and                   track performance and                    tracking platform
     penetration by socio-                 instant market reactions
       economic region.                                                     •    Weekly performance
                                         •   Strategy to create highly-          monitoring against sales
•   Locate areas within the                  competitive and innovative          objectives
    business model scope                     products                       •    Detailed information of each
•   Identify nearby distributors         •   Provide distribution network        distributor number of orders,
•   Contact distributor to trigger           with top-quality products to        average ticket, type of items,
    the recruitment of associates            attract new customers               among others
    or cover the identified zone         •   Big data analysis of client    •    Adjusting objectives based
                                             behavior                            on live performance

                                                                                                  Source: Management
INVESTOR PRESENTATION - FEBRUARY, 2021 - AWS
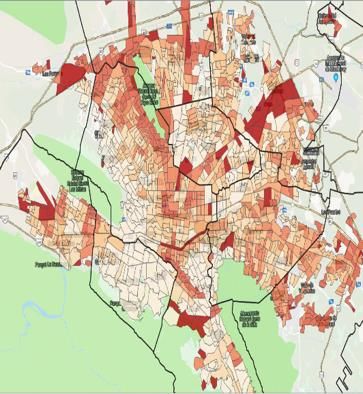
Unparalleled Business Intelligence Unit                           7

1                                                                 1
                                     Circles represent a
Target areas by socio                 distributor. Color scales
economic segments                    indicate current week ’s
                                     performance vs target
                                     sales

2                                                                 2
Color scales represent               Separated areas to assign
        the segments’                responsibilities to
    acquisition power                Company’s development
                                     managers

                                               Source: Management
INVESTOR PRESENTATION - FEBRUARY, 2021 - AWS
Demonstrated Performance in                                                                                                                     8

  New Markets
                                                          Growth Roadmap

Well-mapped execution                   Deployment of                   Detailed geographic        Guatemala profitable   Possible New Markets:
plan focused on new and              distributors to cover                  mapping helps           in less than a year    Panama, Costa Rica,
    underpenetrated                 new zones and spark               distributors to grow their                           Colombia and Peru
     neighborhoods                  associate recruitment              productivity and avoid
                                                                            cannibalization

(1) Coverage areas are considered where at least one transaction is
done during the year                                                                                                              Source: Management
9
Growth Opportunities

            Organic                                          Inorganic
     Room to grow:                      M&A:
 ●   Low household penetration (20%).    ● Replicate our business model to accelerate growth in
 ●   Low Share of Wallet (20%).                 other Direct-to-Consumer companies

                                          ●     Expand our category offering within the household
                                                through acquisitions

                     Market
                    potencial
                                        Geographic Expansion:
                                         • Identify the right partners to replicate our business
                                              model:
                                          • Colombia and Peru
                                              (2/3 of Mexican market size)
10
Category Expansion
                                                  +300 New Products
Overview                                               per Year
•   Six different categories are offered in the
    product portfolio, all focused on the
    home organization segment

•   Pricing strategy that optimizes revenue
    and margins, and limits inventory left-
    overs

•   Continuous product innovation and
    development, backed by a data analytics
    unit focused on revitalizing the
    catalogue content, to attract repeated
    purchases
Category Expansion                                                    11

 Net Company Sales by Category

Kitchen                    Home             Commuting
                     35%              20%                          11%

Laundry & Cleaning         Bathroom         Bedroom
                     11%              12%                          11%

                                                        Source: Management
New Corporate Headquarter Campus Allows for Increased Efficiencies                                                                             12

Optimized process

             Manufacturing                                  Warehousing                                        Distribution

                                                ▪   Betterware has a warehouse facility
                                                                                                 ▪   Betterware ships to distributors once a
                                                    where it receives all products imported
▪Betterware’s products are designed and                                                              week through third-party companies
                                                    from China (that arrive at the Manzanillo
branded by the Company but                                                                           with whom the Company maintains
                                                    port)
manufactured by third party factories                                                                strong working relationships
certified under Betterware’s quality            ▪   The products are then shipped to the         ▪   The distributor personally delivers orders
standards.                                          Company’s distribution center in                 to each of its associates, whom in turn
                                                    Guadalajara                                      deliver to final customers, eliminating last
▪Approximately 90% of its products are          ▪   In the distribution center, the Company’s        mile costs for the Company
manufactured in China and 10%                       assembly line sets up packages to be         ▪   The distribution center also stores and
domestically                                        sent to distributors by region on a weekly       ships reward products to the distribution
                                                    basis                                            network
▪Our office in Ningbo (China) is in charge of                                                    ▪   Key metrics
                                                ▪   Key Metrics
factory certification, product quality
                                                      ▪    99.97% service level                         ▪    98.5% on-time delivery
assurance and product innovation
                                                      ▪    80-day service level inventory               ▪    24-48hrs. delivery time
                                                      ▪    1.4% excess inventory                        ▪    Long-haul distribution costs
                                                      ▪    0.58% defective claims                            account for ̴4% of net sales

Accelerated growth in 2020 impacted service levels, but the company was able to adapt and
reach historic service levels by the end of 3Q20.                                                                           Source: Management
Closer Connection to Consumers                                        13

Current Status and Main Objectives
▪On December 8th, Betterware launched its B2C web app platform
nationwide

▪E-commerce    platform is an additional selling channel and
important tool which will:
✓     Attract new customers and enter untapped market segments
✓     Increase Big Data analytics and client behavior understanding
✓     Selling process automatization and efficiency in operations

▪   The Distribution Network will receive the same compensation for
    the sales through the app as sales done through direct-selling
    catalogues

▪   Payment flexibility by credit card or cash to Distributor
Closer Connection to Consumers                                                                    14

                                       How it Works

1   Customer makes         2       App locates
                                                       3     Betterware delivers   4       Customer receives
    purchase order                                           the products to the            products from
    through the app             closest Distributor                                           Distributor
                                                                 Distributor

                                                       Distributor

                                                                                     Distributor   Customer

Distributors and Associates are also able to share a Personal Link with their customers, so their purchases
are automatically assigned to the distributor or associate, who gets the benefits of that sale.
15
Technology and Marketing

                     Marketing               Business         Service
    Sales
                                           Intelligence

 BetterNet              Pipeline

    Orders          Generation of ideas     Data mining       Servicing
    Awards        Commercial evaluations   Online reporting   Delivery
  Notifications    Quotes and samples        Forecasting        WMS
  Monitoring         Report of Status          Machine
   Benefits                                    Learning
16
Talented Management Team

        LUIS CAMPOS                            ANDRES CAMPOS                          DIANA JONES                         MAURICIO ÁLVAREZ                                LUIS LOZADA
     EXECUTIVE CHAIRMAN                 CHIEF EXECUTIVE OFFICER (CEO)        CHIEF FINANCIAL OFFICER (CFO)            CHIEF INFORMATION OFFICER                   CHIEF STRATEGY OFFICER (CSO)
                                                                                                                                 (CIO)
Mr. Campos has been in the direct-      Mr. Campos has been CEO of           Diana Karina Jones Villalpando has                                                  Luis Lozada joined Betterware in
to-consumer sales business for          Betterware de Mexico since 2018.     served as Betterware CFO since         Mauricio Alvarez Morphy joined the           January 2021, as Chief Strategy
almost 25 years. He has been            Prior to becoming CEO, within the    2020.    Mrs.    Jones    previously   company as CIO in August 2020                Officer. Prior to Betterware, Mr.
Chairman of Betterware de Mexico        Company, Mr. Campos served as        performed       as     Betterware's    responsible        for       information     Lozada was an Associate Partner
since he bought the Company in          Commercial Director (2014 – 2018)                                           technology spanning applications,
                                                                             Director of Comptroller (2018-2019)                                                 with Bain & Company, where he
2001. Prior to Betterware, Mr.
                                        and Strategy and New Businesses                                             data,         cybersecurity           and
Campos served as Chairman of                                                 and Director of Finance Planning       infrastructure, all a vital part of nearly
                                                                                                                                                                 worked for almost fifteen years
Tupperware Americas (1994 – 1999),      Director (2012 – 2014). Prior to     (2019-2020). Prior joining the                                                      (2006 – 2020) advising senior
                                                                                                                    every aspect of our customer and
Chairman of Sara Lee — House of         Betterware, Mr. Campos worked in     Company, she worked as Director        service experience. Mauricio joined          executives     of    multi   national
Fuller Mexico (1991 – 1993), and        the Corporate Banking area of        of External Audit in KPMG              Betterware       from       multinational    companies on a variety of
Chairman of Hasbro Mexico (1984 –       Grupo Financiero Banamex (2005       Cardenas Dosal, S.C., (2003-2018),                                                  management topics. Mr. Lozada’s
                                                                                                                    customer       experience       company
1990). Mr. Campos is an active          – 2010) and in KPMG as an Auditor    including a term at New York City      Atento     where      he     was     Chief   area of expertise resides on
member of the advisory board of
                                        (2004 – 2005). Mr. Campos holds a    from 2008 to 2010. Mrs. Jones          Information Officer for the US,              business          strategy       and
Grupo Financiero Banamex and he
was an active member of the Direct      bachelor’s degree in Business        holds    a    degree    in   Public    Mexico     and      Central      America.    performance improvement, with
Selling   Association,   the    Latin   Administration from Monterrey        Accounting and Finance from the        Previous to Atento, Mauricio co-             retail    and       consumer-goods
America Regional Managers’ Club,        Institute of Technology and          Monterrey Institute of Technology      founded Flip Technologies, a SaaS            companies Mr. Lozada holds a
the Conference Board and the            Higher      Education   (Instituto   and Higher Education (ITESM), as       provider for non profit organizations        bachelors degree in Chemical
Communications               Council.   Tecnologico     y   de   Estudios    well as an MBA with specialty in       and held various IT & Innovation             Engineering       from     Monterrey
Additionally, he has performed as                                                                                   leadership     roles     of    increasing
                                        Superiores    de    Monterrey    –   Finance       from       Tecmilenio                                                 Institute of Technology and Higher
board member of the Economic                                                                                        responsibility at The Coca-Cola
Development Commission of Mid           “ITESM”) and an MBA from Cornell     University. She is also a Certified                                                 Education (Instituto Tecnologico y
                                                                                                                    Company globally. Mauricio holds a
Florida,   Casa    Alianza-Covenant     University.                          Public Accountant on behalf of                                                      de     Estudios      Superiores    de
                                                                                                                    bachelor’s degree in Computer
House,     the    Metro      Orlando                                         the Mexican Institute of Public                                                     Monterrey – “ITESM”) and an MBA
                                                                                                                    Systems     from      the    Universidad
International Affairs Commission,                                            Accountants.                                                                        from         Cornell       University.
                                                                                                                    Iberoamericana in Mexico City.
SunTrust Bank and Casa de Mexico
de la Florida Central, Inc.
17

                                     Powerful Distribution Model
                                      ●   Two-Tier Independent Distributors and Associates
                                      ●   Compelling Primary or Secondary Income Opportunity
                                      ●   Convenient Work from Home
                                      ●   Technology Based Ordering and Delivering

     Key Investment
                                     Critical Mass with Significant White Space potential
     Highlights
                                      ●   59.7K Distributors and 1.23M Associates

                                      ●   20% Household Penetration in Mexico

                                     Outstanding Track Record of Sales and Earnings Growth

                                     Asset light Business with High Free Cash Conversion
For more information, please go to
our Investor Relations website,
ri.betterware.com.mx                 Talented Management Team
18

Financial
Overview
Q420 Results Demonstrates Business                                                             19

     Resiliency Amid COVID-19
   Announced Record Fourth Quarter Fiscal Year 2020 Financial Results

Q4 2020 vs. Prior-Year Quarter ($ in Pesos)
                                                         229% increase over Q4 2019
    Q4 2020 Net Revenue       $2,601 million
                                                         Includes additional week in Q4 2020
  Q4 2020 Comparable Net
                              $2,441 million             209% increase over Q4 2019
         Revenue
                              $807 million or up 220
                                                         254% increase over Q4 2019
      Q4 2020 EBITDA          basis points to 31.0% of
                                                         Includes additional week in Q4 2020
                              Revenue

 Q4 2020 Comparable EBITDA    $744 million               226% increase over Q4 2019

        Q4 2020 EPS           $1.49                      Includes non-cash expenses.

    Q4 2020 Adjusted EPS      $18.64                     448% increase over Q4 2019
    Q4 2020 Distributors      59.7 thousand              187% increase over Q4 2019
     Q4 2020 Associates       1.23 million               195% increase over Q4 2019
Results for FY2020 Demonstrate                                     20
Business Resiliency Amid COVID-19

FY 2020:
•   Net revenues increased 135% to Ps. $7,260 million driven by
    an increase in distributors and associates, which led to a
    147% increase in volume to 133.7 million units. Comparable
    Net Revenue increased 130% to Ps. $7,100 million.

•   Gross margin was 54.7%, compared to 58.5% in 2019 mainly
    due to the increase in air freight incurred to meet demand,
    and to a lesser extent due to a depreciation of the Mexican
    peso compared to the US Dollar.

•   EBITDA increased by 154% EBITDA margin was 29.8%.
    Comparable EBITDA increased by 147%.

•   Adjusted EPS increased to Ps. $43.36, compared to Ps. $14.31
    of 2019.
Historical Financial Overview                                                                                              21

                Distributors and Associates                                                                          Net Company Sales
    (In ‘000s)                                                                                     (Ps. Millions)
                                                          1,290                                                                       +46% vs 2020
                                                                                   1,290

                                                         1,231

                                                                         438       1,230
                                             438
                                                                                                                                            10,600
                                343
                                                                          417
                                                                                                                                    7,260
                    213                                                                                                                                      2,601
                                             417
        162                     325
                    201                                                                                                     3,085
       152                                                                                                          2,317
                                                                                                1,063    1,450                                        791
                    12          18           21           60                        60
       10                                                                 21
      2016         2017        2018         2019         2020           4Q19      4Q20           2016    2017       2018    2019    2020    2021E
                                                                                                                                                      4Q19 4Q20

                                                                                                Net Company Sales 2021 calculated with the mid-point of the Guidance

Source: Management
1. Net Company Sales: Revenue after VAT, returns and discounts to Distributors and Associates
Notes: i) Financial information under Mexican GAAP basis
Historical Financial Overview                                                                                        22

         Gross Margin and EBITDA Margin2                                                                            EBITDA Evolution
                                                                                                  (Ps. Millions)                    +46% vs 2020
                                                                                                                                        3,150

                     62.1%
      59.8%                          59.6%          58.5%                         57.0%                                          2,164
                                                                   54.7%                                                                                 807
                                                                                   1,140

                                                                                                                          851
                                                                         408
                                                                   29.8%           29.7%                           578
                                                    27.6%
      23.6%          24.5%          24.9%                                                                                                          228
                                                                                                        355
                                                                                                251

       2016           2017            2018           2019           2020           2021E                                                           4Q19 4Q20
                                                                                                2016   2017        2018   2019   2020    2021E

EBITDA and EBITDA Margin calculated with the mid-point of the Guidance
Source: Management
1. Net Company Sales: Revenue after VAT, returns and discounts to Distributors and Associates
2. Over Net Company Sales
Notes: i) Financial information under Mexican GAAP basis
Historical Financial Overview (Cont’d)                                                                                        23

                                                     Strong Balance Sheet and Cash Generation

                ▪      Capex requirements are low, estimated CAPEX of Ps. $460M for 2021.
                                                                                   1,140
                ▪      Minimal working capital needs with suppliers fully financing the inventory and
                       receivables cycle.
                                                                         408
                ▪      Betterware has a solid balance sheet with a healthy net leverage ratio (Net
                       Debt / EBITDA) of -0.01x, as of December 2020

Source: Management
1. Net Company Sales: Revenue after VAT, returns and discounts to Distributors and Associates
2. Over Net Company Sales
                                                                                                Notes: Financial information under Mexican GAAP basis
Notes: i) Financial information under Mexican GAAP basis
Historical Financial Overview (Cont’d)                                                                                              24

             Adjusted Levered Free Cash Flow1                                    Working Capital2 & Cash Conversion

         (Ps. Millions)                                                         (Ps. Millions)                    Days of Cash Conversion Cycle
  1400

  1200

                                                                       65%      69
                                                                                69          12
                                                                                            12      -8
                                                                                                    -8            -20
                                                                                                                  -24           -30
                                                                                                                                 1             -8
                                                                                                                                               7
  1000

                          59%                              59%
           54%                                     54%                          4.4%       6.2%    -2.6%        -3.7%         -7.0%        -6.0%
                                                                        1,140
                                    44%
  800

                                                                                                                                                      -1000.0%

                                                                       2,050                                                                          -3000.0%

                                                                                $46.4      $91.7
  600

                                                                                                                                                      -5000.0%

                                                           1,266 408                               -$50.0
                                                                                                                                                      -7000.0%

  400

                                                                                                                -$61.7        -$504       -$670.0     -9000.0%

                                                    457
                                                                                                                                                      -11000.0%

  200

                                     273
                                                                                                                                                      -13000.0%

            135           228                                                                                                                         -15000.0%

     0

                                                                                2016        2017   2018          2019          2020        2021E
           2016           2017      2018           2019    2020        2021E

Source: Management
1. Adj. Levered FCF as % of EBITDA
2.Working Capital as % of Net Revenue
                                                                                                    Notes: Financial information under Mexican GAAP basis
Notes: i) Financial information under Mexican GAAP basis
25
SPAC Total Return for Completed Business Combination in Q1 2020

Total return calculated from closing of SPAC merger through
December 31, 2020

                                                                                                          Of the 65 SPACS that
 350%                                                                                                      completed business
           297%                                                                                       combinations in 2020, trading
 300%
                                                                                                      on US exchanges, BWMX was
 250%                                                                                                 the highest performing SPAC
 200%                                                                                                     with a 297% increase
 150%               110%
 100%
                             45%
  50%
                                       5%
   0%
                                                                                                        BWMX Betterrware de México
                                                -2%      -5%                                            VVNT Vivint Smart Home,Inc.
 -50%                                                            -18%     -30%                          VRT  Vertlv HoldIngs Co.
-100%                                                                              -60%                 GDYN Grid Dynamics Holdings
                                                                                                        IGIC International General Insurance HoldIngs
                                                                                            -91%        ALTG Alta Equipment Group, Inc.
-150%                                                                                                   PAE  PAE Inconrporated
           BWMX     VVNT     VRT      GDYN     IGIC     ALTG      PAE     ATCX     GSMG     METX        ATCX Atlas Technical Consultants, Inc.
                                                                                                        GSMG Glory Star New Media Group HoldIngs Ltd.
          03/12/20 01/17/20 02/07/20 03/05/20 03/17/20 02/14/20 02/10/20 02/14/20 02/15/20 03/30/20     METX Meten EdtechX Education Group LTd

Source: Bloomberg
26
Thank you for
your attention!
Our commitment is to keep you
informed.

INVESTOR RELATIONS
ir@better.com.mx
+52 (33) 3836-0500
https://ri.betterware.com.mx/
You can also read