NINE ENERGY SERVICE INVESTOR PRESENTATION JUNE 2018
←
→
Page content transcription
If your browser does not render page correctly, please read the page content below
NINE ENERGY SERVICE
INVESTOR PRESENTATION
JUNE 2018

                        1
DISCLAIMER
Forward-Looking Statements & Non-GAAP Financial Measures
Certain statements in this presentation are forward-looking statements that are subject to a number of risks and uncertainties, many of which are beyond our
control. All statements, other than statements of historical fact included in this presentation, regarding our strategy, future operations, financial position,
estimated revenues and losses, projected costs, prospects, plans and objectives of management are forward-looking statements. When used in this
presentation, the words “could,” “believe,” “anticipate,” “intend,” “estimate,” “expect,” “may,” “continue,” “predict,” “potential,” “project” and similar
expressions are intended to identify forward-looking statements, although not all forward-looking statements contain such identifying words. Forward-
looking statements may include statements about the volatility of future oil and natural gas prices; our ability to successfully manage our growth, including
risks and uncertainties associated with integrating and retaining key employees of the businesses we acquire; availability of skilled and qualified labor and key
management personnel; our ability to accurately predict customer demand; competition in our industry; governmental regulation and taxation of the oil and
natural gas industry; environmental liabilities; our ability to implement new technologies and services; availability and terms of capital; general economic
conditions; operating hazards inherent in our industry; our financial strategy, budget, projections, operating results, cash flows and liquidity; and our plans,
business strategy and objectives, expectations and intentions that are not historical. Although we believe that our plans, intentions and expectations reflected
in or suggested by the forward-looking statements contained herein are reasonable, we can give no assurance that these plans, intentions or expectations will
be achieved.

For additional information regarding known material factors that could affect our operating results and performance, please see our final IPO prospectus,
Current Reports on Form 8-K, Annual Report on Form 10-K and Quarterly Reports on Form 10-Q which are available at the SEC’s website,
http://www.sec.gov. Should one or more of these known material risks occur, or should the underlying assumptions change or prove incorrect, our actual
results, performance, achievements or plans could differ materially from those expressed or implied in any forward-looking statement. Readers are cautioned
not to place undue reliance on forward-looking statements, which speak only as of the date hereof. All subsequent written or oral forward-looking statements
concerning us are expressly qualified in their entirety by the cautionary statements above. We undertake no obligation to publicly update or revise any
forward-looking statements after the date they are made, whether as a result of new information, future events or otherwise, except as required by law. All
information in this presentation is as of March 31, 2018 or December 31, 2017 as indicated unless otherwise noted.

In addition to reporting financial results in accordance with GAAP, the Company has presented Adjusted EBITDA, Adjusted EBITDA margin and return on
invested capital (ROIC). These are not recognized measures under, or an alternative to, GAAP. The Company’s management believes that this presentation
provides useful information to management, analysts and investors regarding certain additional financial and business trends relating to its results of
operations and financial condition. In addition, management uses these measures for reviewing the financial results of the Company. These non-GAAP
measures are intended to provide additional information only and do not have any standard meaning prescribed by GAAP. Use of these terms may differ from
similar measures reported by other companies. In particular, because of its limitations, Adjusted EBITDA should not be considered as a measure of
discretionary cash available to use to reinvest in growth of the Company’s business, or as a measure of cash that will be available to meet the Company’s
obligations. These non-GAAP measures have limitations as an analytical tool, and you should not consider them in isolation or as a substitute for analysis of
the Company’s results as reported under GAAP.

Industry and Market Data
This presentation includes market data and other statistical information from third party sources, including independent industry publications, government
publications and other published independent sources. Although the Company believes these third party sources are reliable as of their respective dates, the
Company has not independently verified the accuracy or completeness of this information.

                                                                                                                                                                2
COMPANY OVERVIEW

NINE COMPANY OVERVIEW
  OUR COMPANY
  •    Focused on ROIC – 2018 target of 8%
  •    100% onshore North America with leverage to increasing completion intensity
  •    Super lateral, deep reach capable service offering and focus

  •    Agnostic to completion style – plug and perf (94%1 of horizontal market) and sleeve
       completions (6%1 of horizontal market)

                    SIGNIFICANT EARNINGS POTENTIAL                                                                          100% ONSHORE NAM EXPOSURE
                                                                                                                         Stage count and lateral length levered
                                                                                                                             2017 Revenue by segment3
                      $846

                                 Adj.
                                 EBITDA                                                                                                 Production
                                                                                                                                         Solutions
                                 Margin                         $544       Adj.                                                            14%
                                 28%                                       EBITDA
                                                                           Margin
                                  $239                                     11%
                                                                                                                                                  Completion
                                                                              $60                                                                  Solutions
                     Revenue   Adj. EBITDA                     Revenue   Adj. EBITDA                                                                 86%
                                         2
            2H 2014A Annualized ($mm)                                  2017

1Spears  and Associates. 2Revenue and Adjusted EBITDA annualized by doubling second half 2014. Second half 2014 annualized information is presented for informational purposes only to
reflect the impact of Crest Pumping Technologies, Dak-Tana, RedZone Coil Tubing and Big Lake Services, LLC for a full 12-month period. We believe that presenting investors with the
annualized information for the six months ended December 31, 2014 provides a representative period of the profitability of our business in a high demand environment, including six months of
results from the acquisitions of Dak-Tana Wireline, Crest Pumping Technologies and RedZone Coil Tubing and the results of the acquisition of Big Lake Services, LLC from August 29, 2014        4
through December 31, 2014. Such information does not reflect the actual results for 2014 had such transactions been consummated on any particular date. Adjusted EBITDA and Adjusted
EBITDA margin are not measures calculated in accordance with GAAP. See appendix for an Adjusted EBITDA reconciliation; 3Financials based on full year 2017.
TECHNOLOGY-DRIVEN COMPLETIONS OFFERING
    Nine is capable of addressing 100% of the onshore wells drilled in North America, regardless of completion type

   PRE & POST STIMULATION                                    HORIZONTAL LATERAL                                        TOE OF THE WELL
                                                 Large Diameter Coil + Memory Tools

Long-string
Cementing

                                             Offering includes tools & equipment capable of                    Extremely reliable in super
                                                 completing super laterals (10,000 ft.+)                          laterals (10,000 ft.+)
               Proprietary
                     Liner
                  Hanger
                     Tools

                                             Scorpion Composite Plug–      EON Ball Drop Sleeve System–
                                                                                                                SmartStart – Strategic alliance
                                                     Owned IP                   Strategic Alliance

                                             Scorpion Dissolvable Plug–        Coil Activated Frac Sleeve –
                                                     Owned IP                       Strategic Alliance              FlowGun – Owned IP

       BreakthruTM Casing Flotation Device

                                                           MorphPackers StormTM Re-frac Packer –
                                                                    Strategic Alliance

  2018E New US HZ Wells Drilled: 20,6751               2018E US Stage Count: 988,6561                         2018E New US HZ Wells Drilled: 20,6751
    1Spears   & Associates.                                                                                                                   5
MULTI-WELL PADS CONCENTRATE RISK
                                                                  Barriers to entry continue to increase
SINGLE-WELL PAD COMPLETIONS                                                                                MULTI-WELL PAD COMPLETIONS
                                                                                                   LONGER LATERALS TIGHTER SPACING PAD DRILLING
                                                                                                                   l              l

                                                               Concentration of dollars / pad + exponential impact of Non-Productive Time = highly selective customers

•   Total well cost: $5-$7mm                                             •   Total pad cost: $30-$42mm
•   ~8,000 feet of lateral length completed                              •   ~48,000 feet of lateral length completed
•   40 stages                                                            •   240 stages
•   12mm pounds of sand                                                  •   72mm pounds of sand
•   1,000 boe/d oil produced                                             •   6,000 boe/d oil produced

E&P Revenue/Day = ~$65,0001                                                                              E&P Revenue/Day = ~$390,0001

                                                               Increased capital
                                                                   efficiency

        Source: Spears & Associates and Company Estimates, 1Assumes IP rates of 1,000 boe/d at $65 WTI                                                         6
SUSTAINABLE VALUE PROPOSITION OF
SERVICE & TECHNOLOGY
Service and technology drives efficiencies and lowers total cost of ownership for operators
SERVICE/TECHNOLOGY PERFORMANCE DAYS SAVED REVENUE GENERATION FOR OPERATORS1
Scorpion Composite Plug 122 plugs drilled out ~2.5 days per 6 well pad = $975K
with 1 drill-bit. well
Eliminated a bit trip 21 well pad = $3.4mm
Toe Valves Prep and stimulate ~1 day per 6 well pad = 390k
stage 1 in under 5 hours well
21 well pad = $1.4mm
Nine Wireline 10+ stages per day with ~1.75 days2 6 well pad = $683k
99% success rate per well
21 well pad = $2.4mm
Illustrative Days Saved ~5.25 days 6 well pad = $2.1mm
and Revenue Generated per well
21 well pad = $7.2mm
1Assumes IP rates of 1,000 boe/d at $65 WTI. 2Assumes 70 stages per well with competitive comparison at 8 stages per day. 73-PRONGED STRATEGY TO
TECHNOLOGY ACQUISITION
INTERNAL R&D IP ACQUISITION STRATEGIC ALLIANCES
Keep It Simple Deliberate & Careful Distribution Hub
• Focus on creating tools that • Used to secure technology that • Requires broad NAM footprint
lower operator costs and is prolific in the wellbore and service offering to secure
increase production today and tomorrow volume for partners
• Less “bells and whistles” and • Valuations must be right due • Focused and technical sales
more assurance on successful to rapidly evolving technology team coupled with marketing
deployment at 30,000+ feet with shortening payback times effort
downhole • Customer relationships and
• Small team of engineers track-record of successful
thinking about customer conveyance
needs, profitability and
practicality
• Surgical spend on high-
volume tools
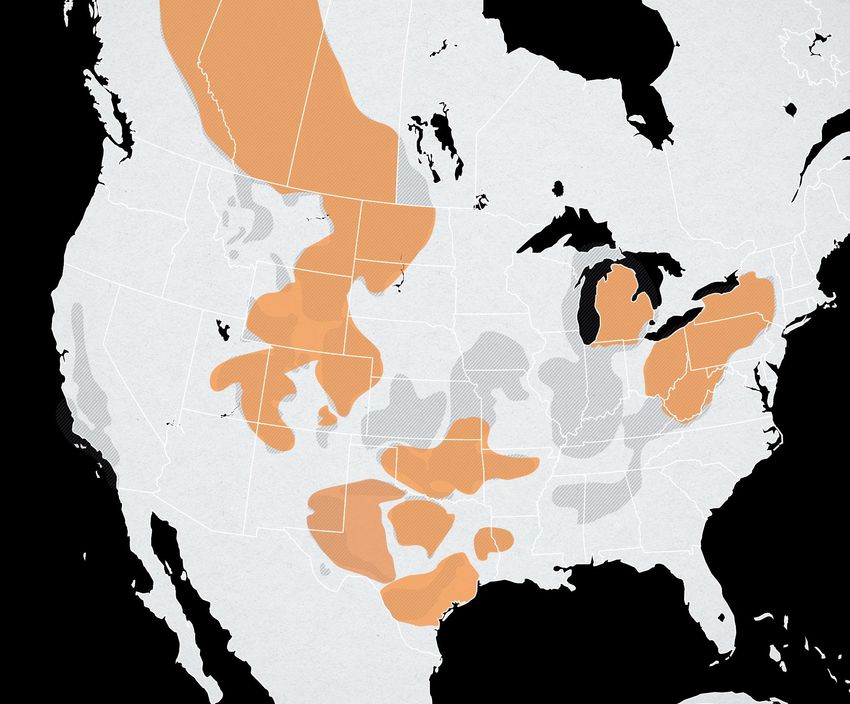
8BROAD FOOTPRINT ENABLES TECHNOLOGY LEADERSHIP
FOOTPRINT IN EVERY
MAJOR NAM BASIN –
Canada 4%
significant benefit to potential
strategic partners through
distribution volume
EXCELLENT NAM REACH Bakken 5%
CAPABILITY –
proximity to
the field, customer Rockies 4%
and acreage
Marcellus / Utica 19%
LOCALIZED TEAMS WITH
REGIONAL KNOWLEDGE –
share best practices
MidCon 10%
internally and
with customers
Permian 38%
Barnett 2%
Haynesville 9%
Service Coverage Area and Revenue by Region1 Eagle Ford 9%
Major Unconventional Basins
1 YTD as of 12/31/2017. 9BARRIERS TO ENTRY THROUGH TECHNOLOGY AND SERVICE
HOW DOES NINE BUILD MOATS AROUND THE BUSINESS?
Service + technology / equipment + people to service the longest laterals today and tomorrow
COMPLETION SOLUTIONS PERFORMANCE BARRIERS EQUIPMENT BARRIERS → FIT FOR “DEEP REACH”
Cementing Services • ~11,100 cementing jobs with on-time • High-quality dedicated Midland, Delaware and Eagle
rate of ~90%1 Ford labs (to API specs) with testing capabilities to
cement laterals over 10,000’ long → Redundant pumps
with 1,000 HP and dual-sided bulk plants
Completion Tools • ~65,000 isolation tools and 18,000 • Owned IP of one of the most critical and prolific
frac sleeves deployed2 isolation tools for laterals reaching beyond 10,000’ →
Highly dependable “toe” solutions
Wireline Services • ~70,000 stages with a success rate of • Conveying greaseless wireline with less friction in super
approximately 99%1 laterals
• Longest wireline completion of 19,000+ feet in lateral
Coiled Tubing Services • ~5,900 jobs and ~115 million running • “Big Pipe” deep reach coil → (4) 2.625” of ~35 in L48
feet of coiled tubing with a success rate and (7) 2.375” coupled with high HP frac pumps to push
greater than 99%3 coil further downhole
PRODUCTION SOLUTIONS PERFORMANCE BARRIERS EQUIPMENT BARRIERS → FIT FOR “DEEP REACH”
Well Services • 66% utilization rate compared to 52% • Fit for purpose fleet
industry average4 • ~40% of fleet capable of performing completion-
oriented work
1Management estimates for time period from January 2014 to December 2017; 2Management estimates for time period from March 2011 to December 2017; 3Management estimates for
time period from April 2014 to December 2017; 4Industry average based on Association of Energy Service Companies; period from January 2015 to December 2017. 10PROOF OF PERFORMANCE
Majority Of Nine’s Completion Work Is Long Laterals
Has Led To Increased Efficiencies And Higher Barriers To Entry
8%
60% 48
78% 10.2
85%
5%
27
5.5
2014 2017 2014 2017 2014 2017
2
Nine US Wireline & Completion 1 Nine Avg. Stages Completed Per Well Stages / Employee / Month 2
Tools % of stages completed
Nine Holds a Competitive Advantage in US Cementing Leading to Significant Market Share Gains
2 2
Nine % rigs followed – South Texas Nine % rigs followed – West Texas
14%
40%
31% 10%
82%
17%
YE 2014 YE 2017 YE 2014 YE 2017
Source: 1Management estimates of Nine frac stages relative to industry frac stages based on Spears & Associates; 2Company Information. 11CUSTOMERS WHO TRUST US
Diverse customer base with minimal concentration → no individual customer more than 10% of 2017 revenues
COMPLETION PRODUCTION
12BUSINESS MANAGED FOR STRONG
RETURN ON CAPITAL
Better OFS returns through cycle dictate a careful blend of capital intensity
COMPLETION TOOLS WIRELINE WELL SERVICE CEMENTING COILED TUBING
EQUIPMENT, PEOPLE & CAPEX
LESS INTENSIVE MORE INTENSIVE
2014 ROIC1
18%
16%
13%
9%
7% 6% 5% 3% 3%
1%
Large Cap Nine Large Cap Large Cap Pres Pump Div Pres Pump Div Other Pres Pump Div Div
(1%)
(7%)
1 ROIC is defined as after-tax net operating profit divided by average total capital. After-tax net operating profit is defined as income (loss) from continuing operations (net of tax) plus interest
expense, less taxes on interest. Total capital is defined as book value of equity plus the book value of debt less balance sheet cash and cash equivalents. Book value of equity is average of current 13
and prior year total equity balances as of 12/31/14. Book value of net debt is average of current and prior year net debt balances as of 12/31/14. See appendix for a ROIC reconciliationRETURNS-FOCUSED GROWTH PHILOSOPHY
Balance of Organic Growth and Strategic M&A:
Augment technology portfolio + Enhance NAM footprint
ORGANIC GROWTH DISCIPLINED M&A
• Strategic expansion of existing service lines within NAM • Continue to consolidate highly fragmented industry
basins
• Target only best-in-class companies and management
• Deployment of capex for high-quality and differentiated teams
equipment and facilities within the most active basins
• Competitive advantage securing and sourcing non-
• Market share gains through service and technology marketed deals
• Securing and maintaining best talent in the industry • Entrepreneurs want to partner and stay with “like-
minded” and nimble management team
NINE PRESENCE
Permian Midcon Northeast Bakken Rockies Canada Eagle Ford Haynesville
Wireline
Cementing
Completion Tools
Coiled Tubing
Well Service
14FINANCIAL OVERVIEW
152017 FINANCIAL PERFORMANCE
REVENUE 2017 OPERATIONAL PERFORMANCE
($ in millions)
• Completion Solutions – revenue increased by
$544
approximately 110% year over year
Q4 17 − Cementing jobs for 2017 increased approximately
75% over 2016. The average blended revenue per job
for the full year 2017 increased approximately 45%
$282 Q3 17
from 2016
+93% Q2 17
− Wireline stages completed in 2017 increased by
approximately 65% over 2016
Q1 17 − Completion tool stages completed in 2017 increased
by approximately 243% over 2016
FY 2016 FY 2017
− Coiled tubing total days worked for 2017 increased by
approximately 48% over 2016 with the average
ADJUSTED EBITDA blended dayrate for 2017 increasing by approximately
39%
($ in millions) $60
Q4 17
• Production Solutions – revenue for the full year
2017 increased by approximately 28% year over year
− Total rig hours worked for 2017 increased by
Q3 17 approximately 26% over 2016
+506% $10 Q2 17
Q1 17
FY 2016 FY 2017
See appendix an Adjusted EBITDA reconciliation 16Q1 2018 FINANCIAL SNAPSHOT
Q1 2018 FINANCIAL & OPERATIONAL PERFORMANCE
13% Revenue growth q/q • Revenue growth driven by Completion Solutions, which grew 15%
quarter over quarter without any new equipment added
Activity levels have continued to strengthen seen through Nine’s
REVENUE
•
$174 utilization and stage count gains
− Number of cementing jobs increased 18% q/q
− Wireline stages completed increased 11% q/q
− Completion Tool stages increased 23% q/q
Q1 2018
29% Adjusted EBITDA growth q/q • Continue to have strategic and thoughtful pricing discussions with
customers
ADJ. EBITDA
14%
Adj. EBITDA margin • Pricing leverage through technology and service, which provides
sustainable value proposition verses supply and demand of equipment
$24 • Company continues to work for the most efficient operators in wireline
and grow market share in completion tools, helping drive margin
Q1 2018
• Q1’18 Cash Flow from Operations: $17.3mm • Continue to see positive movement in ROIC with Company
remaining on track to hit 8% target for 2018
• Q1’18 Capital Expenditures: $6.5mm
• Strong cash flow from operations despite an increase in working
ROIC
capital in conjunction with double-digit revenue growth
3%
Q1 2018
See appendix for a ROIC reconciliation. 17BALANCE SHEET & LIQUIDITY POSITION
PRO FORMA CAPITALIZATION COMMENTARY
As of March 31, 2018 • Nine has a total liquidity position of
($MM) $122.3mm as of 3/31/18
Cash $72.9 • Nine will be disciplined with capital
deployment, with a ROIC-focused
philosophy
Debt
New Revolving Credit Borrowings 0.0
New Term Loan 115.3
Total debt 115.3
Net Debt $42.4
Total cash $72.9
RCF availability 49.4
Total liquidity $122.3
18UNIQUE VALUE PROPOSITION FOR INVESTORS
19CLOSE TO PERFECTION. FAR FROM ORDINARY. DRIVEN TO SUCCEED.
APPENDIX
EBITDA AND ADJ. EBITDA RECONCILIATION
                                                                                 Three Months                                                                                                                   Six months Six months
                                                                                    Ended                        Three months ended                                   Year ended December 31                       ended      ended
                                                                                                                                                                                                                 June 30,       December
($ mm unless otherwise noted)                                                     31-Mar-18       31-Dec-17    30-Sep-17      30-Jun-17    31-Mar-17       2017          2016          2015          2014         20141         31, 20141
EBITDA Reconciliation
Net income (loss)                                                                      $1.68      ($29.81)       ($5.10)      ($12.10)     ($20.70)      ($67.68)      ($70.90)       ($39.10)      $48.00         $27.10        $20.90
Interest expense                                                                          2.9           3.9           4.1           3.9           3.8          15.7          14.2           9.9          9.6           2.8              6.7
Depreciation                                                                              13.1         13.1          13.2          13.6          13.6         53.4          55.3          58.9          40.2           13.1          27.1
Amortization                                                                               1.9          2.2           2.2           2.2           2.2           8.8           9.1           8.7          6.4            2.1             4.3
Provision (benefit) from income taxes                                                    0.09          -8.0           0.8 -                       2.2          -5.0        -26.3         -14.3          44.5             17          27.6
EBITDA                                                                                $19.71      ($18.55)       $15.20         $7.70         $1.00         $5.26     ($18.70)        $24.00      $148.60        $62.00         $86.60

Adjusted EBITDA Reconciliation
EBITDA                                                                                 $19.71     ($18.55)        $15.20         $7.70         $1.00         $5.26     ($18.70)        $24.00      $148.60        $62.00         $86.60
Impairment of goodwill and other intangible assets                                            -        35.3              -             -             -        35.3           12.2         35.5              -               -             -
Transaction expenses                                                                      0.4           0.2           0.1           0.4             3           3.6               -        0.2           3.9           2.8              1.1
Loss from discontinued operations2                                                            -            -             -             -             -            -               -        0.9          28.2              2         26.2
Loss or gains from the revaluation of contingent liabilities3                              1.1          0.0           0.3           0.1           0.1           0.4           1.7         -0.3              -               -             -
Loss on equity investment                                                                 .08           0.1           0.1           0.2              -          0.4               -           -             -               -             -
Non-cash stock-based compensation expense                                                 2.2            1.2          2.2           2.7           1.5           7.6           5.7           5.5          5.4            1.9             3.5
Loss or gains on sale of assets                                                           0.4          -0.1           0.1           4.4           0.2           4.7           3.3             2             1               -           0.9
Legal fees and settlements4                                                               0.3           0.2           0.2           0.4           0.2           1.0           4.1             -             -               -             -
Inventory writedown                                                                           -         0.3              -             1             -          1.4           0.3          2.8              1               -             1
Restructuring costs                                                                           -            -             -             -             -            -             1.1         3.3             -               -             -
Adjusted EBITDA                                                                        $24.1        $18.71       $18.10        $16.70         $6.10       $59.58         $9.80        $73.90      $188.20        $68.80         $119.40

Revenue                                                                                 173.8       154.28         148.2         135.9         105.4         543.7         282.4         478.5        663.2           240          423.2
% Adj. EBITDA margin                                                                     14%           12%           12%           12%            6%           11%            3%           15%          28%           29%           28%

(1) Nine closed the acquisitions of Crest Pumping Technologies on June 30, 2014 and Dak-Tana Wireline on April 30, 2014 and Beckman closed the acquisitions of RedZone Coil Tubing on May 2, 2014 and Big Lake Services, LLC
on August 29, 2014. As a result, financial results relating to each acquisition for periods prior to the close of each of the aforementioned acquisitions are not reflected in the full year 2014 results. We believe that presenting
investors with the annualized information for the six months ended December 31, 2014 provides a representative period of the profitability of our business in a high demand environment, including six months of results from the
acquisitions of Dak-Tana Wireline, Crest Pumping Technologies and RedZone Coil Tubing and the results of the acquisition of Big Lake Services, LLC from August 29, 2014 through December 31, 2014. For comparative purposes,
we have also included such information for the six months ended June 30, 2014. (2) For 2014, represents a non-cash impairment charge related to the divestiture of certain assets of a subsidiary whose primary focus was
conventional completions. (3) Loss or gain related to the revaluation of liability for contingent consideration relating to our acquisition of Scorpion to be paid in shares of Company common stock and in cash, contingent upon
quantities of Scorpion Composite Plugs sold during 2016 and gross margin related to the product sales for three years following the acquisition. (4) Amount represents fees and legal settlements associated with legal proceedings       22
brought pursuant to the Fair Labor Standards Act and/or similar state laws.
ROIC RECONCILIATION
Three Months Ended Year Ended December 31
($ MM UNLESS OTHERWISE NOTED) 31-Mar-18 2014
After-tax net operating profit reconciliation:
Income (loss from continuing operations net of tax) $1.7 $76.2
Add back: Interest expense 2.9 9.6
Exclude: Taxes on interest (0.6) (3.5)
After-tax net operating profit $4.0 $82.2
Total capital as of prior period-end: 1
Total stockholders' equity $287.4 $192.5
Total debt 242.2 140.8
Less: Cash and cash equivalents (17.5) (18.5)
Total capital $512.1 $314.8
Total capital as of period-end:
Total stockholders' equity $459.4 $389.6
Total debt 115.3 379.7
Less: Cash and cash equivalents (72.9) (24.2)
Total capital $501.8 $745.1
Average total capital $506.9 $529.9
ROIC 3% 16%
ROIC is defined as after-tax net operating profit divided by average total capital. After-tax net operating profit is defined as income (loss) from continuing operations (net of tax)
plus interest expense, less taxes on interest. Total capital is defined as book value of equity plus the book value of debt less balance sheet cash and cash equivalents. Book value of
equity is average of current and prior year total equity balances. Book value of net debt is average of current and prior year net debt balances.
1 For 2014, total capital as of prior year-end is based on Beckman and Nine combined unaudited historical financial information.
23You can also read