SNC-Lavalin: An Overview - Investor Presentation AUGUST 2021

Page created by Rachel Brewer
 
CONTINUE READING
SNC-Lavalin: An Overview - Investor Presentation AUGUST 2021
SNC -Lavalin: A n Overview
Investor Presentation

AUGUST 2021
                             Sydney Metro - Western Sydney Airport project
                             Sydney, Australia
SNC-Lavalin: An Overview - Investor Presentation AUGUST 2021
2

Forward-Looking Statements, Forward-Looking Financial Information and Outlook
Reference in this presentation, and hereafter, to the “Company” or to “SNC-Lavalin” means, as the context may require, SNC-Lavalin Group Inc. and all or some of its subsidiaries or joint arrangements or associates, or SNC-Lavalin
Group Inc. or one or more of its subsidiaries or joint arrangements or associates.

Statements made in this presentation that describe the Company’s or management’s budgets, estimates, expectations, forecasts, objectives, predictions, projections of the future or strategies may be “forward-looking statements”,
which can be identified by the use of the conditional or forward-looking terminology such as “aims”, “anticipates”, “assumes”, “believes”, “cost savings”, “outlooks”, “estimates”, “expects”, “goal”, “intends”, “may”, “plans”, “projects”,
“forecasts”, “should”, “synergies”, “target”, “vision”, “will”, “likely”, or the negative thereof or other variations thereon. Forward-looking statements also include any other statements that do not refer to historical facts. Forward-looking
statements also include statements relating to the following: i) future capital expenditures, revenues, expenses, earnings, economic performance, indebtedness, financial condition, losses and future prospects; ii) business and
management strategies and the expansion and growth of the Company’s operations; and iii) the expected additional impacts of the ongoing COVID-19 pandemic on the business and its operating and reportable segments as well as
elements of uncertainty related thereto. All such forward-looking statements are made pursuant to the “safe-harbour” provisions of applicable Canadian securities laws. The Company cautions that, by their nature, forward-looking
statements involve risks and uncertainties, and that its actual actions and/or results could differ materially from those expressed or implied in such forward-looking statements, or could affect the extent to which a particular projection
materializes. Forward-looking statements are presented for the purpose of assisting investors and others in understanding certain key elements of the Company’s current objectives, strategic priorities, expectations and plans, and in
obtaining a better understanding of the Company’s business and anticipated operating environment. Readers are cautioned that such information may not be appropriate for other purposes.

This presentation also provides, on Slide 15, the Company’s outlook regarding expectations of the Company’s performance in 2021 with respect to certain financial metrics and measures.

Forward-looking statements, forward-looking financial information and the Company’s outlook for 2021 made in this presentation are based on a number of assumptions believed by the Company to be reasonable as at the date
hereof. The assumptions are set out throughout the Company’s 2020 annual Management Discussion and Analysis (“MD&A”) (particularly in the sections entitled “Critical Accounting Judgments and Key Sources of Estimation
Uncertainty” and “How We Analyze and Report our Results”) and as updated in the first and second quarter 2021 MD&A. If these assumptions are inaccurate, the Company’s actual results could differ materially from those expressed
or implied in such forward-looking statements, forward-looking financial information and outlook. In addition, important risk factors could cause the Company’s assumptions and estimates to be inaccurate and actual results or events
to differ materially from those expressed in or implied by these forward-looking statements, forward-looking financial information and outlook. These risk factors are set out in the Company’s 2020 annual MD&A.

Non-IFRS Financial Measures and Additional IFRS Measures
The Company reports its financial results in accordance with IFRS. However, the following non-IFRS measures, additional IFRS measures and other non financial information, are used by the Company in this presentation: Revenues
presented on a constant currency basis, Segment Adjusted EBIT, Segment Adjusted EBIT to segment revenue ratio, Days Sales Outstanding, Adjusted EBITDA, Adjusted net income and Adjusted diluted EPS. Additional details for
these non-IFRS measures can be found below and in Section 9 of SNC-Lavalin’s MD&A for the second quarter of 2021, filed with the securities regulatory authorities in Canada, available on SEDAR at www.sedar.com and on the
Company’s website at www.snclavalin.com under the “Investors” section, including the various reconciliations of non-IFRS to the nearest corresponding IFRS measures in sections 4, and 9.4 of the second quarter 2021 MD&A and
Slide 27 of the presentation. Certain revenue figures and changes thereto from prior periods are analyzed and presented on a constant currency basis and are obtained by translating financial results from the comparable periods of
the prior year denominated in foreign currencies at the foreign exchange rates of the current periods. Non-IFRS financial measures do not have any standardized meaning under IFRS and therefore may not be comparable to similar
measures presented by other issuers. Management believes that, in addition to conventional measures prepared in accordance with IFRS, these non-IFRS measures provide additional insight into the Company’s operating
performance and financial position and certain investors may use this information to evaluate the Company’s performance from period to period. However, these non-IFRS financial measures have limitations and should not be
considered in isolation or as a substitute for measures of performance prepared in accordance with IFRS. Furthermore, certain non-IFRS financial measures and additional IFRS measures are presented for PS&PM, by excluding
components related to Capital, as the Company believes that such measures are useful as these P&SPM activities are usually analyzed separately by the Company.
SNC-Lavalin: An Overview - Investor Presentation AUGUST 2021
3

Global leader in professional services & project management
                                                      Founded in
 SNC-Lavalin is…
                                                       1911
 A fully integrated professional services and
 project management company with offices              Employees
 around the world.
                                                    ~38,000
 SNC-Lavalin connects people, technology and
 data to help shape and deliver world-leading        2020 Revenue
 concepts and projects, while offering
 comprehensive innovative solutions across the       ~$7.0B
 asset lifecycle in four strategic sectors.
                                                     Listed on TSX

                                                     “SNC”
                                                      Since 1986

                                                     Credit Rating1

                                                 BB (high) / BB+
      1   Per DBRS and S&P.
SNC-Lavalin: An Overview - Investor Presentation AUGUST 2021
4

Operating in 4 regions across the world

                       Europe
                       ~11,500

      Americas
      ~14,000
                                     Asia
                         Middle     Pacific
                          East      ~4,500
                         & Africa
                         ~7,500
SNC-Lavalin: An Overview - Investor Presentation AUGUST 2021
5

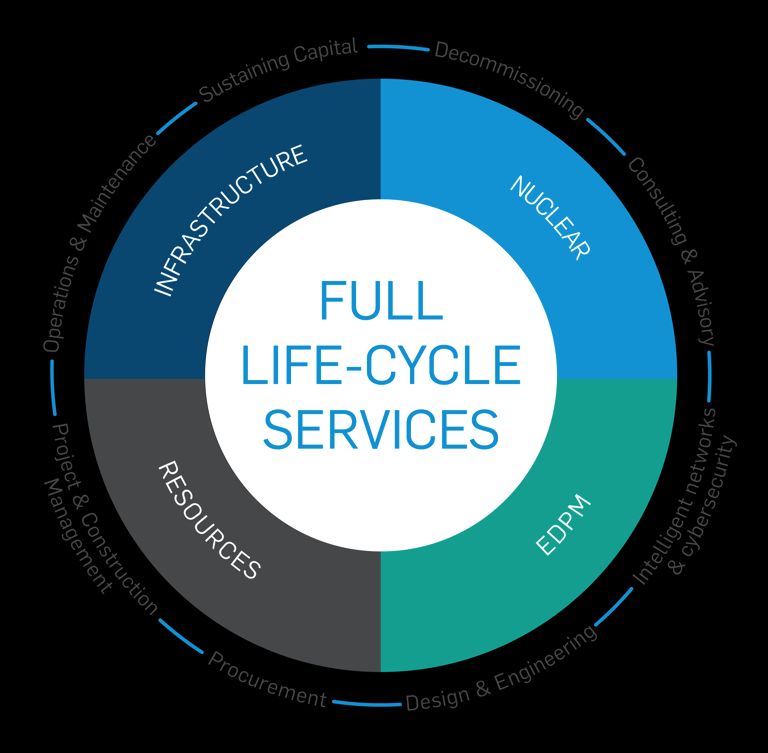
Providing a comprehensive end-to-end service offering …

       Consulting     Intelligent networks          Design       Procurement   Project & Construction     Operations    Sustaining Capital   Decommissioning
       & Advisory       & cybersecurity          & Engineering                      Management          & Maintenance

…in four strategic sectors
                                                                                                                                         Supported by:

  Engineering, Design and                    Infrastructure                Nuclear                        Resources                           Capital
Project Management (EDPM)
SNC-Lavalin: An Overview - Investor Presentation AUGUST 2021
6

With a breadth of geographic and industry exposure
                 Geographic areas                                                                   Industry segments                                                Industry segments

                           Asia Pacific                                                     Infrastructure EPC                                                   Infrastructure EPC
    Middle East &                                                                                 Projects                                                             Projects
    Africa                                                 Americas                       Resources
                                  5%                       Canada 30%                      Capital       11%
                                                                                                                                                              Resources       12%
                                                                                                                                                                                                EDPM
                           11%                             USA 20%
                                                                                                                                                               Capital                    23%
                                                           Latin America 1%                                                                                   Nuclear
                                                                                      Nuclear1                                                                           6%
                                  2020                                                                 13%          2020                         EDPM                         June 30, 2021
                                 Revenue            51%                                                            Revenue             53%
                                                                                                                                                                                Backlog
                                  $7.0B                                                                             $7.0B                                                        $13.0B
                     33%
                                                                                                           19%

    Europe                                                                           Infrastructure                                                         Infrastructure          56%

                                                                                        Services                                                              Services2

 1 40%    of Nuclear revenues are from final decommissioning, waste management and environmental clean-up
 2 The   Infrastructure Services backlog includes the full term of the Company’s O&M signed long-term contracts, which can cover a period up to 40 years.
SNC-Lavalin: An Overview - Investor Presentation AUGUST 2021
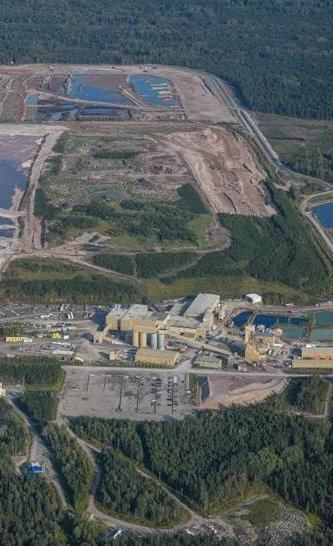
7

Strategic Priorities
SNC-Lavalin: An Overview - Investor Presentation AUGUST 2021
8

Strategic Priorities

       Closing the     Running off LSTK   Driving consistent    Building a       Positioned for
      Oil & Gas sale       projects        performance in       connected        growth and a
                         successfully        Engineering       collaborative   sustainable future
                                               Services        organization

 Positioning SNC-Lavalin for long-term sustainable success and becoming a leading provider of
              professional engineering services and project management solutions
9

Positioning for growth

  › Leveraging Company’s expertise in Nuclear and Transportation across current service offerings
    in core regions of Canada, U.S. and U.K.

  › Delivering major infrastructure projects through risk-capped opportunities

  › Expanding water & environment business in Canada and U.S.

  › Underpinned by continued digital transformation to improve productivity

                              Investor Day to be held September 28, 2021
10

Our vision for engineering a sustainable society
Net Zero Carbon 2030                                                   Key ESG Objectives

Set annual targets, externally verified, with   ED&I                                                Integrity & Governance
annual updates published via the Carbon         ›   Increasing diversity & social inclusion
Disclosure Project                              ›   Increasing representation of women              ›   Maintaining a high standard of
                                                    across the organization                             engagement towards integrity
Detailed routemap - key actions:                ›   Providing support to diversity groups
  ›   Prioritizing low carbon real estate
  ›   New travel policy                         12 Key ESG targets and commitments to align with SNC-Lavalin’s commitment to
  ›   Behavioural change across our             the UN Global Compact
      operations to increase digitalization
                                                Energy, water and raw materials consumption, transport, environmental pollution, health
  ›   Developing electric vehicle leasing /     & wellbeing, climate, biodiversity, diversity, community, integrity and human rights
      rental with global travel providers
  ›   Energy purchase contracts prioritizing
      low and zero-carbon energy sources
                                                                      Engineering Net Zero
  ›   Interim targets on the path to 2030
                                                ›   Providing solutions to clients prioritizing clean and affordable energy solutions,
                                                    and developing sustainable infrastructure, transport and cities
11

SNCL Engineering Services &
Capital
12

              EDPM latest results
                               Revenues ($M)                                               Segment Adjusted EBIT* ($M)                                                                       Backlog
                      Up 0.2% as reported and +5.3%
                      on a constant currency basis1*
                                                                                                              8.4%                                    9.1%

                            934                                    935                                                                                 85
                                                                                                                                                                                           $3.0B
                                                                                                                79
                                                                                                                                                                                               (+12% YoY)

                      Q2 2020                                Q2 2021                                     Q2 2020                                Q2 2021
                                                                                                                Segment Adj. EBIT to segment revenue ratio* (%)

                Q2 Key highlights
                ›        Strong performance across all regions, particularly in the UK
                ›        Record Backlog driven by major wins in the UK, ME and Australia. Sydney
                         Metro award is a key step in realizing our ambition in Australia
                ›        Award from UK Gov Property Agency to help deliver Net Zero targets
                ›        Digital transformation investment delivering returns from new Revenues in
                         Design, Program Management and Digital Twin wins
1Revenue figure and change from prior period presented on a constant currency basis obtained by translating revenues from comparable period of prior year denominated in foreign currencies at foreign exch. rates of current period.   Sydney Metro - Western Sydney Airport project
*Non-IFRS financial measures. Refer to Section 9 of the Company’s Q2 2021 MD&A for Non-IFRS financial measures definition and reconciliation to IFRS measures. See also the cautionary statement regarding Non-IFRS financial
measures at slide 2. www.snclavalin.com/en/investors/financial-information/quarterly-reports
                                                                                                                                                                                                                                        Sydney, Australia
13

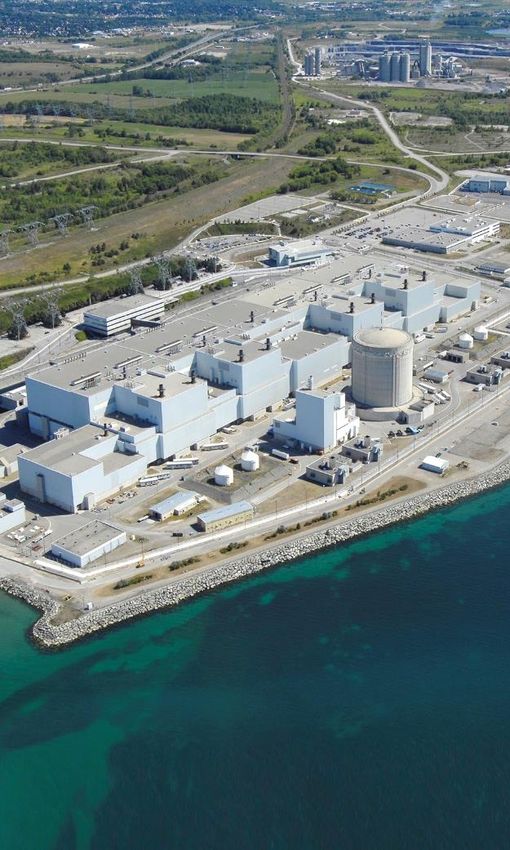
              Nuclear latest results
                                          Revenues ($M)                                                                          Segment Adjusted EBIT* ($M)
                             Up 6.1% as reported and +9.6% on a
                                  constant currency basis1*
                                                                                                                                             14.0%                                             14.2%

                                  221                                               235
                                                                                                                                                31                                                33

                            Q2 2020                                           Q2 2021                                                    Q2 2020                                           Q2 2021
                                                                                                                                                       Segment Adj. EBIT to segment revenue ratio* (%)

                 Q2 Key highlights
                 ›        Strong revenue growth driven by increased support of assets for North
                          American and European clients
                 ›        Increased demand for Canadian Engineering and Field services
                 ›        Opportunities in New Build and Decommissioning activities in core markets
                 ›        Contract expansion for medical isotope extraction at Oakridge facility
1Revenue figure and change from prior period presented on a constant currency basis obtained by translating revenues from comparable period of prior year denominated in foreign currencies at foreign exch. rates of current period.   Darlington Nuclear Generating Station
*Non-IFRS financial measures. Refer to Section 9 of the Company’s Q2 2021 MD&A for Non-IFRS financial measures definition and reconciliation to IFRS measures. See also the cautionary statement regarding Non-IFRS financial
measures at slide 2. www.snclavalin.com/en/investors/financial-information/quarterly-reports
                                                                                                                                                                                                                                        Ontario, Canada
14

                                                                                                                                                                                                                                                                    Picture to be included

              Infrastructure Services latest results
                                          Revenues ($M)                                                                          Segment Adjusted EBIT* ($M)
                            Up 6.3% as reported and +9.2% on a
                                 constant currency basis1*
                                                                                                                                              7.3%                                               7.9%

                                  315                                               334
                                                                                                                                                23                                                26

                            Q2 2020                                           Q2 2021                                                    Q2 2020                                           Q2 2021
                                                                                                                                                       Segment Adj. EBIT to segment revenue ratio* (%)

                Q2 Key highlights
                ›        Revenue growth driven by increased activity level in Linxon
                ›        Linxon at record backlog; major projects in US in support of low carbon
                         agenda
                ›        Solid O&M delivery; continuing to build opportunities in the rail & transit,
                         hydro, pharmaceutical and social infrastructure markets
1Revenue figure and change from prior period presented on a constant currency basis obtained by translating revenues from comparable period of prior year denominated in foreign currencies at foreign exch. rates of current period.   Taku  River Tinglit First Nation
                                                                                                                                                                                                                                        XXXXXXXXXXXXXXXXX
*Non-IFRS financial measures. Refer to Section 9 of the Company’s Q2 2021 MD&A for Non-IFRS financial measures definition and reconciliation to IFRS measures. See also the cautionary statement regarding Non-IFRS financial
measures at slide 2. www.snclavalin.com/en/investors/financial-information/quarterly-reports
                                                                                                                                                                                                                                        British Columbia, Canada
15

SNCL Engineering Services Outlook1
    Metric                                                                                                                                                                                                                     2021 Outlook
    SNCL Engineering Services revenue growth                                                                                                                                                                      Low single digit percentage

    SNCL Engineering Services Segment Adjusted EBIT to segment revenue ratio*                                                                                                                                           Between 8% and 10%

    Metric                                                                                                                                                                                                                            Targets
    Segment adjusted EBIT to segment revenue ratio*

    • EDPM                                                                                                                                                                                                                          8% to 10%

    • Nuclear                                                                                                                                                                                                                      13% to 15%

    • Infrastructure Services                                                                                                                                                                                                        5% to 7%

1Thisslide contains forward-looking statements and financial outlook. See the cautionary statement at slide 2.
*Non-IFRS financial measures. Refer to Section 9 of the Company’s Q2 2021 MD&A for Non-IFRS financial measures definition and reconciliation to IFRS measures. See also the cautionary statement regarding Non-IFRS financial measures at slide 2.
www.snclavalin.com/en/investors/financial-information/quarterly-reports
16

   Capital latest results
                              Revenues ($M)                                                                        Segment Adjusted EBIT* ($M)

                       22                                               20                                                        18                                              16

                Q2 2020                                          Q2 2021                                                   Q2 2020                                         Q2 2021

     Q2 Key highlights
     ›        H407 ETR traffic increased sequentially from Q1 and by 52% YoY; progress
              of the vaccine roll-out in Ontario led to gradual easing of restrictions
     ›        Other concessions performing well
     ›        Pipeline of opportunities in Canada, US and the UK

*Non-IFRS financial measures. Refer to Section 9 of the Company’s Q2 2021 MD&A for Non-IFRS financial measures definition and reconciliation to IFRS measures. See also the cautionary statement regarding Non-
                                                                                                                                                                                                                  Highway 407
IFRS financial measures at slide 2. www.snclavalin.com/en/investors/financial-information/quarterly-reports                                                                                                       Ontario, Canada
17

Capital investments portfolio
                                                                                                                    Held         Concession                         Equity
 Name                                             Description                                                                                   Location
                                                                                                                    Since          Years                         Participation

 1. 407 EDGGP                                     32 km H407 East extension (Phase 1)                                2012            33       Canada (Ontario)       50%
 2. Carlyle Global Infras. Opportunity Fund
                                                  Holding investments in infrastructure projects                     2018            n/a       United States         4.5%
    LP
 3. Eglinton Crosstown                            19 km light rail line                                              2015            36       Canada (Ontario)       25%
 4. Highway 407 ETR                               108 km electronic toll road                                        1999            99       Canada (Ontario)       6.76%
 5. Highway Concessions One PL                    Fund (Roads)                                                       2012            n/a           India             10%
 6. InPower BC                                    John Hart 126 MW generating station                                2014            19        Canada (B.C.)         100%
 7. Myah Tipaza                                   Seawater desalination plant                                        2008            n/a          Algeria            25.5%
 8. Rideau                                        Light rail transit system                                          2013            30       Canada (Ontario)       40%
 9. SKH                                           1,227 MW gas-fired power plant                                     2006            n/a          Algeria            26%
 10. SSL                                          New Champlain bridge corridor                                      2015            34       Canada (Quebec)        50%
 11. TC Dôme                                      5.3 km electric cog railway                                        2008            35           France             51%
 12. TransitNEXT                                  12 km light rail line                                              2019            30       Canada (Ontario)       100%
                                                                       Ownership through SNC-Lavalin Infrastructure Partnership LP
 13. Chinook                                      25 km six-lane road                                                2010            33       Canada (Alberta)       10%
 14. InTransit BC                                 Rapid transit line                                                 2005            35        Canada (B.C.)         6.7%
 15. MIHG                                         McGill University Health Centre                                    2010            34       Canada (Quebec)        10%
 16. Okanagan Lake                                Floating bridge                                                    2005            30        Canada (B.C.)         20%
 17. Rainbow                                      Restigouche Hospital Centre                                        2011            33        Canada (N.B.)         20%

                                                 NBV1 = $504M                                                                  FMV2 ~$2.3B
                                              1 Net Book Value as at June 30, 2021                                                                                                    17
                                              2 Average Fair Market Value as per analysts calculations, as at August 4, 2021
SNCL Projects
19

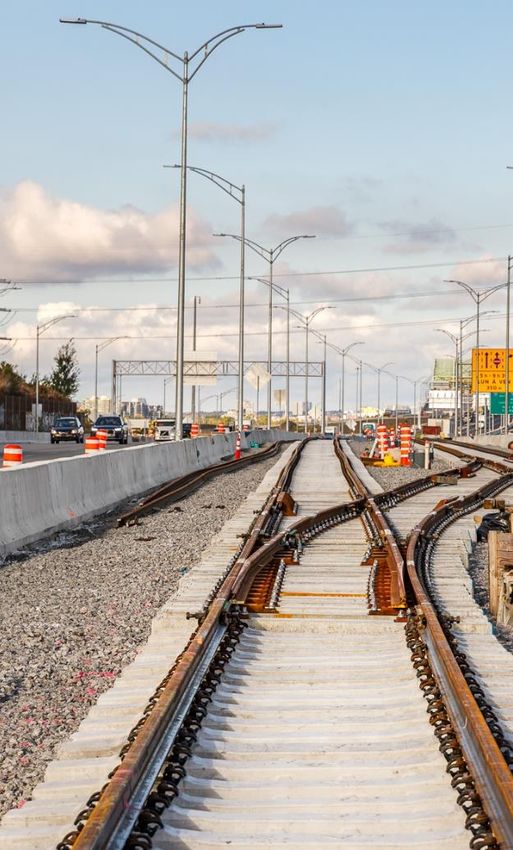
   Infrastructure EPC Projects latest results
                  Revenues ($M)                                               Segment Adjusted EBIT* ($M) LSTK Backlog

                183                                 233                                          -19                                  -22
                                                                                                                                                                           $1.3B
                                                                                                                                                                                (-45% YoY)

          Q2 2020                              Q2 2021                                     Q2 2020                              Q2 2021

     Q2 Key highlights
     ›        Remaining 3 LSTK projects continue to progress well
     ›        LSTK construction contracts backlog down by ~13% vs end of March
     ›        Loss due to reduction of gross margin, including costs of closing out certain
              projects and impacts of COVID-19
     ›        Constructive discussions ongoing with clients on compensation for
              additional costs related to COVID-19 impacts
*Non-IFRS financial measures. Refer to Section 9 of the Company’s Q2 2021 MD&A for Non-IFRS financial measures definition and reconciliation to IFRS measures. See also the cautionary statement regarding Non-
                                                                                                                                                                                                                  Réseau Express Métropolitain (REM)
IFRS financial measures at slide 2. www.snclavalin.com/en/investors/financial-information/quarterly-reports                                                                                                       Quebec, Canada
20

    Resources latest results
                             Revenues ($M)                                                                        Segment Adjusted EBIT* ($M)

                                                                                                                                                                                   1
                                                                       41
                                                                                                                                -72
                      -14
               Q2 20201                                         Q2 2021                                                  Q2 20201                                         Q2 2021

     Q2 Key highlights
     ›       Mining business performed well; strong growth potential
     ›       Significant progress made towards the closing of the O&G business sale
                    ›        Closed the sale of a substantial portion (i.e., ~75% of business)
                    ›        Balance of closing relates to Saudi Arabian portion; receipt of
                             regulatory approval expected by end of Q3 2021
1 Comparative figures have been re-presented as a result of an operation discontinued in 2020.                                                                                                                    Niobec Mine Expansion project
*Non-IFRS financial measures. Refer to Section 9 of the Company’s Q2 2021 MD&A for Non-IFRS financial measures definition and reconciliation to IFRS measures. See also the cautionary statement regarding Non-
IFRS financial measures at slide 2. www.snclavalin.com/en/investors/financial-information/quarterly-reports                                                                                                       Quebec, Canada
21

Remaining LSTK projects in SNCL Projects backlog
                                                      Expected
                                   Approximate       substantial   Backlog as at
     Project             Country   Completion %                    June 30, 2021      Client
                                                     completion
                                    (SNCL portion)                     ($M)
                                                        year

M&M Project #1            MENA          ~90%            2021
22

          SNCL Projects Backlog phasing
          1,000                                 Infrastructure EPC projects   Resources
           900
           800
           700
           600
(in $M)

           500
           400
           300
           200
           100
             0
                  2021 (Last 6 months)         2022                           2023        2024
                                         Expected annual conversion to Revenue
Balance sheet &
Days Sales Outstanding (DSO)
24

Balance sheet and Days Sales Outstanding (DSO)*
              Selected balance sheet items                                                                                                                                          Days sales outstanding*
                                                                                                                                                                                            (EDPM)
                         As at March 31, 2021                         As at June 30, 2021

                                                                          $1,396M 1,397M
                                                                                                                                                                         71                       68
                                                                                                                                                                                                                          64                       61                       58

             $703M                  $663M

               Cash and cash                                             Recourse debt and                                                                       Q2 2020 Q3 2020 Q4 2020 Q1 2021 Q2 2021
                equivalents                                            limited recourse debt
*Other non-financial information. Refer to Section 9 of the Company’s Q2 2021 MD&A for certain definitions of non-IFRS financial, additional IFRS and other non-financial information and measures. See also the cautionary statement regarding Non-IFRS financial, additional IFRS and other
non-financial measures and information at slide 2. www.snclavalin.com/en/investors/financial-information/quarterly-reports
Appendix
26

 407 ETR Information
  (in $M, unless otherwise indicated)
                                                                                                                                                                    Q2 2021                              Q2 2020                              Change
  Revenues                                                                                                                                                               212.2                                129.6                                63.7%
  Operating expenses                                                                                                                                                      32.8                                 36.2                                (9.4)%
  EBITDA*                                                                                                                                                                179.4                                 93.4                                92.1%
  EBITDA as a percentage of revenues*                                                                                                                                   84.5%                                72.1%                                 +12.4%
  Net income (loss)                                                                                                                                                       24.7                                (46.9)                                n.a.

  Traffic / Trips (in millions)                                                                                                                                           16.3                                 10.7                                52.3%
  Average workday number of trips (in thousands)                                                                                                                         214.0                                139.8                                53.1%
  Vehicle kilometers travelled “VKT” (in millions)                                                                                                                       342.8                                210.9                                62.5%

  Dividends paid by 407 ETR                                                                                                                                                0.0                                  0.0                                 n.a.
  Dividends paid to SNC-Lavalin                                                                                                                                            0.0                                  0.0                                 n.a.

*Non-IFRS financial measures. Refer to 407 International Inc. Q2 2021 MD&A, which is available under 407 International Inc.’s profile on Sedar at www.sedar.com, for Non-IFRS financial measures definition and reconciliation to IFRS measures.
27

 Reconciliation of IFRS net income (loss) from continuing
 operations to adjusted net income from PS&PM
                                                                                                           Q2 2021                             Q2 20201
                                                                                                  In $M        Per diluted EPS in $   In $M         Per diluted EPS in $
 Net income (loss) attributable to SNC-Lavalin shareholders from continuing
                                                                                                  29.2                0.17            (25.3)               (0.14)
 operations (IFRS)
 Restructuring and transformation costs                                                           15.2                                23.9
 Amortization of intangible assets related to business combinations                               20.5                                40.0
 Gain on remeasurement of assets of disposal group classified as held for sale to fair
                                                                                                  (0.9)                                 -
 value less cost to sell
 Income taxes and non-controlling interests on adjustments above                                  (7.1)                               (10.3)
 Total adjustments                                                                                27.6                0.16            53.6                 0.31

 Adjusted net income attributable to SNC-Lavalin shareholders (non-IFRS)                          56.8                0.32            28.3                 0.16
 Segment adjusted EBIT from Capital                                                               (16.4)                              (18.4)
 Corporate selling, general and administrative expenses not allocated to the
                                                                                                   7.0                                 7.0
 segments - Capital
 Net financial expenses from Capital                                                               4.3                                 4.2
 Income taxes from Capital on adjustments above                                                    2.0                                 0.5
 Total adjustments to exclude Capital                                                             (3.1)               (0.02)          (6.6)                (0.04)
 Adjusted net income attributable to SNC-Lavalin shareholders from PS&PM                                                                                   0.12
                                                                                                  53.8                0.31            21.7
 (non-IFRS)
1 Comparative   figures have been re-presented as a result of an operation discontinued in 2020
28

SNC-Lavalin
Denis Jasmin                                      Tel.: 514-393-8000 Ext. 57553
Vice-President, Investor Relations                E-mail: denis.jasmin@snclavalin.com
                                                  www.snclavalin.com
 Firm                         Analyst            Rec.      Tel                                Market Details

 ATB Capital Markets          Chris Murray       Buy        647-776-8246     Price as of August 4, 2021        $33.19
 BMO Capital Markets          Devin Dodge        Hold       416-359-6774
                                                                             Shares outstanding – Diluted      175.6M
 Canaccord|Genuity            Yuri Lynk          Buy        514-844-3708
 CIBC World Markets           Jacob Bout         Buy        416-956-6766
                                                                             Market capitalization             $5.8B
 Desjardins Securities        Benoit Poirier     Buy        514-281-8653
 Laurentian Bank Securities   Sun Troy Ye        Buy        416-399-7635     52 - week high / low              $33.94 / $17.50
 National Bank Financial      Maxim Sytchev      Buy        416-869-6517
 Raymond James                Frederic Bastien   Buy        604-659-8232     Dividend per share                $0.02 / quarter
 RBC Capital Markets          Sabahat Khan       Buy        416-842-7880
 Scotia Capital               Mark Neville       Buy        514-350-7756     Dividend yield                    ~0.2%
 TD Newcrest                  Michael Tupholme   Buy        416-307-9389

                                                                                                                                 28
You can also read